American Jerk behind COVID surge : Derivatives of displacementCleaner Chart:
The recent increase in acceleration (known as "jerk") of US COVID cases is "re-bending the curve". In this context the verbal descriptions of change, and its derivatives ,becomes both interesting and important Charts showing ongoing change in confirmed US COVID19 cases are themselves constantly changing. Understanding these 'charts of change' is a prerequisite for making informed public policy decisions, as well as individual decision making (to mask or not to mask?). Yet verbal explanations of change are outpacing graphical representations in mainstream media. This is the position taken in the NYT article "Bending the curve". To quote the author:
As an old Chinese philosopher never said, “Words about graphs are worth a thousand pictures.”
The public at large understands the concept of displacement: change over time. For example, is the number of new cases per day going up or down? However, the derivatives of displacement are not commonly understood. You may get a blank stare in response to questions like:
1) The US flattened the curve in the spring of 2020. Did that mean fewer new cases per day?
2) "A jerk is responsible for recent spikes in new cases" Is that:
a) a description of change?
b) a political statement?
Methodology:
The chart is a brief overview of the first 4 derivatives of displacement [Left panel and there application to recent (10/25/2020) data on he number of confirmedrUS COVID19 cases.
Raw data was TV's ticker "COVID19:CONFIRMED_US" Each derivative was calculated on a 7-day SMA of the previous step. Both 5MA and 7MA are commonly used in summary graphs published by John Hopkins (2). Deritives are shown for Acceleration and Jerk. A BB% score shows that both Acceleration and Jerk are 2STD above their mean. It is statistically likely that ,as the Jerk becomes more prominent we may experience an upward "Snap" in US COVID cases. While its easy to visualize an acceleration or even a jerk in virus spread (both have exponential growth), it is much harder, and is left as an exercise for the reader, to visualize "snap" spread of a disease.
Another conclusion is that any attempt to "re-flatten the curve" will fail in the presence of persistent jerk.
(1) www.nytimes.com
(2) coronavirus.jhu.edu
Elections

GOLD Reached TOP of the Channel! Great SHORT OpportunityIn this technical analysis on gold, I will show you how I used a parallel channel, horizontal support and resistance zones and a head and shoulders pattern to conclude a short trade set-up. All information is available on the chart.

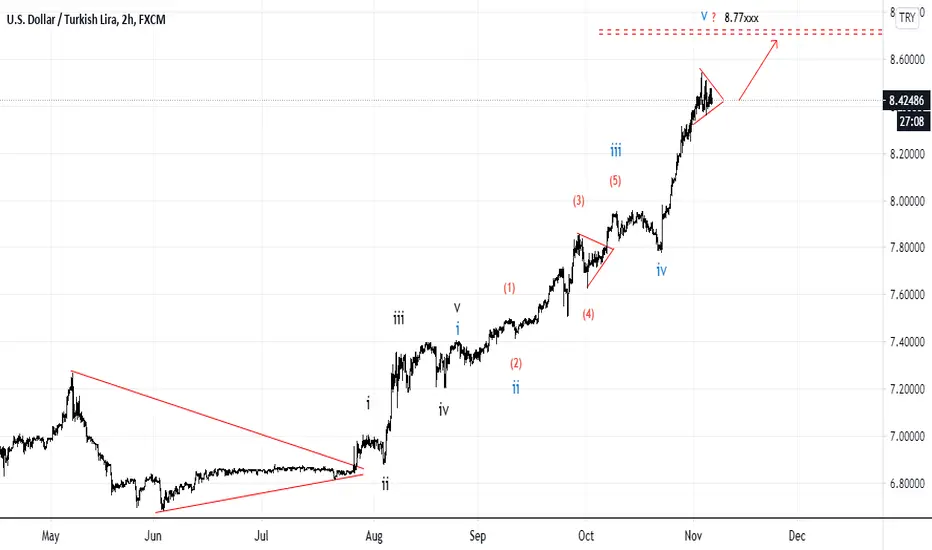
USDTRY Turkish Lira Struggling & Bullish Momentum Remains!Analysis based on Fundamentals and Price Action.
With risk Management you Will NEVER loss.
Thank you.
GOLD & US ELECTIONS: What to Expect & Where are We Going???
Daily/4H/1H time frame analysis on gold.
Price action, patterns, structure discussed.
Bearish scenario explained.
Please, support this video with like and comment!
Thank you!

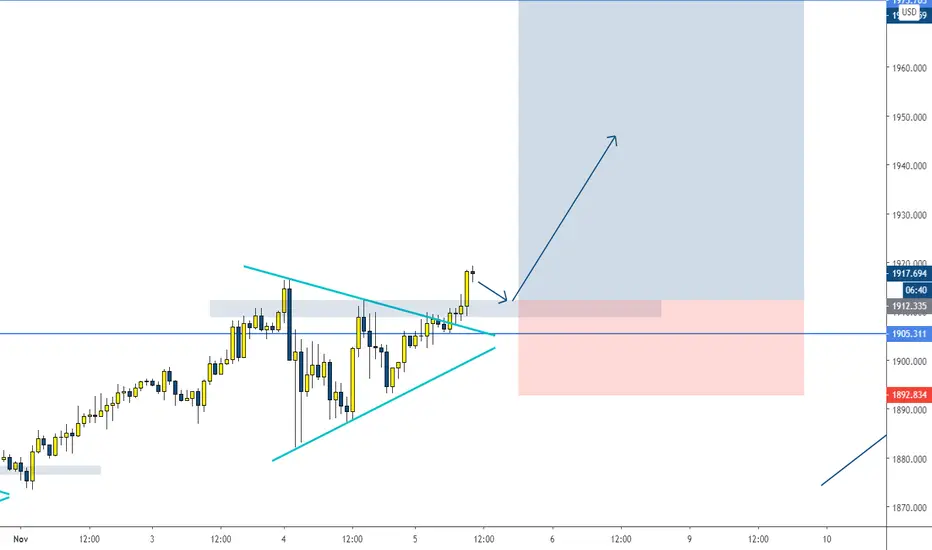
XAUUSD coming out of election day uncertainty#XAUUSD (Gold) (1H):
The large indecision of the past days is reflected on the chart, forming a triangle, which is now being broken to the upside.
This could be a good opportunity for a medium term buy position if the retest + rejection of previous high will occur.
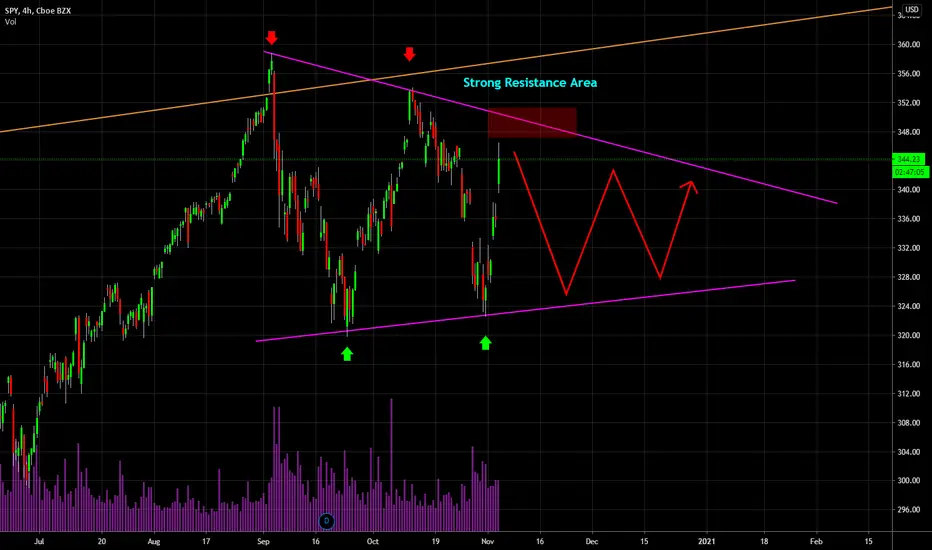
SP500: A WORD OF CAUTIONA massive spike in stock prices has occured this week, rallying towards the upper trend line of the September wedge.
Unless both sides of the US elections will accept the result soon, be careful in this market. If there's one thing that investors dislike, it's uncertainty.
With Trump already questioning the results beforehand, chances are that the stock market will face massive swings. Expect a lot of volatility in the coming 2 weeks!
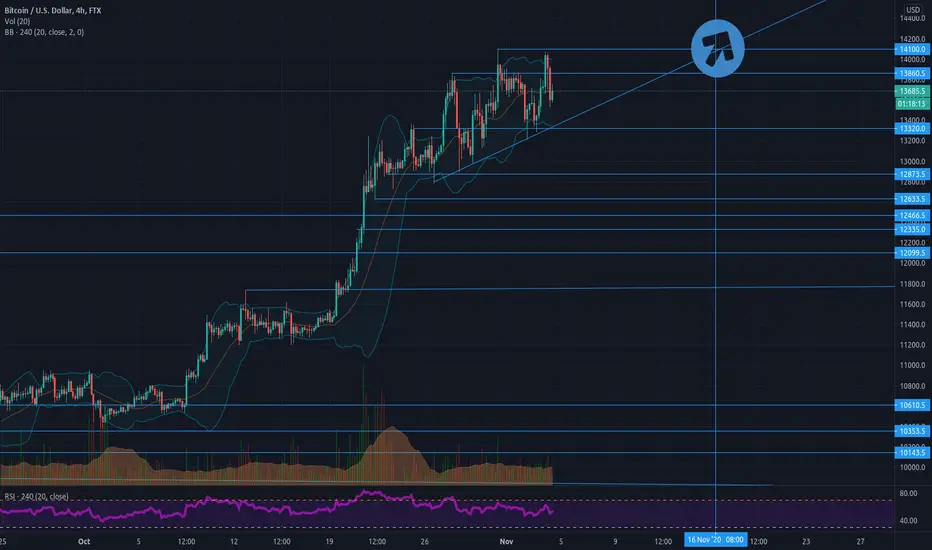
Bitcoin ascending Triangle - normal PA not the electionthe recent drops have not been lower than RSI 50 and to about the midle of bolinger bounds on 4H
Keeps printing higher lows and 14100 will break sometime between now and Nov 16
targets 15K and 16K
ABout elections thy happen to be every 4 years and bitcoin halving is every 4 years so dont think Bitcoin price is affected by elections
it may however have temporary wicks because is traded mainly against USDT / USD
2020 had bitcoin halving so expect btc to moon in 2021 however it will be quite a bumpy ride
If you are as me and have less than top day trade experience only buy the low dips and sell at resistance , TV has lots of info on resistance targets, it often gets that right but gets support levels wrong because most people dont understand bitcoin's and other crypto major coins value and use only TA
Grab 100 PIPS while you can before resultsPrice action needs no further explanation here
Please hit Like & Follow to support more analysis. You can also comment to share your bias.
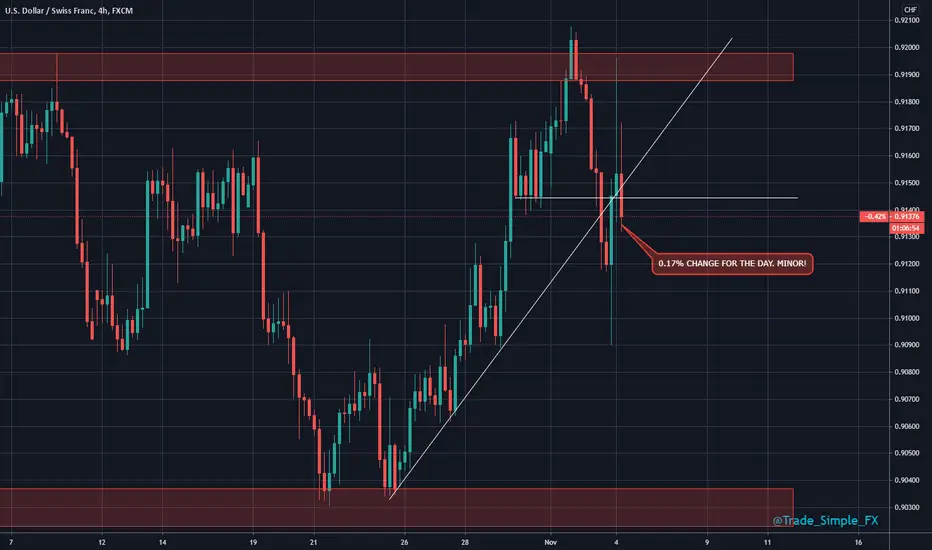
USDCHF H4 - NeutralUSDCHF H4 - A snapshot example of the election impact on USD and risk pairs, technical structure holding, but that's nothing to base a trade off during these times. Much of TA on other pairs aren't infact holding. Wicks upside, wicks downside with no clear direction, and we are yet to decipher market direction until more clarity comes to the surface. I'll provide a summary on all headlines probably around UK lunchtime, there is some eastern headline catching up to do, plus getting ahead of todays headlines too.
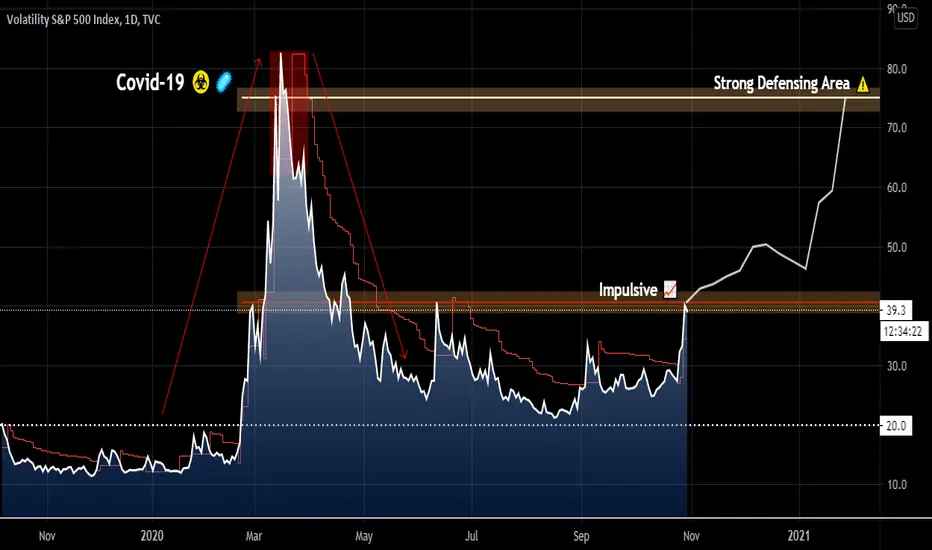
Ridethemacro | VIX Volatility in Coming Days.Analysis based on FA+PA.
With Risk Management You will Never loss.
VIX Background Chart: ⤵️
Ridethemacro |XAU/USD Trade of the week (Elections) Tarde Analsysis absed on Price action and fundamnetals:
WIth Risk Management you will never loss.
Thank you
GOLD UPDATE| TECHNICAL ANALYSIS
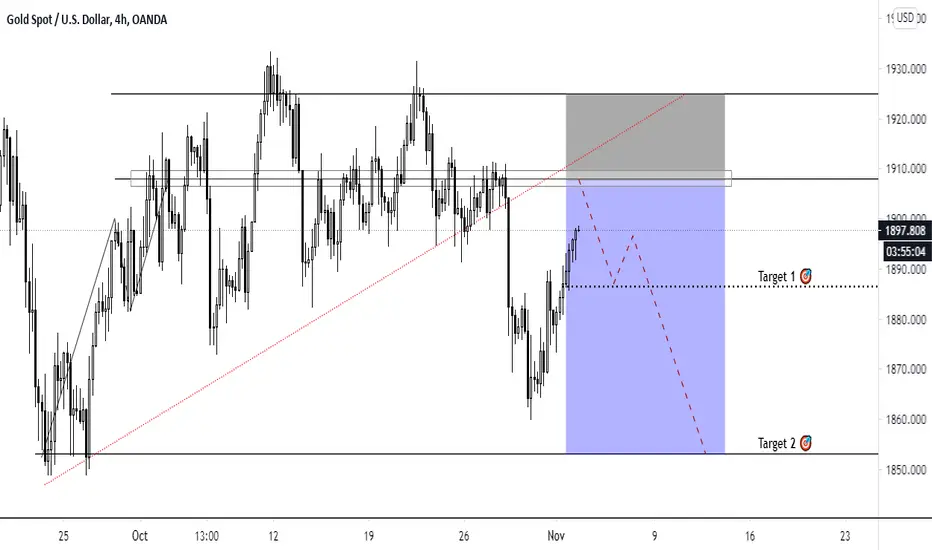
The previously discussed short on GOLD played out nicely and now we are seeing Gold bouncing up from the support.
There are no long opportunities on gold now, but there might be two potential short spots.
One, at the confluence of the falling resistance levels. The other, at the confluence of the green horizontal key level and the rising resistance line.
In both cases, I'd be looking for a reversal pattern and a confirmation for me to enter a short.
In the Video, I forgot to mention, that this week is the US presidential election week and so many might seek to buy gold as a safe haven, so I would not keep large positions open!
It does not mean we should not trade, but I would enter the trades I discussed only if I see a SUPER solid entry point!
Thanks for watching!
Like and Subscribe to never miss a new video!
See you then!

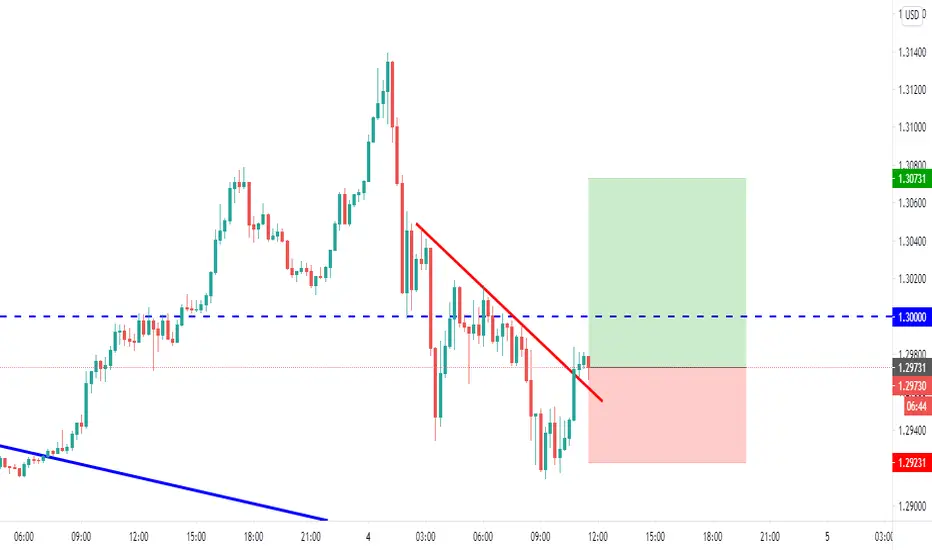
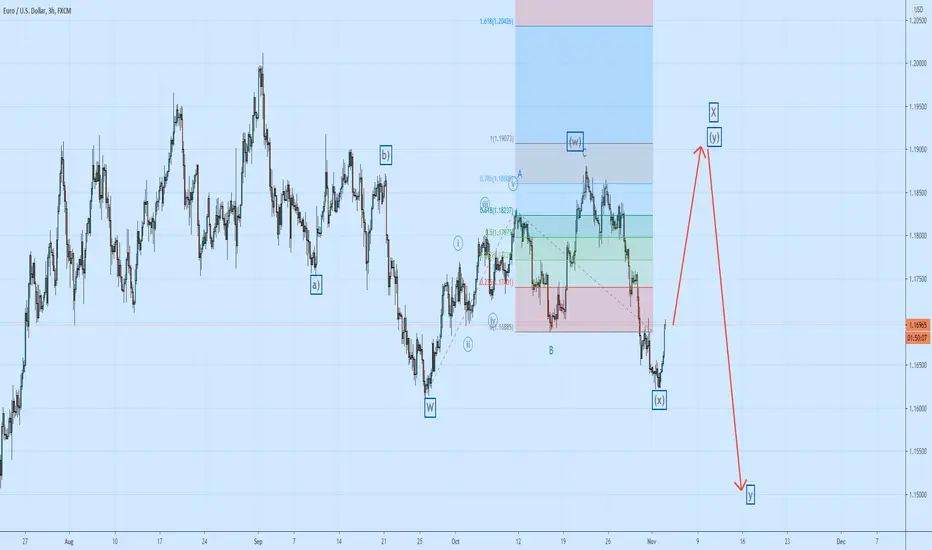
Euro Dollar to spike before a Sell-Offthe pair is completing a complex corrective cycle labeled as W,X,Y, which in my opinion can be already done and we will start looking to short the pair from current levels.
however because of the US Elections today im assuming there might be a more Complex scenario that can push the euro higher to an extended wave (X) before falling down.
thats why i will be putting sell limit orders on the eurusd near 1.1899-1.1905 with a tight stop loss near previous high trying to avoid the noise or the volatility during Election Results.
Good Luck Traders!!!!!!
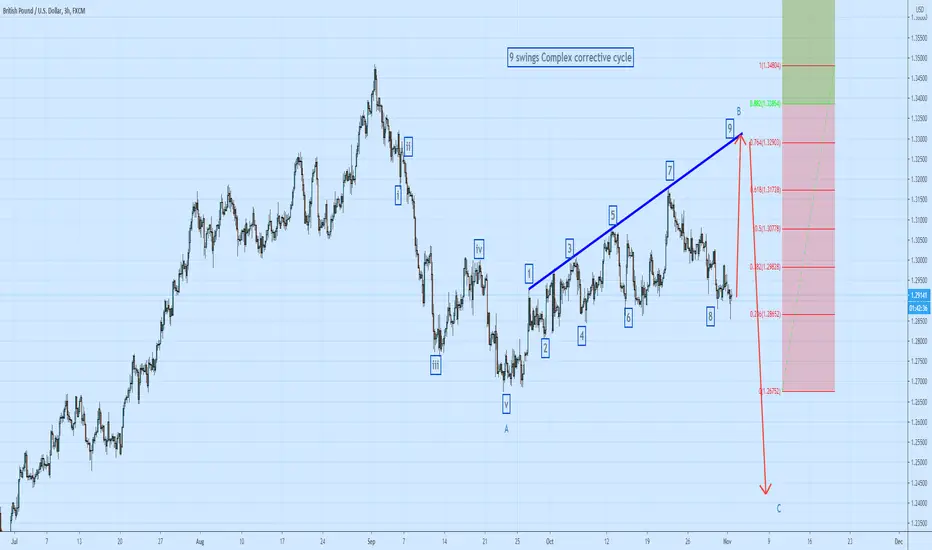
GBPUSD US ELECTIONS SELL LIMIT!!!!!!!!!the Pair traded in a range the last couple weeks, however the pattern shows that the upside momentum is still corrective for a
downtrend continuation. 7-9-11 swings are related to A,B,C corrective phases in Elliott Wave Theory.
tomorrow is the US ELECTIONS results so we will definitely expect high volatility trading, thats why i prefer to put pending orders ( sell limit ) orders near 1.3270 level
to short the pair and probably target 1.2390 the monthly engulfing pattern target.
Good luck
PULLBACK IN ORDER FOR BITCOIN?Sup cryptomaniacs
Bitcoin climbed beautiful as my last prediction, now what im seeing is abit of exhaustion with a pullback on the cards.
It had a very nice run, but the wings need to cool abit.
This just means more buying potential!
As always, keep the risk managed
Cheers :D


Gold | XAUUSD | Chart analysis for the coming days...WAITING FOR THE BREAK...
and
get into the big movements range,
Good luck everyone,

Silver gearing down for a rally towards $22 ?Analysis based on Price Action.
With Risk management You will never loss.
Thank You

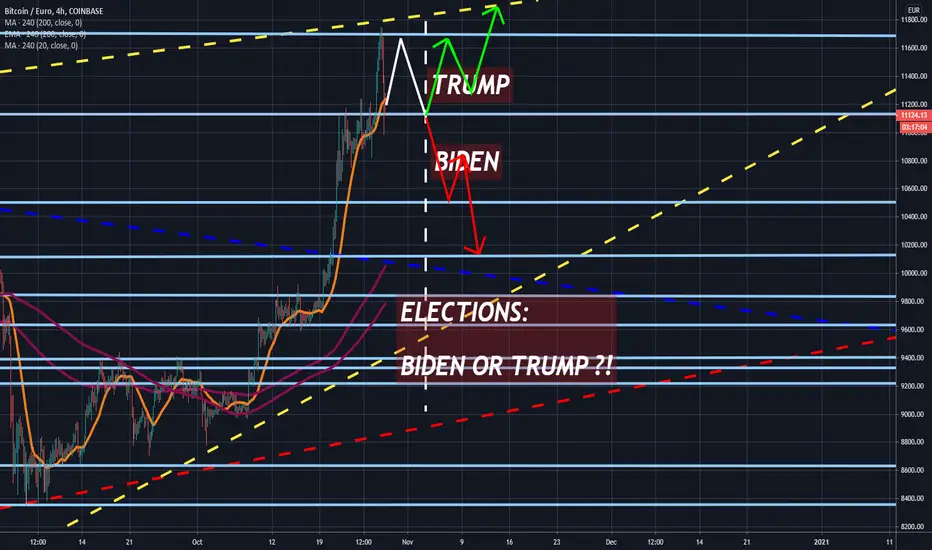
Biden and trump win scenario for bitcoinThis is my view on the bitcoin price for the medium to short term. COINBASE:BTCEUR
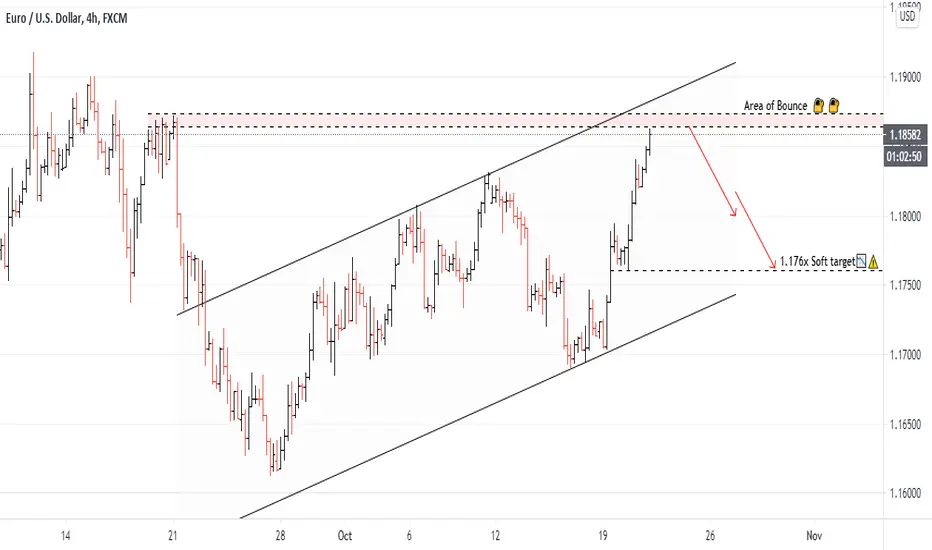
EURUSD Bullish Momentum Over !Trade Analysis Based on Fundamentals and Price Action.
With Risk Management You Will Never Loss.
Thank You.
Feel free to share Your View and Comments Below.
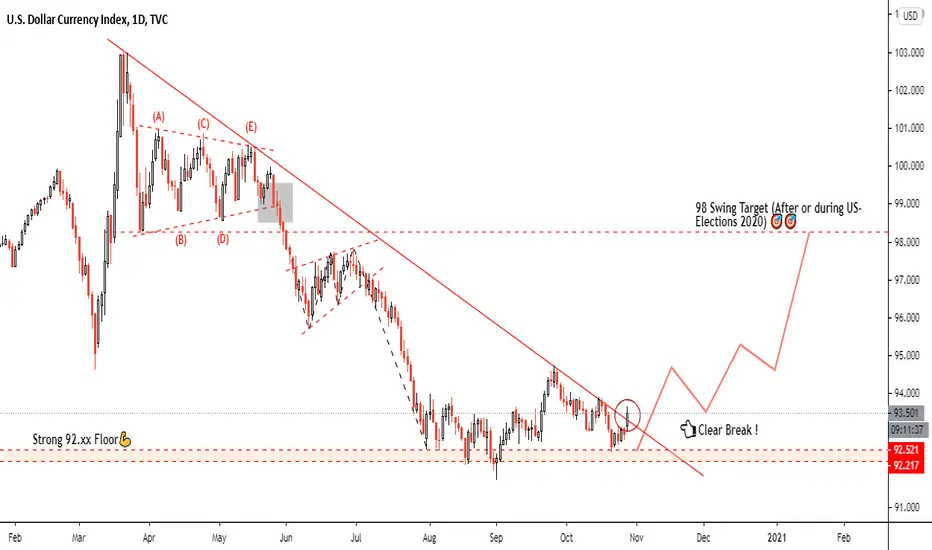
Ridethemacro | DXY Volatility into the elections 2020.Analysis Based on Fundamentals and Price Action.
With Risk management You Will Never loss.
Thank you.
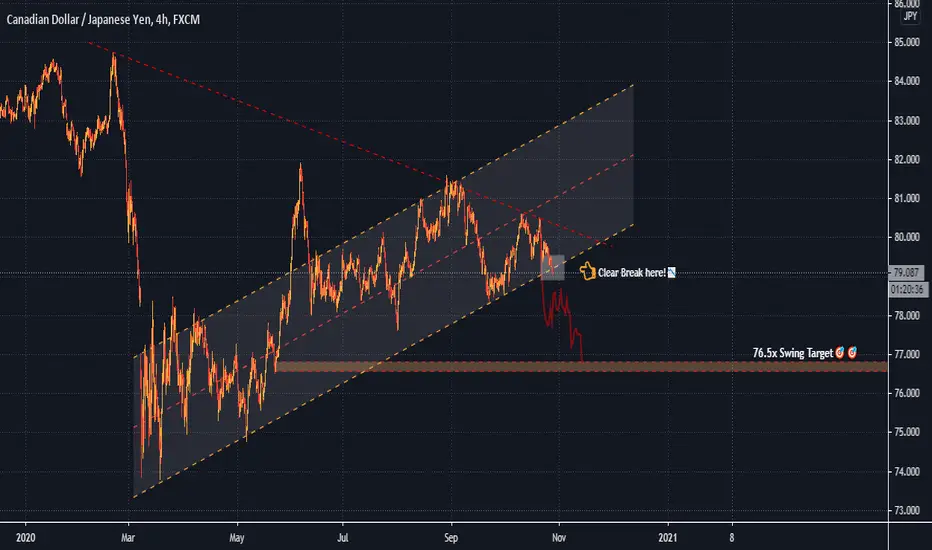
Ridethemacro | CAD/JPY Price Under Bears 🐻 Control !Analysis Based on price Action.
With Risk Management You Will Never loss.
thank you
GOLD UPDATE| TRADING PLAN
GOLD hasn't moved at all during the last trading days, as I suspect the market is waiting for the election results, which will be held in just a week.
Now, I am bearish on gold as it is within the downward channel, and broke out of the smaller upward channel.
So for those of you who want to be in gold, you might go short now, with the target of the green support level.
Yet, remember about the purple support.
Maybe it is safer to wait till the daily support breaks too.
But then the question of the sufficient risk reward would arise again.
All in all, I choose to be on the safe side and stay away from gold till I know the results of the election.
Thank you for watching, Like and Subscribe to never miss a new video.
