Bitcoin and U.S. elections. What does the past tell us?Undoubtedly the most important event of the upcoming week are the U.S. Presidential elections. We have seen in the past the high impact that the result has on the financial markets and Bitcoin is no exception, especially in late years where it is more correlated with the stock market than ever before.
So how did Bitcoin trade during the past two U.S. Presidential elections and what hint that gives us for the current one?
** 1D time-frame **
Looking at the three bottom charts, we have (from right to left) the price of BTC during the 2012, 2016 and 2020 (current) elections on the 1D time-frame. As you see on all three occasions the price is trading above the 1D MA200 (orange trend-line), which is a strong indicator of a bullish trend.
What is more interesting than that, is the fact that both on the day of the 2012 and 2016 elections, the price was +17% higher that the 1D MA200. Assuming the same pattern holds this time (2020) too, then Bitcoin should be around 12000 on the election day (November 03, 2020).
** 1W time-frame **
The upper chart is the price of BTC on the 1W time-frame. As you see it has been above the 1W MA50 (blue trend-line) on all three occasions, which indicates strong long-term bullish bias.
As on the 1D chart, what is even more interesting than this, is the fact that both in 2012 and 2016 the time from the day of the elections until the next Cycle Top, was roughly 400 days. Assuming the same pattern is followed, we could have a top in December 2022. Whether that's an interim top or a final Cycle Top, it is unknown but being a final top would go against Bitcoin's theory of lengthening cycles. But it is a good benchmark to follow for long-term investors seeking hints on when/ where to take profits.
Do you think a 12k price on the election day is a bottom? Feel free to share your work and let me know in the comments section!
Please like, subscribe and share your ideas and charts with the community!
--------------------------------------------------------------------------------------------------------
!! Donations via TradingView coins also help me a great deal at posting more free trading content and signals here !!
🎉 👍 Shout-out to TradingShot's 💰 top TradingView Coin donor 💰 this week ==> TradingView
--------------------------------------------------------------------------------------------------------
Elections

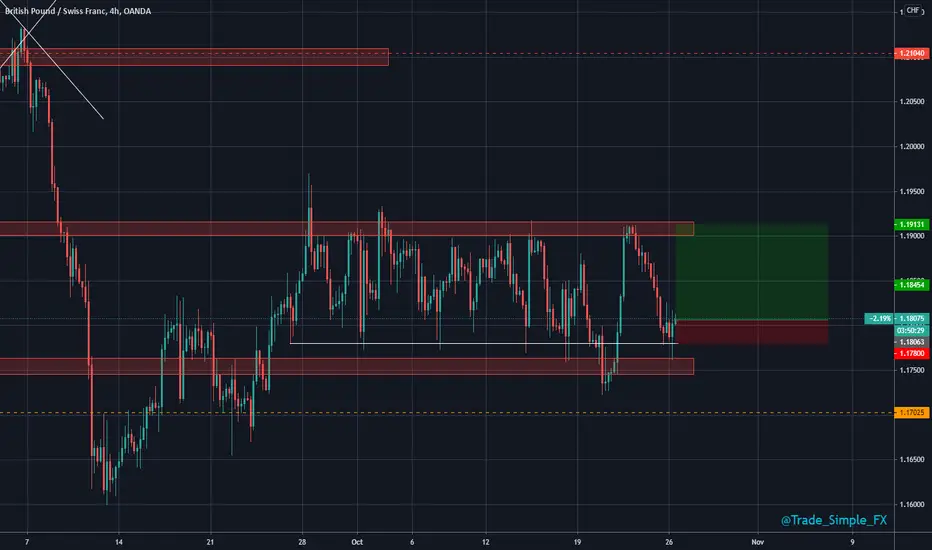
GBPCHF H4 - Long SetupGBPCHF H4 - Same reasoning for EG shorts, fundamentals spiking GBP and market volume comes into play and EUR/LON markets react to weekend headlines. Still best practice to let the dust settle after such an opening. Personally like to let London morning do it's thing before looking to scout any trades out around NA/LON overlap time.
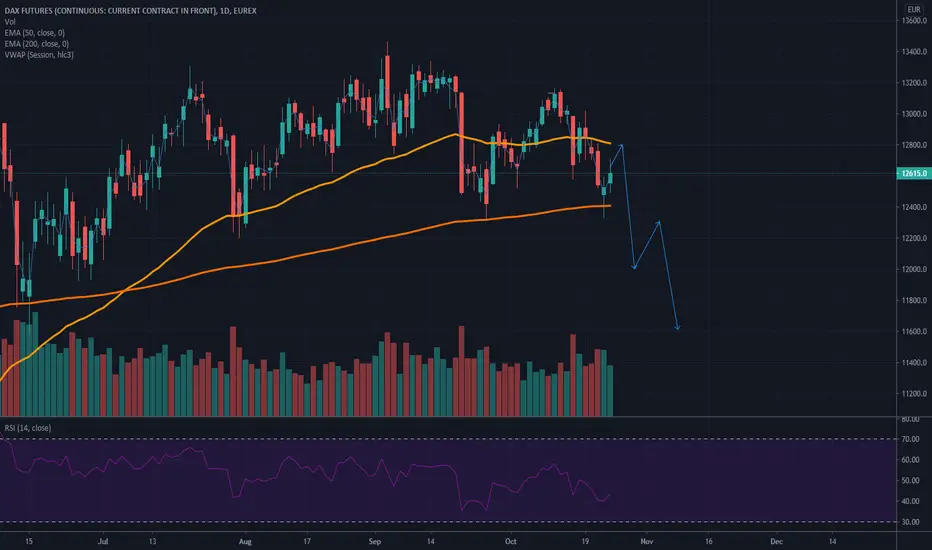
DAX correction coming soonGiven the rise of uncertainty in Europe and in the world(elections, rise of COVID cases and possible quarantine measures by European countries), we should see a DAX correction coming in the next few weeks.
Still, I believe that we will see a one last push to 12800 and maybe even 12935 at the start of the next week before we'll go down in the first few weeks of November.
The effects of a possible lockdown won't be as big as they were in March for the stock indexes, because nowadays, we know way more about the virus than back then, so that's why I'm going only for a 10% correction(11600 double bottom from June)
Good luck!
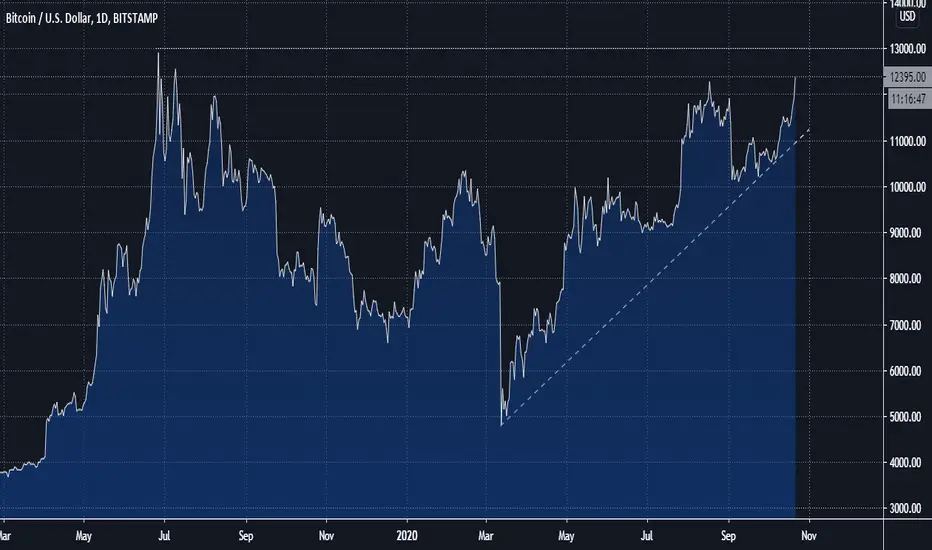
RidetheMacro| BTC/USD Towards 13K !Trade Projection based on Fundamentals and Price Action.
PayPal announced today that we could buy, sell and shop with BTC
With Risk Management you Will Never loss.
Thank you
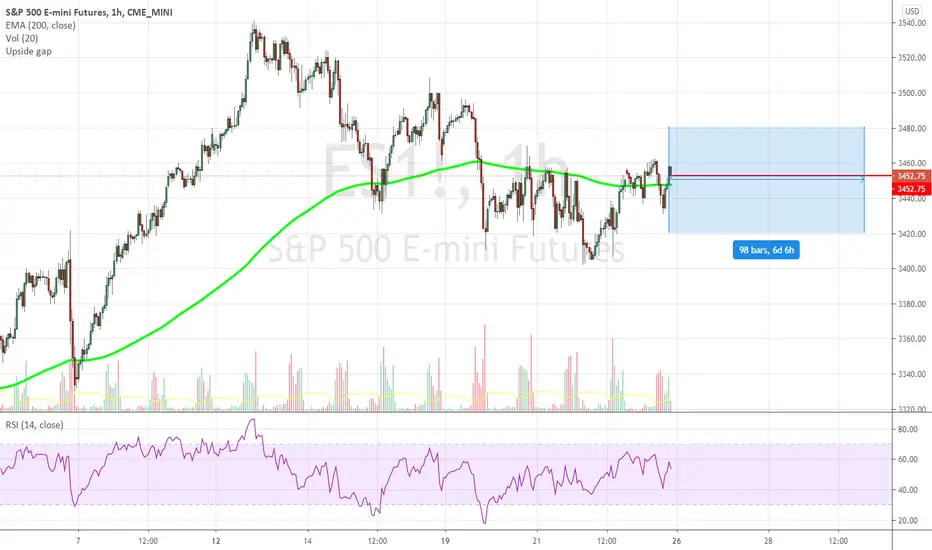
Weekly Review: Awaiting The Elections (Read for Fundamentals) Close to the elections (3rd November)
1. American Election - Tension
2. Stimulus Package – Only positive impact
3. GDPs – 3rd Quarter (slightly better than give some confidence)
4. 3rd Quarter Companies’ earnings – so far, they´ve been good (mostly in tech)
The logic thing would be for investors to keep taking profits ahead of elections and increased volatility.
- What I expect will be small lateral moves, more inclined downside if anything, best option is to wait on the sidelines to see what happens in the elections.
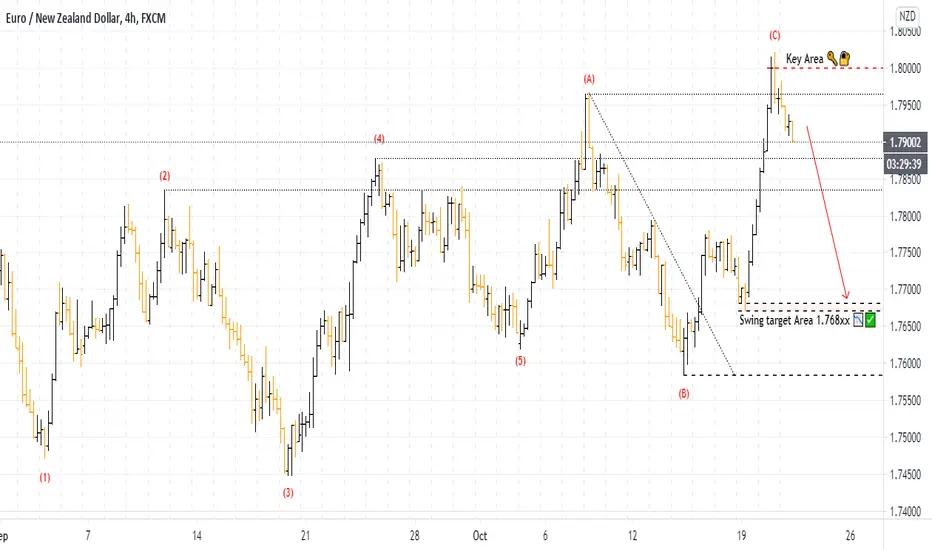
EURNZD Decline Could Continue!Trade Analysis Based on Fundamentals and Price Action
With Risk Management you Will Never Loss.
Thank you
SILVER IS ABOUT TO RALLY IN A HUGE WAY...AS 2020 CLOSES OUT, THERE ARE ABOUT 25% MORE U.S. DOLLARS IN CIRCULATION THAN AT THIS TIME LAST YEAR...
GOLD, SILVER AND CRYPTO SEEM TO BE THE BEST MOVES WHEN LOOKING AT THE TRADITIONAL MARKETS... LOTS OF VOLATILITY TO COME.
AS SILVER TRADES WITH IN THIS ASSESSING WEDGE, WE MUST KNOW THAT ASCENDING WEDGES HAVE A 66% CHANCE OF BREAKING LOWER... BUT, IF AND WHEN ASCENDING WEDGES BREAK HIGHER WE SEE PARABOLIC PRICE GROWTH.
ALWAYS PREPARE FOR ALL POSSIBLE SITUATIONS ..
🔸️Learn How to Trade and Invest Into Cryptocurrency🧠
🔸️Get Profitable Trading Set-Ups and Signals📈
🔸️Copy Our Diversified Long Term Portfolio📊
🔸️Engage With Our Skilled Community👥👥👥
Earn Up To $4293 in Crypto and Other Assets🤑
🥂Link in Bio

NCL Industries (Long Term Strategy)Hi Everyone,
I have come across this nice parabolic Curve Step formation in NCL Industries Limited, this is the most highly prized and sought after pattern. This kind of patterns give quick rewards.
As per the Chart, it has formed the first 2 bases in the Parabolic curve. Usually Parabolic curves will form 4 bases and we sell on the 4th base.
Base 1 formed from - 56 - 77
Base 2 formed from - 77 - 110
Base 3 to be formed from - 110 - 148
Base 4 is the sell point - so we need to keep a sell target of about 148-150
Technical set up looking good along with nice accumulation in the OBV. We are going long on this share with a target of 145-150 in the long term.
Investor Strategy:
Buy the dip with NCL industries with a long term target of 148-150 in three to six months
Disclaimer: This is an education view not for financial advice, if you are enjoying my analysis please follow me for more update and please like and comment :)
Thanks !

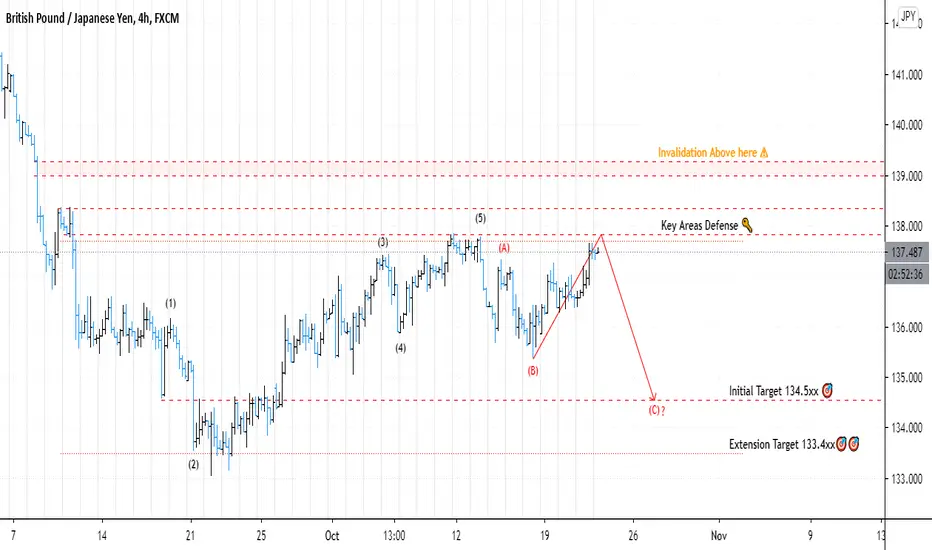
GBPJPY Price Still under Bears Control !Trade Analysis BASED on Fundamentals and Price Action.
With Risk management You Will Never Loss.
Thank You
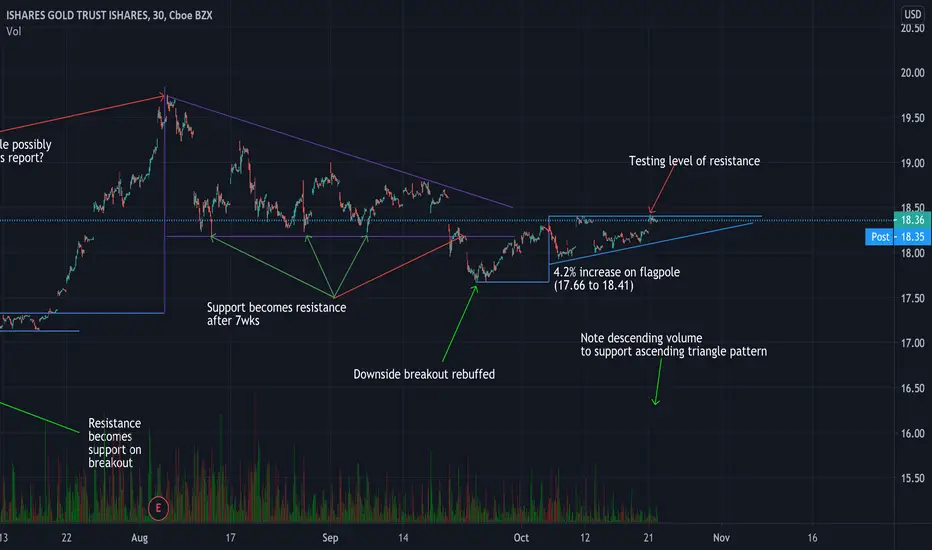
Anticipating a breakout to the upside in gold via IAUiShares Gold Trust (IAU) is a passively managed ETF that seeks to match the movement of the price of gold. It provides an investment vehicle for gold by backing shares in the ETF with gold bars held in trust.
After a steady recovery from the trough of March 20th, a trend reversal starting on Aug 5th manifested as a descending triangle (or perhaps a large pennant) that broke out to the downside after 7 weeks.
However, this downside breakout was rebuffed by buyers, perhaps due to the economic and political uncertainty surrounding the pandemic as well as the US presidential election, which at the time of the turn around was 40 days away.
The ETF saw a 4% increase in value over two weeks and has settled into an ascending pennant where resistance is being tested and the lows are higher.
I anticipate a breakout to the upside if the bottom ascending line holds, especially as we near the US presidential election (Nov 3rd). This breakout may occur in the days leading up to the election, or perhaps right afterwards.
Let me know what you think in the comments!
******
These ideas are presented as a topic for discussion and do not represent a recommendation to trade a security.
******
WTI (US-OIL) Ready to Open doors for Bulls !Trade Analysis Based on Fundamentals and Price Action.
With Risk Management You Will Never Loss.
Thank You.
Feel free to share Your View and Comments Below.

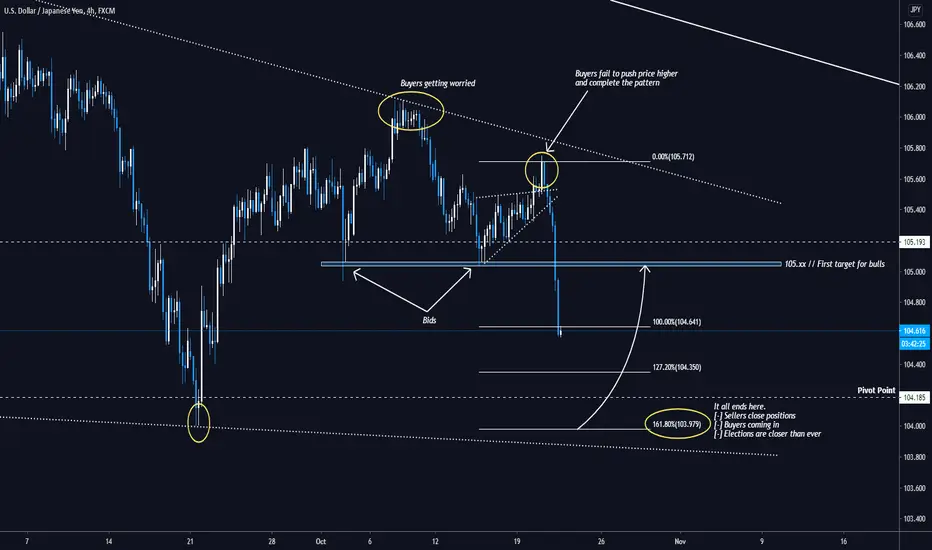
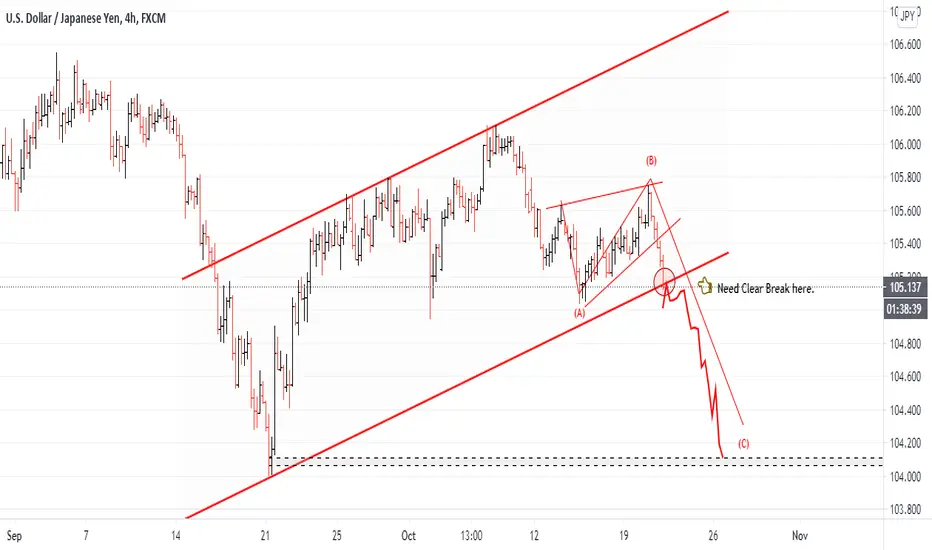
USDJPY Market Commentary - 21 Oct. 2020A lot of things going on right now. Buyers and sellers more stressed than ever. Bullish Dollar or Bearish Dollar? Stimulus or not? To be or not to be is the next question.
USDJPY a clear path though. JPY seems to win the fight between the safe-havens as it usually does in volatile times. Buyers seemed to have faith in a bullish Dollar and this was apparent till 20 Oct. after they got crushed by bears on a triangle breakout.
105.xx got dominated afterwards. A retest would be a stupid move by buyers at this point because it's way too obvious that JPY bulls are serious. (see EURJPY)
Most election speculations appear to be bullish for the Dollar, This belief is backed by factors like what policy the each of the election rivals is to apply or how investors feel safer by holding USD.
On the technical side, price is performing an 1-2-3 bearish impulse move. The final target for bears appear to be the 104.00 big figure that lines up with the 161.8% extension of Wave 1 which was followed by Wave 2 that saw an end after the fakeout.
For the time being, bears have the control of the price. Bulls are hidden in the bushes of 104.00 and are refilling their guns to snipe back to 105.00
After that, elections result will determine the next move...
RidetheMacro|USDJPY Yen’s slow grind stronger is set to continueTrade Analysis Based on Fundamentals and Price Action.
With Risk Management you Will Never loss.
All Comments and Ideas will Appreciated.
Thank You
XAU/USD Big Move Before or after Elections !Trade Analysis Based on Fundamentals and Price Action.
With Risk Management You Will Never Loss.
Thank You.
Feel free to share Your View and Comments Below.
Checkout XAU|USD Previous Analysis Below.

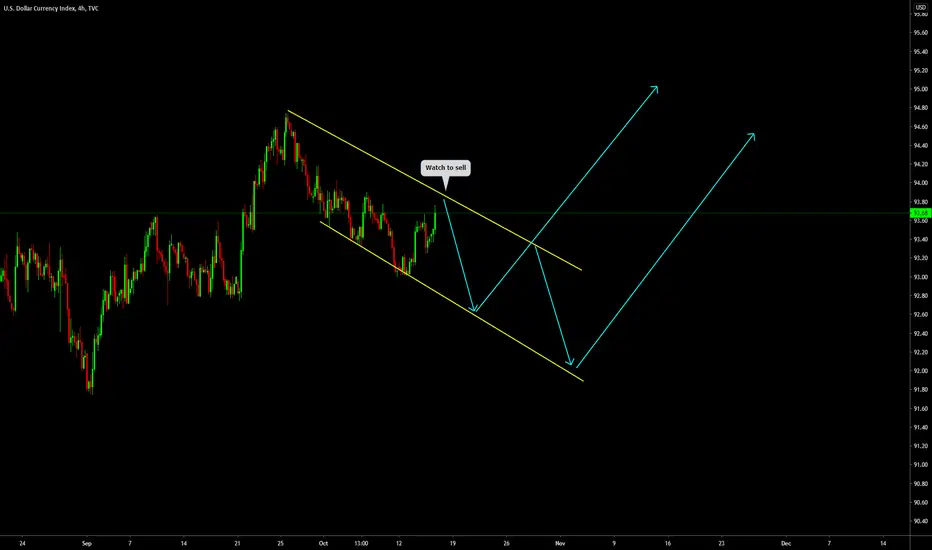
DXY - Dollar SellHi trades,
Watch your lower time frame for your sell setups. If the price will aggressively break to the upside this setup will become invalidated. So keep an eye on your lower time frame for sell setups. I do anticipate that the price will be keep falling until the 3rd of November - USA ELECTION. After the election we can anticipate a DXY Dollar index to rise.
RidetheMacro| DOW Jones What's Next?Trade based on Fundamentals and Price action Only.
With RISK MANAGEMENT YOU WILL NEVER LOSS.

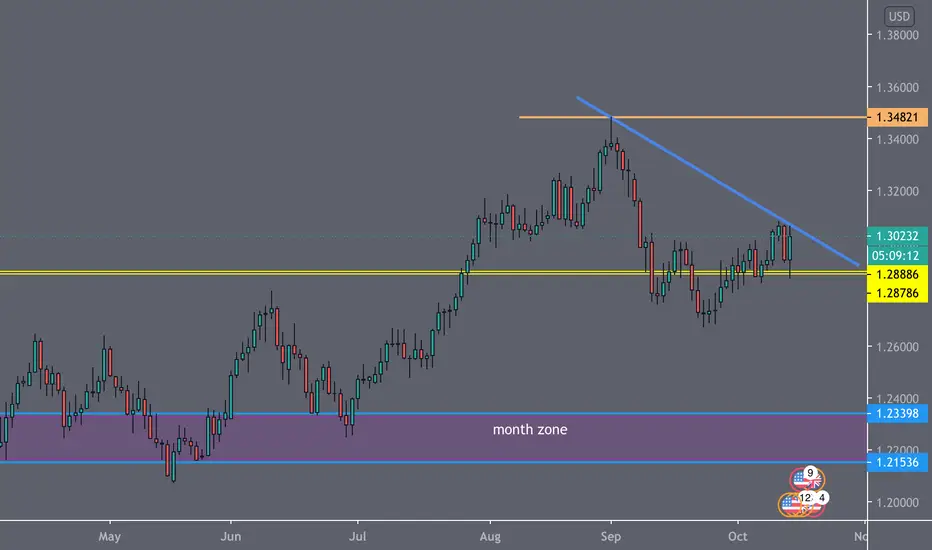
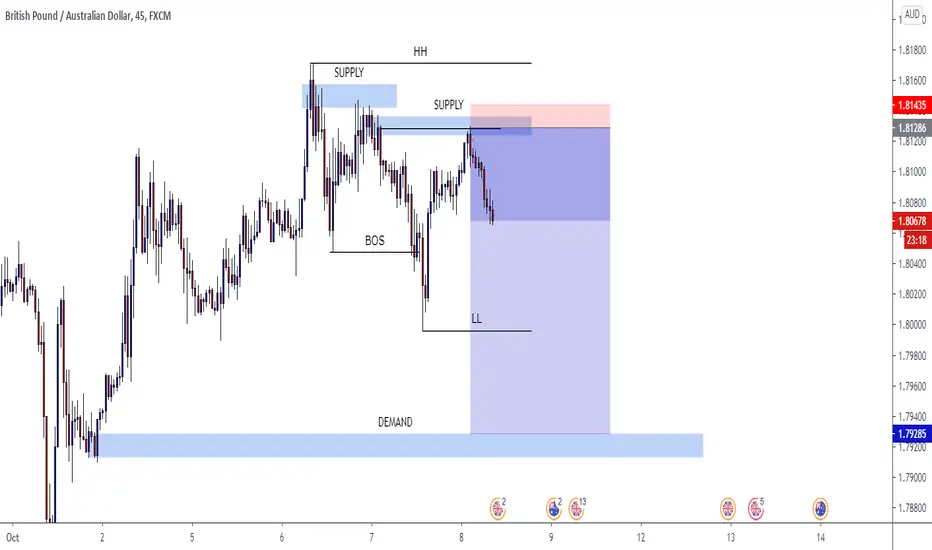
GBPUSD vs. TRENDLINEThe price will fall from the rejection on the trendline.
GO SHORT. The possibility of price dropping into month zone are very high.
Price already going down on lower timeframes as confirmation of rejection of trendline
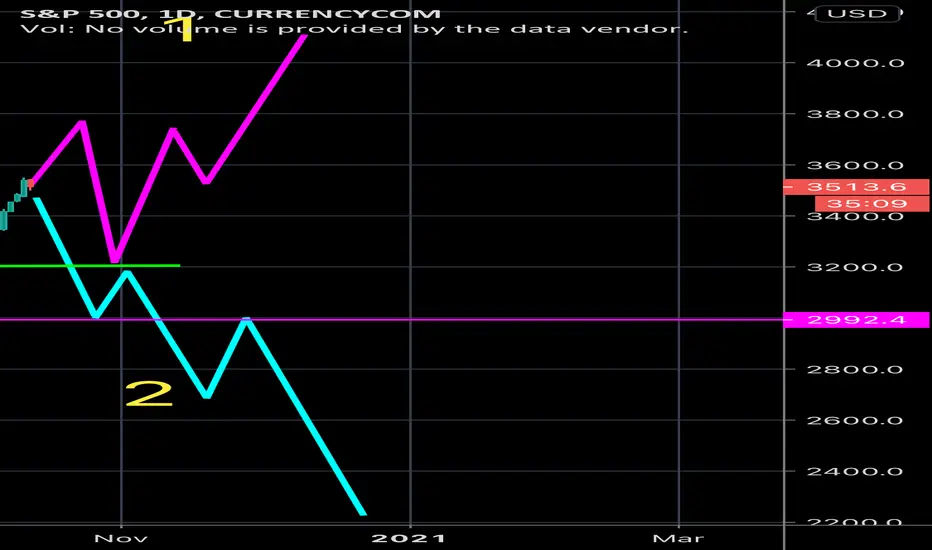
S&P 500 EEUU 500Hello good morning I hope you’re right.
A few days ago I published this idea to you, to this day it is the same I have only modified trend and lines by market movement. In the comments, in the 2 comments that our brokers commented that it would follow the second trend, The fall BEARISH .
We believe that in the short term you will see high volatility whit corrections... but in the middle term we’re BULLISH and in the long run we’ lo see. LEAVE YOUR OPINION In the comments 1 or 2, and how they are positioned in short, medium up to elections, and long.
Sincerely L.E.D
In Spain at 13/10/2020
RidetheMacro| DXY Dollar Index Time to get some strength !Trade Analysis based on Fundamentals and on Price Action;
With Risk Management You will Never Loss.
Best reagrds;
Ridethemacro

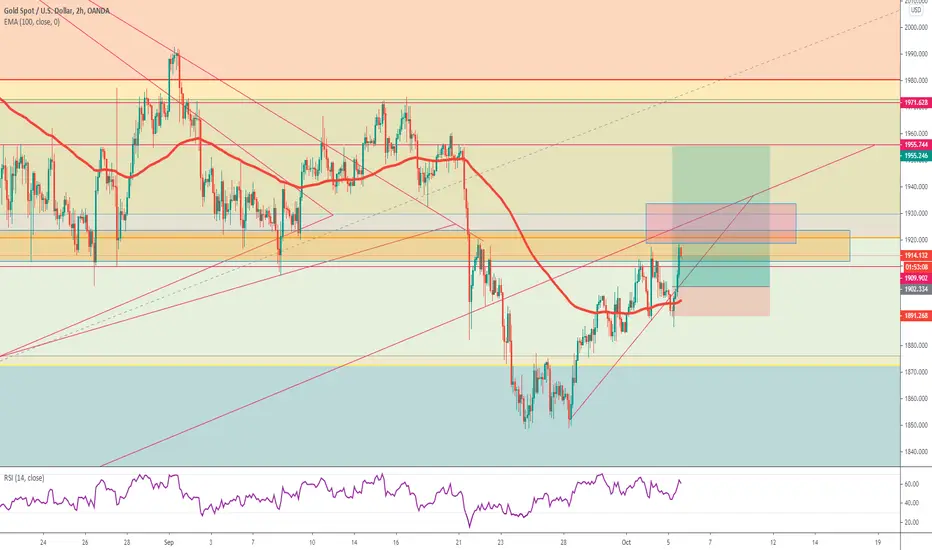
Rising Wedge Gold XAUUSDGold is currently re-testing previous support as resistance in a rising wedge fashion.
We shall see if Gold can break above the wedge.
If it does we are long on Gold til $1955!
Catalysts:
Trump & Covid
Presidential Debates & Elections
Fiscal Stimulus for the U.S
Upcoming Economic Data
Stock Market Performance Under different presidents 📊Stock Market Performance Under different presidents Surprised Results.
Until the Next Time.
RidetheMacro.

Trump vs Covid19 vs ElectionsTrump covid case was what triggered the short term downturn.
The day Trump exits quarantine we also have futures expiration...
The markets till then can correct to that point and also test SMA200 in the excuse of trump health uncertainty. At the same time all retail robinhooders will be terrified since most of them hold long positions forcing them to go vote for Trump!!!
Trump winning covid 3 weeks before elections will give him tremendous boost and momentum towards elections.
