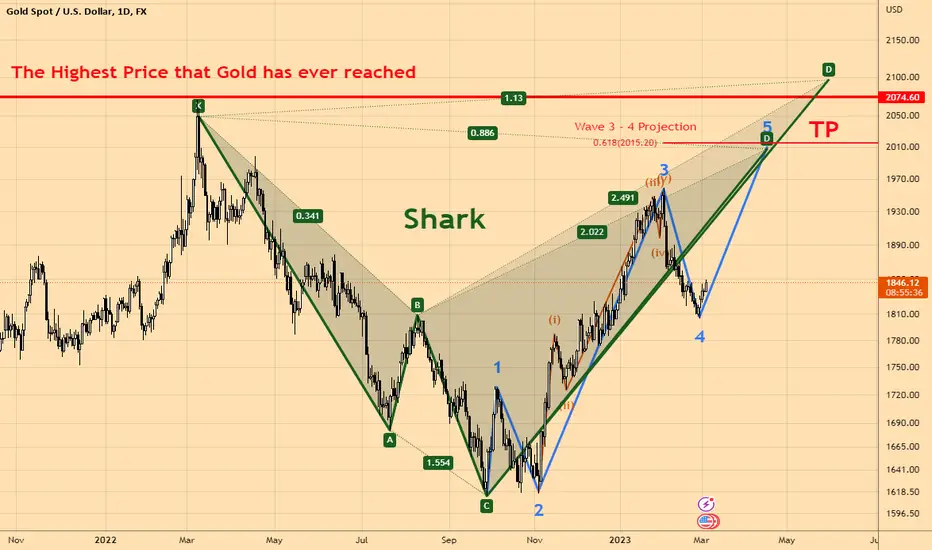
XAUUSD FORECASTThere's still a chance Gold forming Flat Correction (Wave 4), expect retracement at 88.6 level to go Short.
Disclaimer ON.
Elliottwaveideas

[NDX/ US100/ NAS100] NASDAQ LOOKING FOR 13500Here's an update for Nasdaq Composite Index, got 2 alternative move, how about you guys? Let me know in the comment section, Thanks.
Trade safe, everyone!

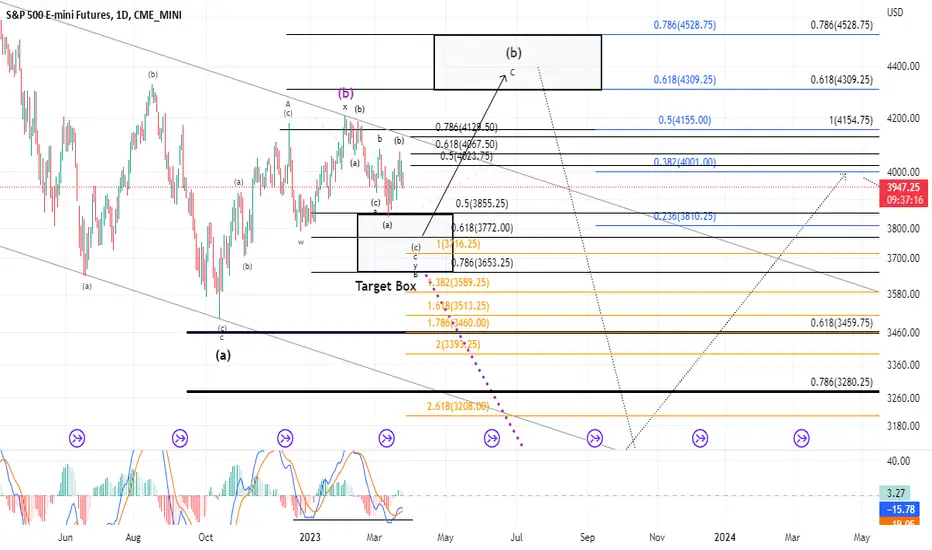
Weekly Update: Are we headed towards my Target Box Today?Today's price action will be crucial as to whether or not we head directly into my target box. My past posts have provided enough context. The sweet spot to target is 3772.
Nesting... 3 of a 3 of a 3 in progress...It seems like the cardano building up a massive price basis on lower timeframes.


NASDAQ SHORT AND LONG PROJECTIONAt Daily Timeframe, Nasdaq is forming Bullish Flag, means: in the short term, selling opportunity.
I prefer Alternative Expanded for reversal point.

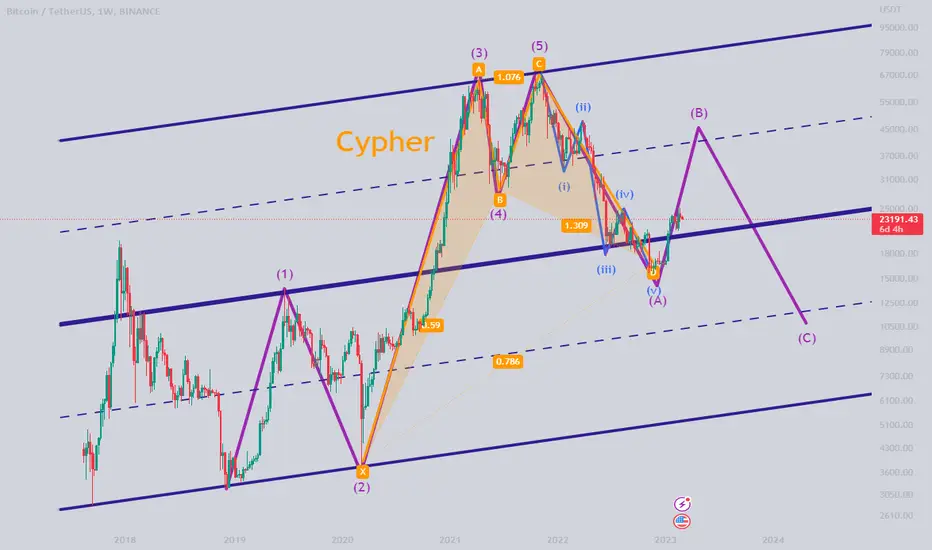
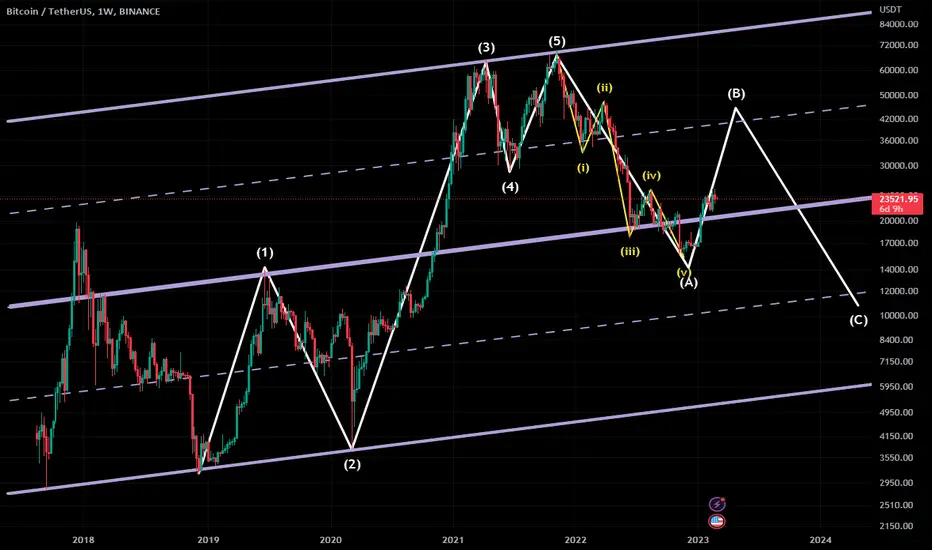
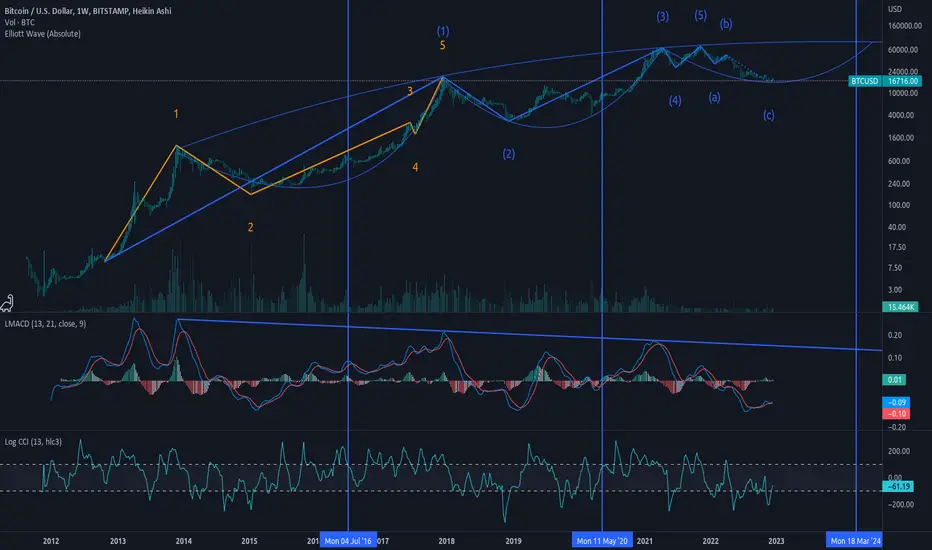
BTC / USDT - WeeklyParallel Channels, Elliott Wave Count & Cypher Harmonic Pattern in BTC/USDT Weekly Chart.

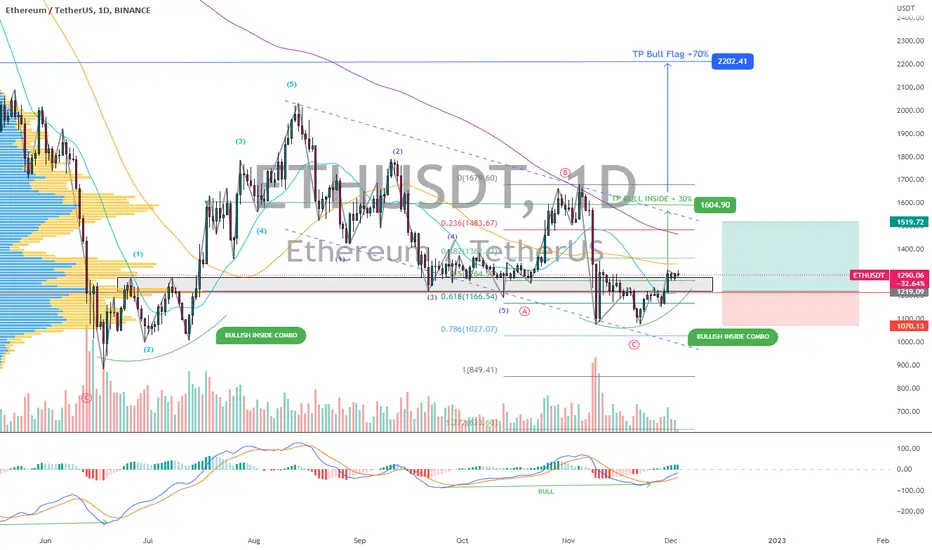
ETHUSDT | Wave Analysis | Massive Bull Flag +70%Price action and chart pattern trading setup:
> A potential ABC correction reversal pattern with MACD bullish divergence below baseline
> The price is currently trading between SMA20D vs SMA50D
> The current C wave position retraced 0.786 of A wave with a bullish inside combo pattern
> Entry @ pullback SMA20 zone
> TP1 @ bullish inside price action combo +25-30% near upper bull flag resistance and slightly above SMA200D
> Stop @ C wave position -10-12% downside
> Risk reward ratio: 2:1
If the price breakout this massive bull flag - this will confirm the new uptrend 1-2 pattern and the flag resistance will become the support with an estimated +70% upside from the current trading price.
Always trade with affordable risk and respect your stoploss
A test drive to mix smc and elliottUnlike ICT im into elliott and i have seen that any method to market can work. You just have to learn and study the whatever the approach very well.
Any method will have good and bad sides you just gotta know them well.
SMC is A way not THE way. Algorithms or robots or AIs or liquidity or stop hunt are just different names for the same market moves.
There are many ways to beat the market. SMC and Elliott are just two of them.
ICT'nin aksine Elliott Dalga Teorisini kullanmaktayım ve gördüm ki piyasada herhangi bir metod çalışabilir. Sadece kullandığınız metod ne ise, o metodu, o yöntemi çok iyi çalışıp öğrenmelisiniz.
Hangi metod olursa olsun, iyi ve kötü tarafları olacaktır, yapmanız gereken sadece bu yönleri ile metodunuzun zayıf ve güçlü taraflarını bilmeniz gerekecektir.
SMC sadece yollardan birisidir, tek gerçek yol değildir. Algoritmalar, robotlar, yapay zekalar, likidite ya da stop avları sadece aynı piyasa hareketleri için farklı isimlerdir.
Piyasadan kazanmak için birçok yol vardır. SMC ve Elliott bunlardan sadece ikisidir.
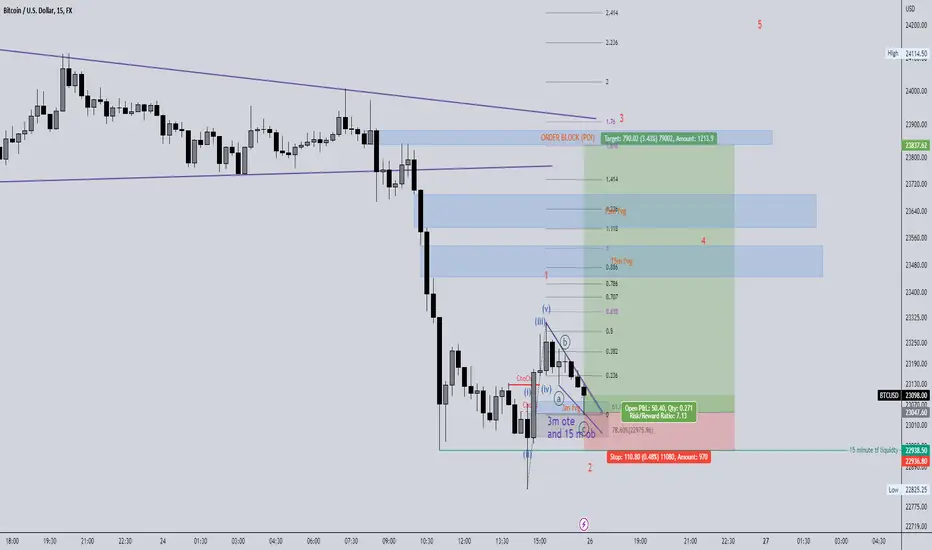
2nd test drive for a mix of smc and elliott for bearish scenarioIn previous post we mentioned the buy side opportunity and it was a model without the taking considiration of htf bias. Bias is bearish and even though it is from a chart which was a false one. it gave the idea that htf bias is soo important. As smc mentions it a lot. that is a great example if you dont take it into considiration. Even though the strategy is right you might end up having a losing trade. Market structure shift and reversals are different matter ofc.
Now this chart is from Binance and you can see how it is affective to have a bias from htf. so this is a bearish scenario. There is a 1h fvg and it might be a magnet for the price to go down. Again it will be shown in elliott waves.

[SPECULATIVE] XAUUSD SHORTS PLANHonestly, i should wait for more confirmation, let the wave or pattern formed, but, here's a speculative plan on XAUUSD. Trade safe, Guys!
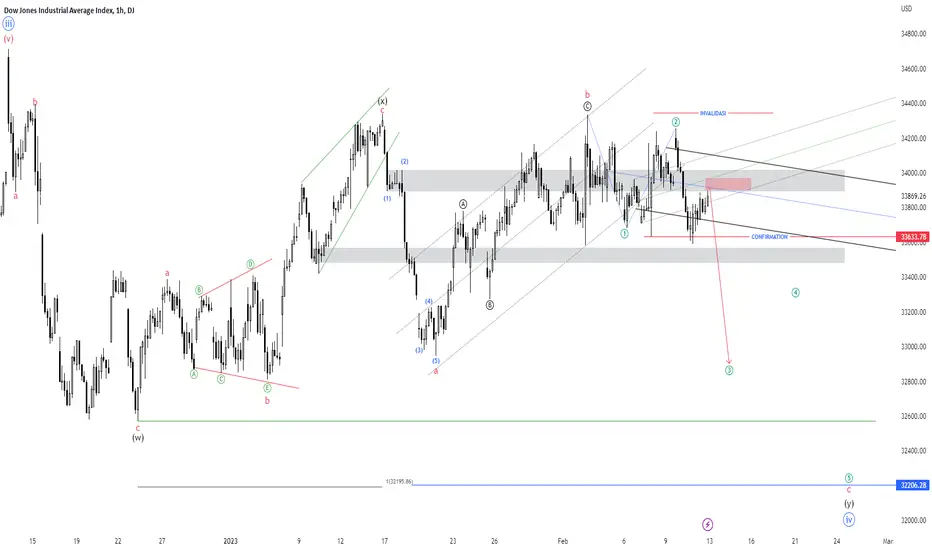
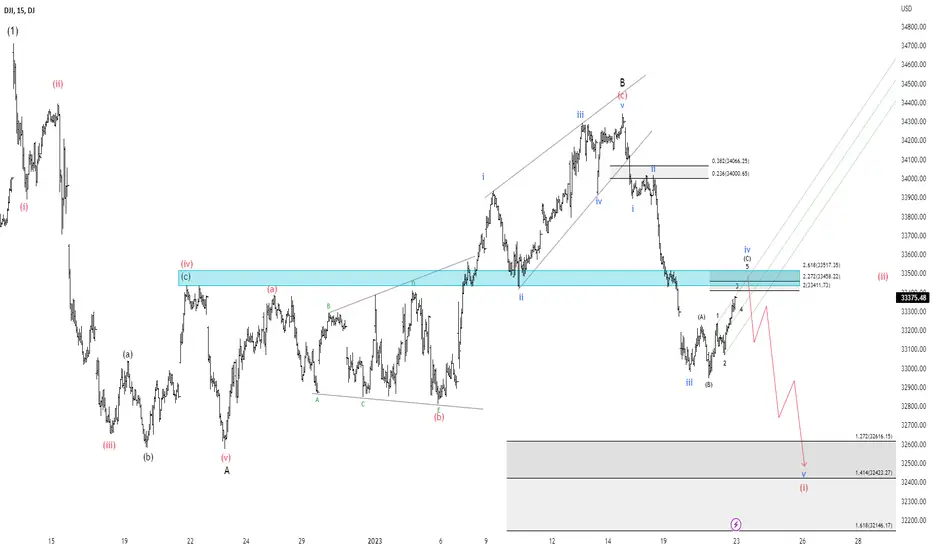
DOW JONES 11 FEBRUARY 2023I use DJI version because there's so many peak and trough (High and Low) that break, comparing to other versions.
BTC Macro Elliot WaveBitcoin appears to be in its last corrective phase in a macro elliot wave pattern. Credit to LevRidge's Idea tradingview.sweetlogin.com and the Elliot Wave Indicator by Absolute. Which in turn bitcoin is at or about the zero point and ready to start the next bull run and new wave.
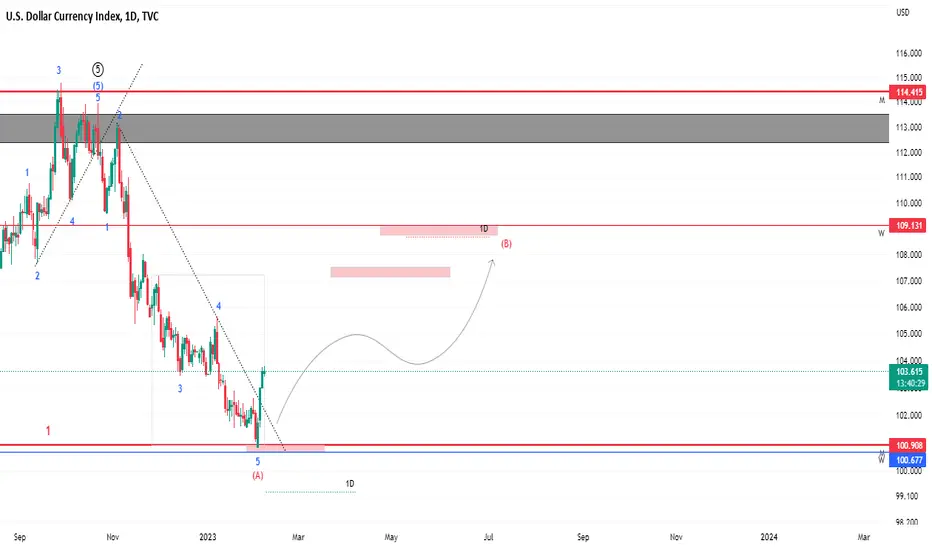
DXYIt seems that wave 5 is over, which can be a part of wave A or 1 of the corrective phase.
The index has reacted well to the areas determined for the completion of wave A and until the bottom of the hypothetical wave 5 has not been broken, this analysis is valid.
The red boxes are the ideal areas for the end of the hypothetical wave B.
Happy dollar days are coming..
FCPO continuing it's bullish momentum?In the short term, FCPO will very likely retest its trendline around 3930++ and hence completing its 3 waves structure in the B. A break below 3815 would invalidate this assumption and suggest that b is just starting.
Disclaimer
This is NOT buy/sell call but for learning purposes.

DOW JONES FORECAST FOR END OF JANUARY 2023My previous idea on Dow Jones Industrial Average Index was Bearish Continuation (Looking for new low).
Here's an alternative for bull run.
DOW JONES CONTINUES BEARExpanding Diagonal of Wave A, minor uptrend since September 2021, in my perspective was Wave B.

NASDAQ FORMING ENDING DIAGONALNasdaq is forming Ending Diagonal (3-3-3-3-3). Invalidation level is at Wave 4's Terminal. It's possible wave 5 will overthrow. Trade safe, Guys.
This is just my perspective, if there any principle that have been broken on my idea, im open for criticism.

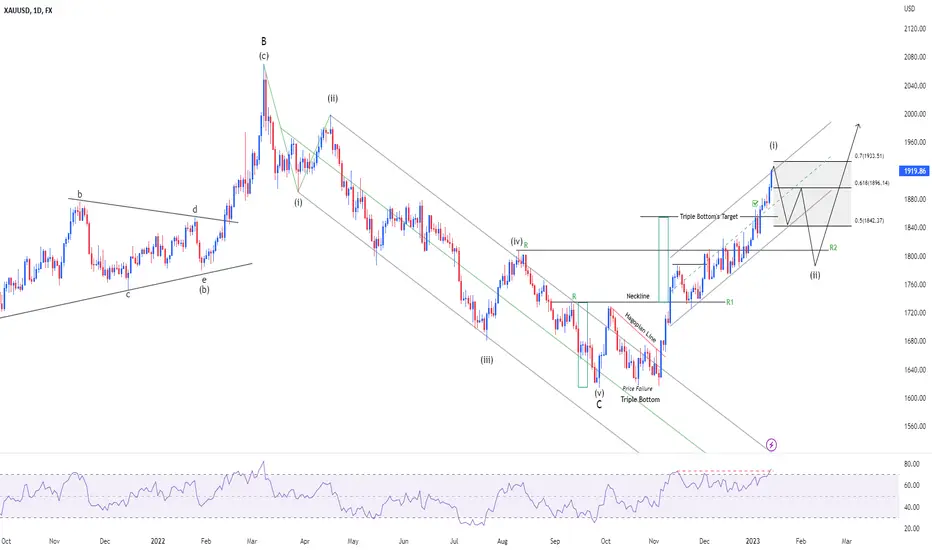
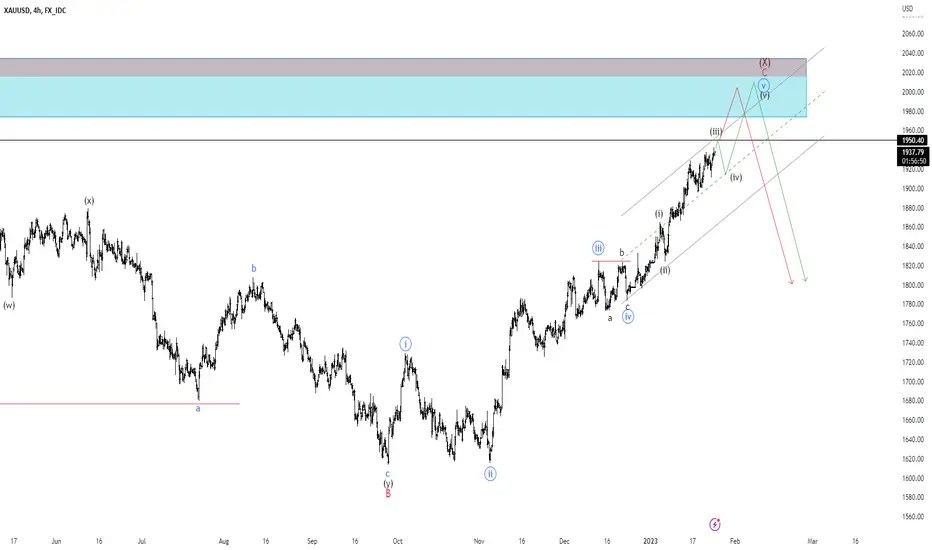
XAUUSD FORECASTMy previous forecast on XAUUSD was bearish continuation and looking for Lower Low, this is an alternative for Bull Run, key level on lower timeframe by using Andrew's Pitchfork was 1914 then 1860.
Trade safe, Everyone!