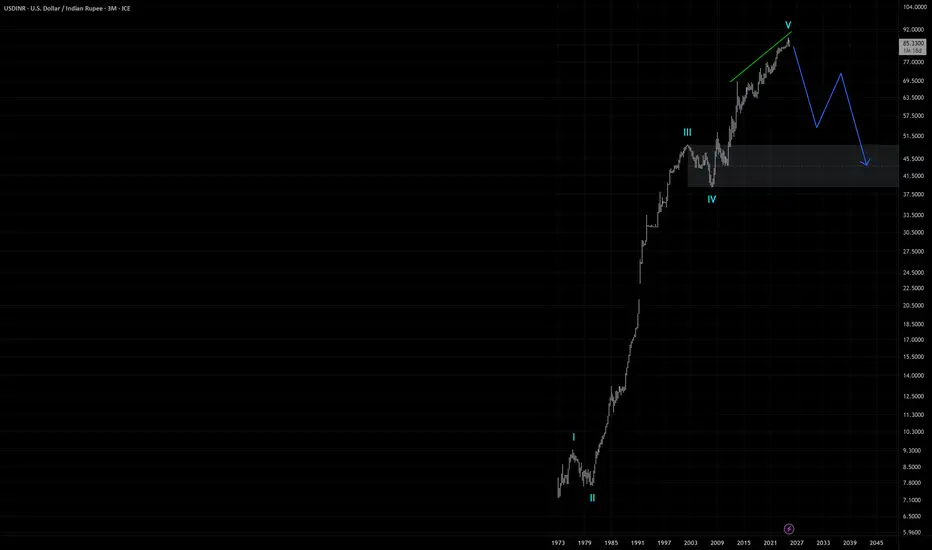
INR has made a major top against USDFall of INR against the USD began in early 1970s, or perhaps late 1960s--we don't know for sure for lack of trading data. Since then, it has depreciated against the USD in crystal-clear 5 legs, or waves according to Elliott Wave Theory (EWT). To validate EWT, there occurred a gigantic gap of 9.23% in July 1991 where third wave is supposed to be--a hallmark of third waves. Furthermore, there's even a divergence between Price and Elliott Wave Oscillator (5/35 MACD) on the Monthly chart--typical of fifth waves.
So, what's next then? Considering the time frame of the entire price move till date, I would say that a bear wave of Supercycle degree has just ended and we are looking at a 10-15 year advance in Indian Rupee against the US Dollar . In support of my forecast, INR has just posted a beautiful, unambiguous 5-wave advance in the shape of an expanding diagonal--hallmark of first waves--from 87.972 to 83.7625.
If I'm right, price should retreat a bit toward the classic 61.8% level at 86.3396, and then fall hard--and I mean very hard, with a gap--toward the levels below 80, followed by another pause and a small retreat, and another fall, thereby completing a set of 5 distinct waves . Should price follow the path of my forecast to that point, we would have a definite confirmation on hand that a Supercycle bear wave has indeed ended.
The final target of this Supercycle bull wave of INR vs. USD? It's too early and too far ahead to hazard a guess, but as per EWT principles, it should be somewhere close to 44. Yes. 1$ = ₹44. I hope I live to see that day. It's going to take a while, till 2040 perhaps, but we'll get there alright.
Elliottwaveoscillator
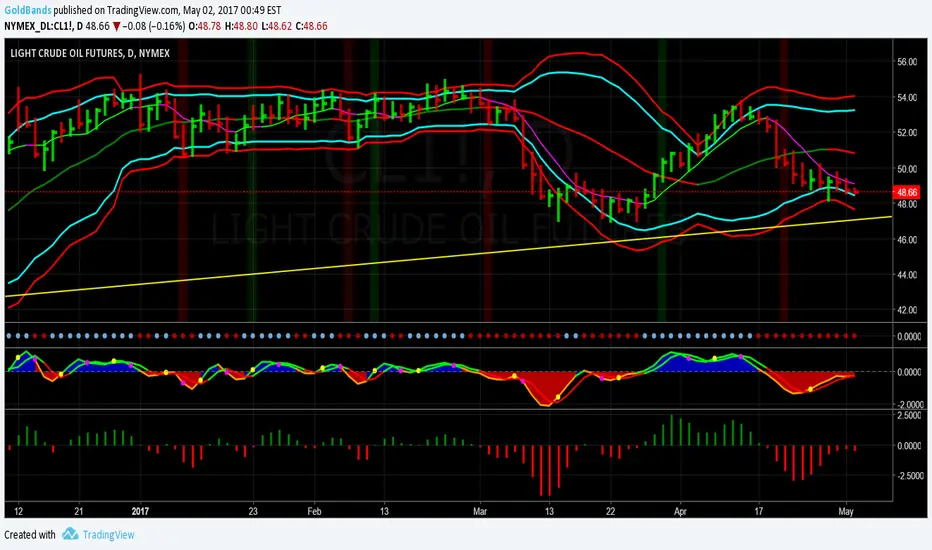
Crude Remains Under Downward PressureCrude Oil sold off today, falling .43 points and continuing to stay well under the 7 day moving average. And while the haDelta indicator last Tuesday gave a potential reversal signal (see the yellow circle?), there is no indication that the downward wave is finished.
The bottom indicator is the Elliot Wave Oscillator. It, too, is showing strong downward movement. I am expecting price to keep moving lower towards the 47.70 - 47.15 range. The first is the lower Bollinger Band and the second is the yellow trend line.
Zoomed out chart to show the entire trend line.
The Heikin-Ashi chart shows that Monday's Heikin-Ashi candle was a decent recovery after last Firday's doji. While it wasn't the strongest of candles and is still inside of last Thursday's candle, it is still red and confirms the downward trend.
If you like this post, please click the Lick button, tell your friends, and re-Tweet!
Disclaimer: This post is for educational purposes only. Trading is at your own risk.