Crude Oil Is Nearing Temporary SupportWe see a drop on crude oil from 130 area as a five-wave impulse into wave A that can be coming to an end around 62 - 57 temporary support area. Current strong drop in the 4-hour chart which can be also considered as a spike into new lows, we see as a final wave (5) of A, so be aware of a corrective recovery into a higher degree wave B soon.
Elliottwaveprojection

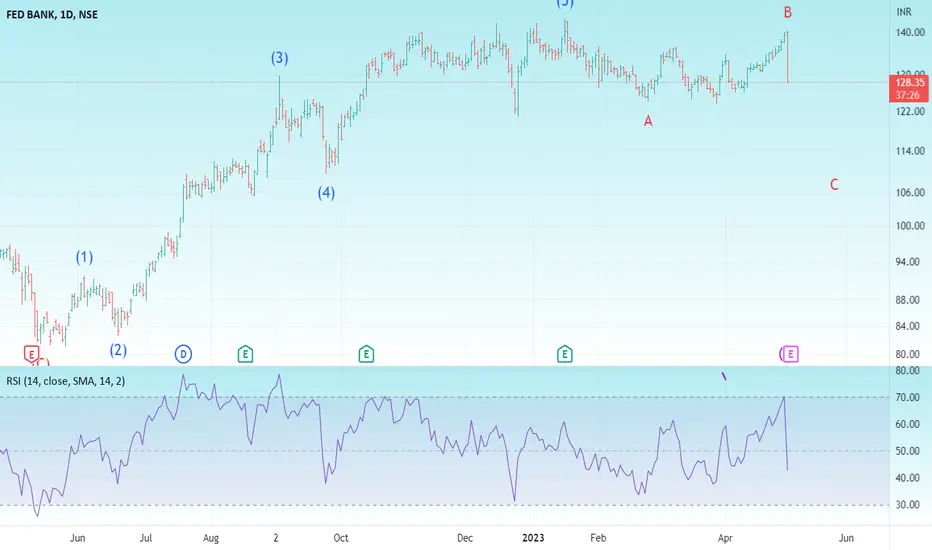
Federal BankHello & Welcome to this analysis
It completed an Elliott 5 waves from May 2022 lows to Jan 2023 high.
Post that Wave A till Feb 2023 lows followed by a Wave B till this week's high.
Today's reversal appears to be Wave C down that could probably take it to 115-110 where it appears to have a support based on the consolidation it has had in that area in the past.
Immediate support now at 124 while immediate resistance at 134.
American Express ($APX): Elliott Waves Analysis and Sell SetupThe American Express ($AXP) Main Trend is absolutely bullish, therefore we currently consider all descents as simple corrective structures of the trend in play. But why am I saying that? Because when you decide to take a position not following the trend, the risk is high, so logic tells us to use a smaller size, at least initially (...there's always time to increase it!). Having said that, the strategy I want to share with you is very simple: "Try to take a short position on breakout" , with stop loss above the previous swing (don't look at the levels on the chart, they are only indicative at the moment). Of course, a second option (yellow arrow) is also possible, but to do this you would need to be a little more expert. The potential target areas are the first around 119.50 and the second around 106.50 (my favorite).
Looking at the chart above (daily time frame) we can see how the potential short trade also has a good Risk/Reward ratio, and this makes this trade interesting.
I also take the opportunity to thank every Trader who supported me in the last setups on Stocks Market:
$AMAZON BULLISH SETUP
(Click and Play on Chart below)
$TESLA BEARISH SETUP
(Click and Play on Chart below)
Trade with care! 👍 ...and if you think that my analysis is useful, please..."Like, Share and Comment" ...thank you! 💖
Cheers!
N.B.: Support my idea for next updates below 🚀

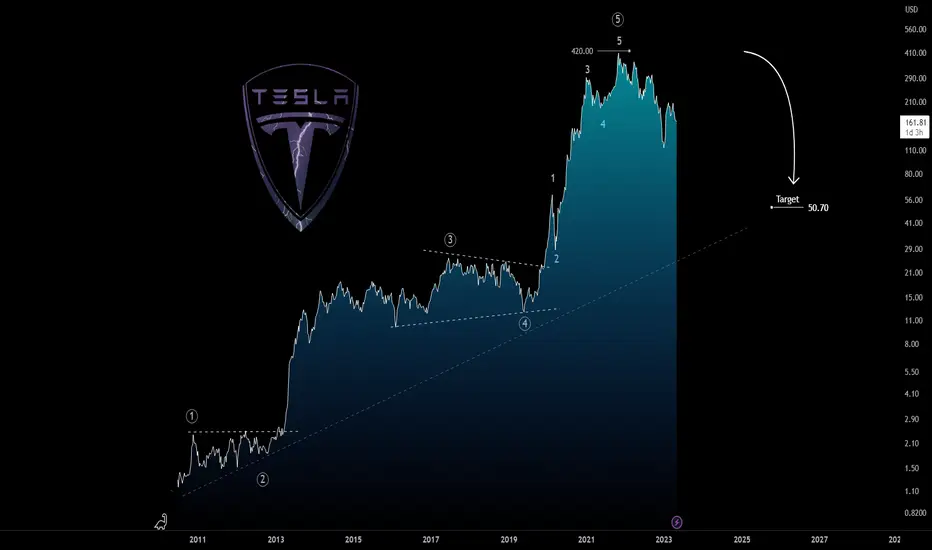
TESLA : My view is bearish!Tesla, Inc engages in the design, development, manufacture, and sale of fully electric vehicles, energy generation and storage systems. It also provides vehicle service centers, supercharger station, and self-driving capability. The company operates through the following segments: Automotive and Energy Generation and Storage. The Automotive segment includes the design, development, manufacture and sale of electric vehicles. The Energy Generation and Storage segment includes the design, manufacture, installation, sale, and lease of stationary energy storage products and solar energy systems, and sale of electricity generated by its solar energy systems to customers. It develops energy storage products for use in homes, commercial facilities and utility sites. The company was founded by Jeffrey B. Straubel, Elon Reeve Musk, Martin Eberhard, and Marc Tarpenning on July 1, 2003 and is headquartered in Palo Alto, CA.
From a technical point of view,, $TESLA may have completed its first bull cycle with an impulse structure (12345) around $420, but since November 2021 it has started to lose value. With this in mind, a further mid-term decline is possible with a potential Target around $50.
Trade with care!
Like if my analysis is useful.
Cheers!
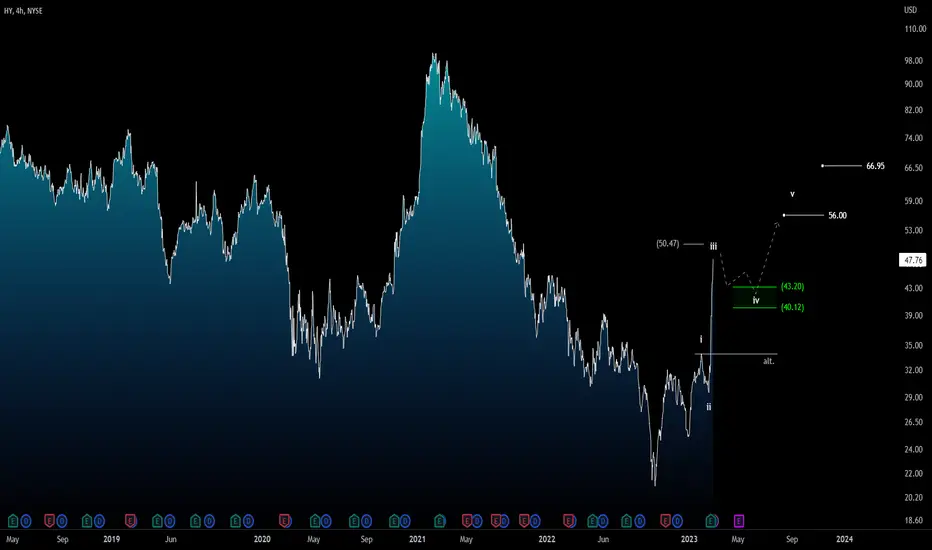
HYSTER ($hy): Elliott Waves Technical AnalysisTechnically speaking, the trend on the main time frame is bearish, but at the same time we might get some trading opportunities in the short term. If we look at the intraday chart (4H), we see a small impulsive structure developing, and in this case, we are working on wave III. If our idea/analysis is correct, in short term I expect some pullback which should form a corrective structure (ABC or ABCDE Pattern), so it could be interesting to try to take Long position on wave IV. As we can see on the chart the R/R ratio is not good (<1:3), so using a small size should be a correct choice.
Trade with care! 👍 ...and if you think that my analysis is useful, please..."Like, Share and Comment" ...thank you! 💖
Cheers!
N.B.: Updates will follow below
Do Todays Participants & Pundits Understand Todays Stock Market?I’ll get right to the point. NO
Now granted, as the reader, you’re immediately drawing your own conclusions about that opening statement. You're probably thinking... The author of this post is obviously bearish and therefore has an agenda. Ok, that’s fair.
Then indulge me as I explain, in detail , why I believe todays market participants and financial news pundits do not understand Todays Stock Market. My only request of you, the reader, is to continue reading with an open mind till the end and then judge for yourself.
I practice a form of technical analysis called Elliott Wave Theory.
Whether one would consider it theoretical after 90 years since it’s introduction, or not, is a discussion for another time. This post is not some diatribe debating, nor defending the Principles of Elliott Wave. However, I’ll sum up Elliott Wave for the uninitiated in a simple explanation for sole purpose of understanding this post.
Elliott Wave Brief Explanation:
Elliott Wave means to forecast crowd behavior specifically as it pertains to price action within a given market. As a long-time practitioner of this form of analysis I am still amazed to this day, to see price follow through on my forecasts with a high degree of both accuracy, and reliability. I’m never bored. But in truth, this form of analysis has little merit in markets in which there are no LARGE CROWDS. Price action in thinly traded penny stocks, fly by night crypto currencies, and so forth. You simply cannot forecast what the crowd will do, in the absence of a true crowd. However, in LARGE CROWDS, the basic premise of Elliott Wave is prices tend to move in 5 distinct “Waves” within a given trend. During the course of that 5-wave trend, price will correct, consolidate or digest gains or losses in 3 distinct “waves” prior to that trend completing. To examine those waves within a trend, an analyst should be able to drill down into smaller and smaller time frames and see the same principles playing out as these price action patterns are fractal in nature. They are self-similar. Ok, that is an overly simplified explanation of Elliott Wave. Nonetheless, its one in which I think is enough where I can guide you through my broader reasoning. Let me start out with my long-term SPX analysis.
Elliott Wave Analysis on the SP500:
In the above chart you'll find the 4-hour fractal of the below larger monthly fractal. I have posted these charts many times before, so long-term followers of my work will recognize them. But I start this broader explanation with the below monthly chart. Displayed in the chart below you see a series of labels in green ( I ), ( II ), and ( III ). Those green labels are what Elliott Wave deems a super-cycle price action analysis…or count. Its referred to as a “count”, because practitioners of Elliott Wave Theory are simply counting waves.
So if Elliott Wave is based on a series of 5-wave trend patterns, and 3-wave counter trend patterns that are FRACTAL in nature (my earlier over-simplified explanation), then after completing a wave ( III ), we obviously need a wave ( IV ). Now in all fairness to you the reader, has the monthly price action confirmed we’re in a super-cycle wave ( IV ) and wave ( III ) has in fact completed?
NO.
What confirms the price action is in a super-cycle wave ( IV ) event is a breach of the 2020 Covid-19 low of ES Futures 2174. That price (2174) is the litmus test for continuation to higher highs in the SPX or a long slog in equities that could last decades and decimate global wealth.
Now I have long told my members that... although I do not know what the catalysts are that ultimately validate the forecasted price action, those catalysts always tend to show up on time . I think in my trading room, my members would whole heartedly agree with that statement.
So, as I analyze price action from the day to day to the 1-minute chart and justify my primary long-term analysis today I am in no shortage of potential catalysts that are brewing. You know them all (Debt Ceiling, Regional Banking Crisis, The Fed, Inflation, Geo-Political…etc.) I choose not to speculate on the potential event, but on history. Is there a precedent? Yes, History.
There is…. somewhat. Here it is.
The last time we had our wave ( II ), super cycle counter trend price action, was the stock market crash of 1929. That is easy to see on the above chart, but what were the clues, or the potential catalysts leading up to that event almost 100 years ago?
Clue #1: The Panic of 1907
The Panic of 1907 was…wait for it…” A Financial Crisis”. During this time, the irresponsibility of bankers caused Bank Runs, and ultimately that translated into a 50% decline in the NYSE. That’s half…50%. This dried up any liquidity for loans. In other words, a credit crunch. Sound Familiar? Sidenote: You starting to get the sense that bankers always seem to be present at the scene of the crime so to speak? It’s perplexing. Who are these nefarious characters? Banking, in general, is terrible business model. But I digress…back to the point.
Clue #2: The Spanish Flu
The Spanish Flu of 1918 was a global influenza pandemic (H1N1) that decimated a third of the population on planet Earth. The Spanish Flu became a global pandemic because exiting World War 1, the war effort censors were accustomed to censoring bad news. Therefore, most of the population was ill-informed regarding the dangers of (H1N1) and disproportionately this effected the young and old members on the population. This was also a time of climate change and population migration patterns and this exacerbated the spread and effects of the flu.
This starting to sound like you’ve seen this movie before?
Clue #3: Massive economic bounce back
The jobs market was in high deficiency mode as early as 1922 having had so many of potential workers having died in the previous pandemic prematurely. This caused a massive supply-demand dislocation of (1) human nature to get out from under the atmosphere of The Spanish Flu and (2) live and consume…and the work force to meet those needs on a global scale. This resulted in a large economic expansion that lasted almost 10 years. In the United States, we refer to this era as, “The Roaring Twenties”. These three clues culminated in the stock market crash of 1929...hence our super-cycle wave ( II ).
As an analyst, as an intellectual, and as a student of history, I cannot ignore these flashing confluence of events in my time.
The Irish statesman, Edmund Burke has been attributed to having said… ” Those who don’t know history are destined to repeat it.”
The Spanish philosopher George Santayana is credited with the aphorism, “Those who cannot remember the past are condemned to repeat it.”
War Time British Prime Minister Winston Churchill wrote, “Those that fail to learn from history are doomed to repeat it.”
In summary, how does this all shake out?
Well, first and foremost I’ll say that this is not your father’s stock market, it’s not even your grandfather’s market. It’s more than likely your Great Grandfathers market. That market was terrible. That market had seismic effect on both society and asset appreciation. Keep in mind, this market has had it’s bull and bear markets. However, for the last almost 100 years, we’ve been in a secular bull market. During the last 100 years, we have experienced 3 impactful cyclical bear markets within a 93 year secular bull market since our super cycle wave ( II ) event in 1929.
During the last 93 years, the stock market has essentially appreciated in a solid, predictable 45-degree angle higher. Buy and hold, buying the dip, has been both the statistical and practical successful trading thesis. If this is a wave ( IV ) super-cycle event, trader sentiment must change. This takes time. Traders must now go through re-conditioning. A mourning, if you will, of the past 93 years of a secular bull market. Unfortunately, this only occurs with the loss of money, and over time. Cavemen continued to touch fire as it is visually magical. However, after a while, I’m sure they drew the conclusion this is NOT ADVISED . I keep CNBC on in the back ground of my small trading office. The incredibly smart contributors, and titans of money they feature quote metrics like typical bear market durations, what typically happens after the Fed has paused rate increases 6 months afterwards…and I’ll be the first to announce to you, the reader, THAT NO LONGER APPLIES.
We are no longer in that 93 year long 45-degree angle up. Those metrics… worthless . Those typical expectations… miss-guided .
THIS IS NOT YOURS, NOR IS IT YOUR FATHERS MARKET.
Now granted, this is somewhat of a thought speculation on my part (as of today). However, I do wonder…if traders, market participants and financial news pundits have objectively considered if they understand TODAYS STOCK MARKET.
FOOD FOR THOUGHT.
CHRIS
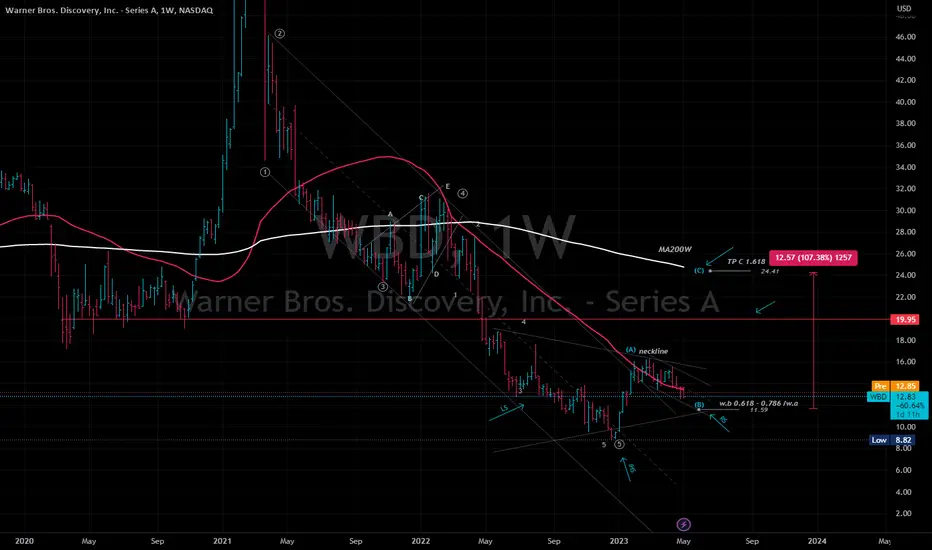
WBD | Wave Analysis | Downtrend breakout | Inv. Head & ShouldersWBD : Wave projection - weekly price action and chart pattern analysis
> The downtrend channel 5 motive wave breakout with a possible valid inverted head * shoulders pattern formation
> A potential ABC correction uptrend pattern - a typical wave b bull flag pattern for right shoulder pattern targeting at 0.618 - 0.786 fibonacci retracement of wave a.
> If successfully breakout neckline - TP wave c at 1.618 extension of wave a near MA200w zone +100%
> SL @ IHS position -20% downside
> Indicator : RSI week bullish divergence
Always trade with affordable risk and respect your stoploss
Good Luck
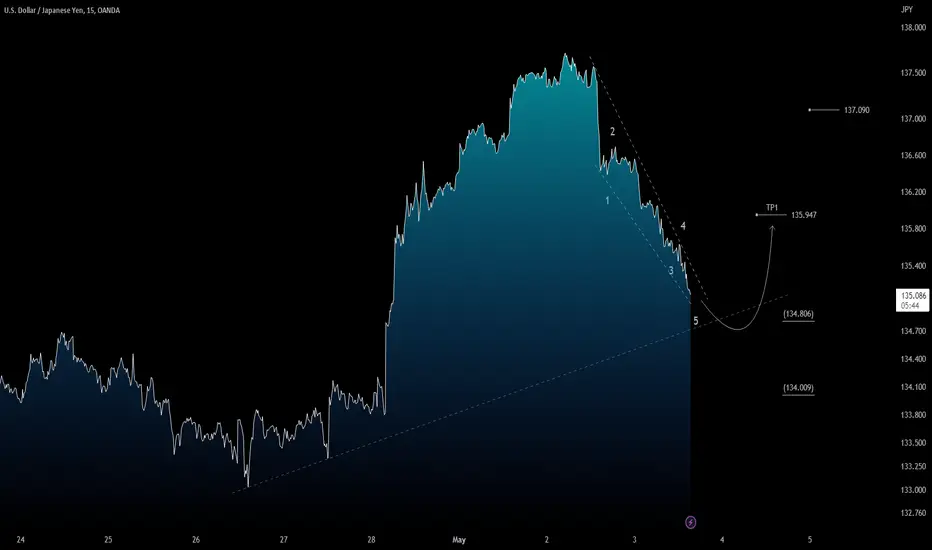
USD/JPY: Rebound during today' session?From a technical point of view, some consolidation swing is possible on small time frames (15'). As we can see on 15' chart, the FX:USDJPY pair may have developed an impulsive structure (12345). With this in mind, a bullish leg can appear during today's session with a first Target around 136. The market is waiting for the FOMC decision so be careful during this important event. This is a speculative setup (scalp) and requires experience and good risk management.
LONG TERM ANALYSIS (BULLISH)
(Click & Play on chart below)
Trade with care!
Like if my analysis is useful.
Cheers!
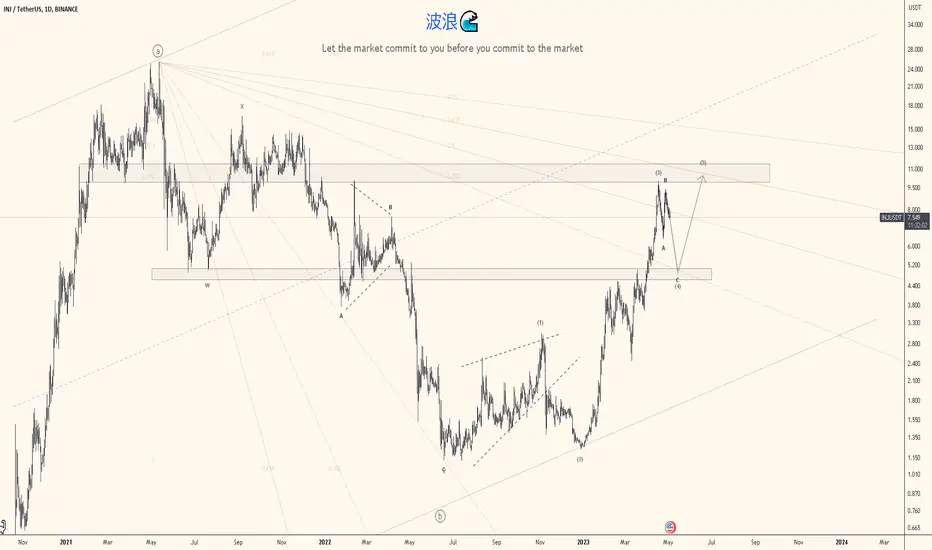
3 waves completed INJUSDTThis is my count for INJ/USDT, currently correcting for wave 4.
usually after a strong bullish move wave 4 is a shallow correction especially if consider the rules of alternation because wave 2 made a deep correction, I am expecting wave 4 to correct between .236 of fib or .382.
there's still a wave 5 I am expecting.
(i don't trade wave 4's personally, one of my trading rules)
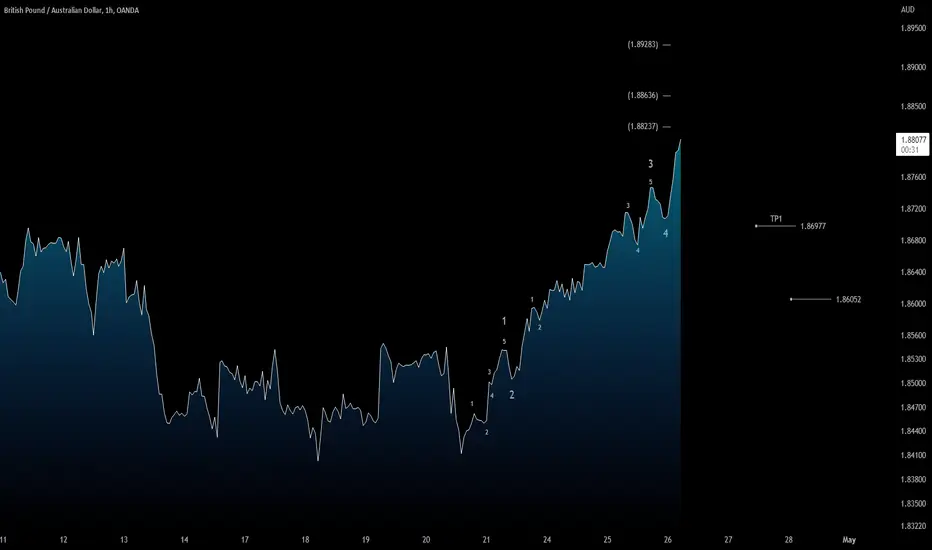
GBPAUD: Sell the rally in short term?From a technical point of view, the trend is bullish on intraday chart, but at the same time, the pair is completing its bullish impulse structure (12345), and once it is finished, I expect pullback at least to 1.8697 area (wave 4). My hope is that it can reach 1.89 area before bearish leg, but I'm not sure about that, let's see…
Note: Updates will follow below.
Trade with care!
Like if my analysis is useful.
Cheers!
MY ANALYSIS FOR GBPUSD 1ST OF MAY 2023Using the Elliott wave is likely that the market will go up and is also clear that the market has reach support level and want to make a pullback so going for long is needed

Trading ETHUSDT with Elliot WavesHi Traders, Investors and Speculators of the Charts 📈📉
Ev here. Been trading crypto since 2017 and later got into stocks. I have 3 board exams on financial markets and studied economics from a top tier university for a year.
In today's analysis, I'd like to present an easy-to-follow guide on using Elliot Waves for trading. Elliott Wave theory will require looking for a pattern of five consecutive waves before making a trading decision. Elliott Wave theory begins by identifying two different types of waves.
Impulsive waves : Move in the same direction as the overall trend, 12345
Corrective waves : On the contrary, move against the overall trend. ABC
Elliot Wave strategy needs to follow and abide by some strict rules in order to validate the 5 wave move. The three basic rules are :
Wave 2 never retraces more than 100% of Wave 1. Typically, the retracement is between 50% and 61.8% of wave 1.
Wave 4 never retraces more than 100% of wave 3. Typically, declines between 38.2% and 50% of wave 3.
Wave 3 always travels beyond the end of wave 1 and it’s never the shortest one; Wave 3 will normally extend 161.8 x wave
❗ as above, A is close to Wave 4
There are also cycles within cycles. Think of it as a broccoli stem, where each flower head is composed up of many tiny smaller flower heads:
Elliott Wave theory will require looking for a pattern of five consecutive waves before making a trading decision. Impulsive waves and corrective waves are perfect opposites. The most important thing is to observe the Macro trend before using Elliot Waves in other words, is the price in a bullish cycle or bearish cycle? Here are the basic steps to follow when trading with Elliott Waves:
Step 1: Learn the Theory
The first step is to familiarize yourself with the Elliott Wave Theory, which is based on the idea that financial markets move in predictable patterns. The theory suggests that market prices move in waves, with each wave representing a specific part of the overall trend. The theory identifies two types of waves: impulsive and corrective.
An impulsive wave consists of five smaller waves, which move in the direction of the trend. A corrective wave, on the other hand, consists of three smaller waves, which move against the trend. Understanding the basics of Elliott Wave theory is crucial to trading with Elliott Waves.
Step 2: Identify the Trend
The next step is to identify the trend in the market you want to trade. This can be done by analyzing the price action on the chart. To identify the trend, look for a series of higher highs and higher lows for an uptrend, or lower lows and lower highs for a downtrend.
Step 3: Look for Wave Patterns
Once you've identified the trend, you need to look for wave patterns within the trend. An impulsive wave is made up of five smaller waves, and a corrective wave is made up of three smaller waves . These waves can be identified by analyzing the price action on the chart.
Step 4: Use Indicators to Confirm the Wave Patterns
While identifying wave patterns on the chart is important, it's also a good idea to use indicators to confirm the patterns. Some of my favorites include the Relative Strength Index (RSI) , Moving Averages (MA) and CryptoCheck START v3.
Step 5: Enter and Exit Trades
Once you've identified the trend and wave patterns, and confirmed them with indicators, you can enter a trade. You can use the wave patterns to identify potential entry and exit points. For example, you may want to enter a long position at the start of an impulsive wave and exit when the corrective wave begins.
Step 6: Manage Risk
💭 Finally, it's important to manage risk when trading with Elliott Waves. This can be done by placing stop-loss orders to limit losses if the trade goes against you. It's also a good idea to use proper position sizing to ensure that you're not risking more than you can afford to lose. On the chart I have wave 4-5 hanging in the air atm, let's get to wave 3 first and then we can re-asses where 4-5 may be. Important to note that is is a longer term trading plan.
_______________________
📢 Show us some LOVE 🧡 Follow for daily updates and trade ideas on Crypto , Stocks , Forex and Commodities 💎
We thank you for your support !
CryptoCheck

MY THOUGHTS ON NASDAQ 100In my analysis of Nasdaq 100 on the WEEKLY Chart , I forecast that price is moving toward 14162.23 which is the 1.618 of Fibonacci for Wave C of the Elliott Wave. I utilized the Elliott Wave and the Fibonacci. OANDA:NAS100USD

BHARTI AIRTEL - POSSIBLE ELLIOT WAVE COUNTSHELLO FRIENDS,
Today I am sharing the possible ELLIOT WAVE counts of BHARTI AIRTEL on monthly, weekly and daily time frames.
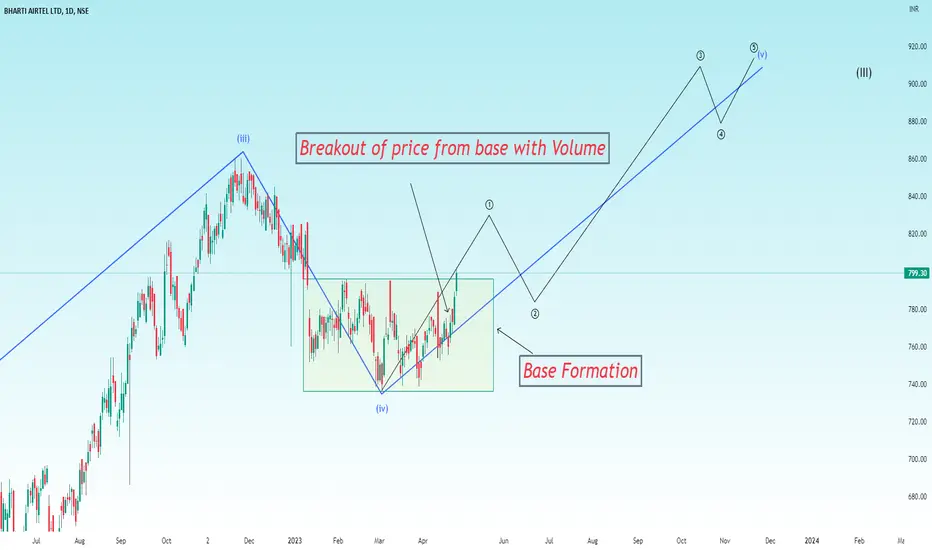
Bharti Airtel is in wave (5th) of 3rd wave of bigger impulse wave 12345.
Generally as per ELLIOT WAVE guidelines, bigger wave 3 may go up-to 1.618 of fib levels which is around 1060 on spot chart and also shown in the charts given below.
WAVES and DEGREES to refer and understand the chart smoothly.
Bigger Wave - 12345
one degree lower wave - (12345)
two degree lower wave ((12345))
three degree lower wave - (((12345)))
Time frames and ELLIOT WAVE COUNTS
MONTHLY - BHARTI AIRTEL is in the 3rd Wave of bigger Wave 12345
WEEKLY- It is in the ((5th)) wave of smaller degree wave ((12345)) which will complete Wave (3rd) and then after we can see some correction in wave ABC or ABCDE to complete wave 4 and after completion of wave 4, the price will again move towards north to start wave (5th) that will complete bigger wave 3rd
DAILY- It is in the smaller degree wave (((1))) of higher degree wave ((5th)) which will complete the wave (3)
monthly time frame chart which is showing that the price is in wave 3 of bigger wave 12345.
weekly time frame chart showing that the price is in wave ((5th)) of wave (3)
daily time frame chart showing that the price is in wave (((1))) of wave ((5))
It has also give a breakout of BASE FORMATION PATTERN with intensity is volume (i.e. volume is above MA)
at the time of breakout, trend indicator such as MACD and Oscillators such as RSI also shows strength in price.
MACD in daily
MACD in weekly
RSI in daily
RSI in weekly
Price is also above 100 Exponential Moving Average in Daily Time Frame
Summary-
Price showing UPTREND as per Elliot Wave
and also Price has given Breakout with good intensity in volume which again supports our bullish view.
Price have given close above 100 EMA which also signifies the bullish view.
trend indicators and Oscillators are aligned in double time frame which boosts the importance of our view.
Thus, stock is supposed to move in north.
DISCLAIMER
I am not SEBI registered analyst.
please consult your financial advisor before investing.
My studies are for Educational purpose.
I am not responsible for any kind of your profits and losses.
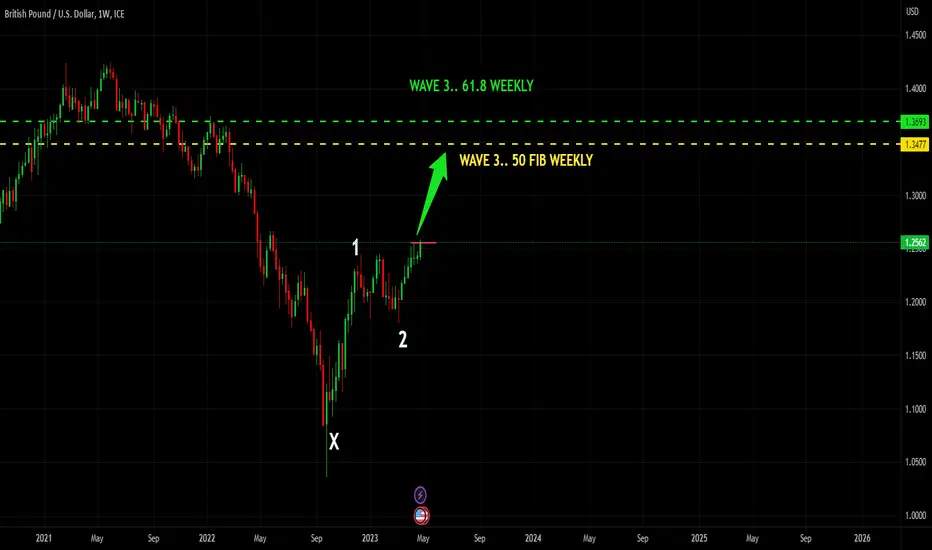
MY THOUGHTS ON GBP/USDIn my analysis of EUR/USD on the WEEKLY Chart , I forecast that price is moving between price $1.3477 which is the 1.50 of Fibonacci & price $1.3693 which is 1.61.8 of Fibonnaci, for wave 3 of the Elliott Wave. I utilized the Elliott Wave and the Fibonacci in my analysis. FX:GBPUSD
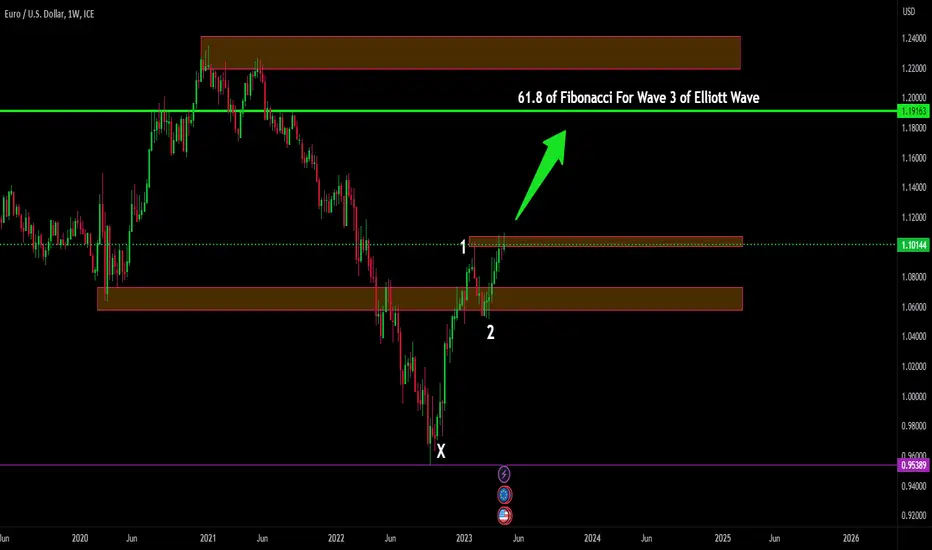
MY THOUGHTS ON EUR/USDIn my analysis of EUR/USD on the WEEKLY Chart , I forecast that price is moving toward price $1.18692 which is the 61.8 of Fibonnaci, for wave 3 or the Elliot Wave. I utilized the Elliott Wave and the Fibonacci in my analysis. FX:EURUSD
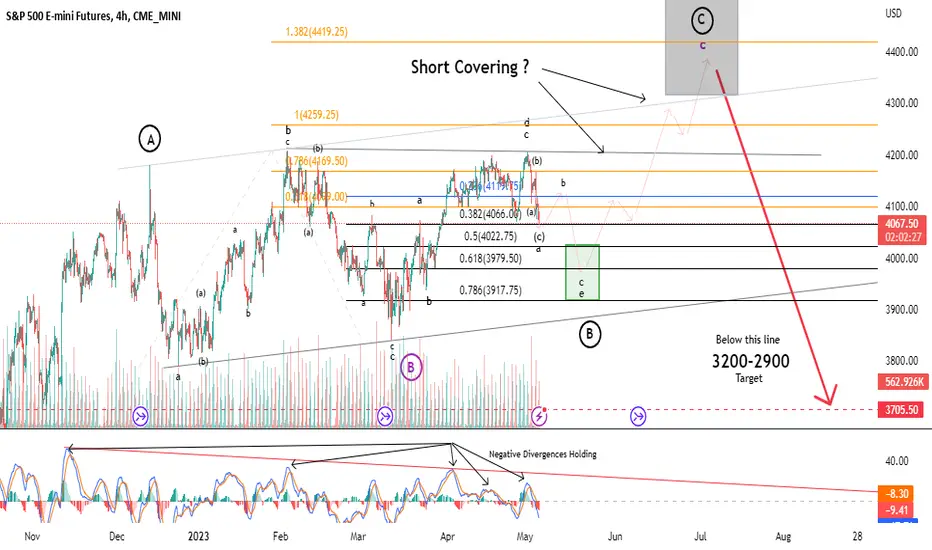
Weekly Update: So Far... Everything is Going According to PlanI’ve shared this chart with my followers for a couple months now. You can check my posting history to see how the forecasts have NOT changed, but the chart is filling in nicely. Tracking the minutia at the micro level has been maddening over the last month. In my trading room I’ve advised my members to focus on the intermediate term pattern depicted in the above chart.
Nonetheless, yesterday’s seemingly straight up move after about 9 am I’m sure scared traders who were positioned short. The irony of yesterday’s price action was although price traded not unexpectedly in my micro target box perfectly, I was expecting that sort of price action to take up till Monday or Tuesday of next week. So, in today’s market I’m not ruling out one more high into the 4170 area which would be the .786% retracement area. Much above that and the potential gets raised of invalidating our triangle pattern we started back in the last week of December 2022. But with no violation of the micro target box region which stood at 4130-4170 when price was at 4068.75 I have to continue to adopt the triangle pattern.
So how does this triangle pattern conclude?
I have guided both members and followers of my work with red arrows on the above chart since the end of February 2023 when the triangle pattern was first given credence. Currently, I am projecting this pattern to conclude mid-to-third-week in May. Yesterday’s price action has caused me to adopt a more sub-divided a-wave of our larger e-wave of the triangle, to complete our primary circle B. This was adopted after what I originally would be our a-wave came up slightly short of the 4064-4065 area, followed by a quick a-b-c retracement yesterday into 4166.50.
Yesterday’s price action, although introduced further complexity and sub-divisions into what I am projecting as an e-wave bottom in a larger triangle B…to the degree we do not eclipse 4170, but ultimately 4198.50 (which would be a new short term high).
I have to say… so far, everything is going according to plan.

BTC can STILL BE BULLISH after 50% dropHi Traders, Investors and Speculators of the Charts 📈📉
Ev here. Been trading crypto since 2017 and later got into stocks. I have 3 board exams on financial markets and studied economics from a top tier university for a year.
Before you panic, make sure you check out this idea of yesterday on Elliot Wave Theory analysis :
From the video analysis on Bitcoin, we've confirmed that the bearish cycle is over and a new wave is starting. It's not uncommon for the price to drop 50% during wave 1 of the 12345 Waves. From a macro perspective, the price will still be in an uptrend. Note that this doesn't happen in a day, or even in a week but over a coupe of weeks, sometimes even 2-3 months where it seems like BTC is not going anywhere and the weak hands are shaken up before the parabolic run which is Wave 3.
I believe Wave 2 starts when CryptoCheck START v3.5 flashes a sell:
You can swing trade the Elliot waves in wave 2, but be ready when wave 3 arrives so that you won't find yourself positionless during a parabolic run.
_______________________
📢 Show us some LOVE 🧡 Follow for daily updates and trade ideas on Crypto , Stocks , Forex and Commodities 💎
We thank you for your support !
CryptoCheck

Prepare for Impact: Scorpio Tankers Approaching Free FallScorpio Tankers Inc. (STNG) appears to be headed for a downside based on two significant factors - the impact of the oil market and the approach of Wave 3 in the Elliott Wave Theory. The recent downturn in the oil market has hit the entire industry hard, and Scorpio Tankers is no exception. As a company that operates in the oil tanker shipping industry, the drop in oil prices and demand for oil transportation services will have a significant impact on its revenue and earnings. Additionally, from a technical analysis perspective, Scorpio Tankers is approaching Wave 3 of the Elliott Wave Theory. After touching the 0.786 Fibonacci retracement of Wave 2, the stock saw a sharp decline, indicating that Wave 3 may be on the horizon. Based on this analysis, investors should look for the price of Scorpio Tankers to head towards the range of TASE:47 - TASE:43 in the near future.

AUDUSD: ABC Pattern in developing?Technically speaking, the AUDUSD pair is very attractive in short term. If we look at 30' chart, it seems that another bearish leg is still in play and could trigger something like ABC Pattern.

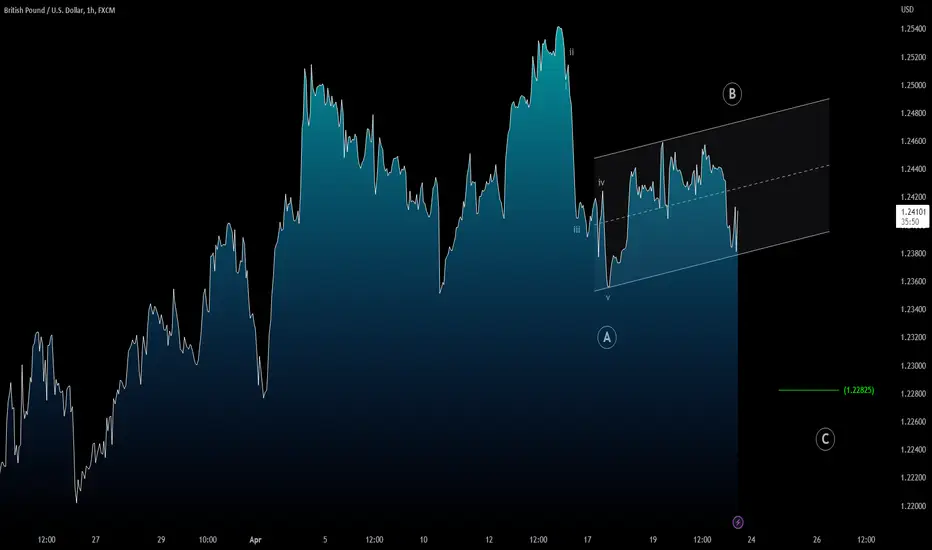
GBPUSD: Pullback in short term?The main trend remains bullish but in short term a corrective structure is possible to appear on hourly chart (ABC Pattern). If this analysis is correct, a bullish consolidation is still possible, but if this happens it should be considered part of a corrective structure.
Note: Updates will follow below.
Trade with care!
Like if my analysis is useful.
Cheers!
USDCAD: Mid Term Technical AnalysisOn daily chart is visible the reason why we took a long position at 1.3327 (see setup below), but the most important thing is to see how the channel is the Price Action main driver!
On a bullish side, Price action is developing something like ABCDE Pattern, not confirmed yet, it has our setup level (1.3327) as support. As shown on daily chart, when the rally is over, the Price Action will trigger an interesting corrective structure (pullback or bearish reversal) in short term (maybe visible on only small time frame).
OUR STRATEGY FOR NEXT WEEK
Use intraday time frame (preferably 1H) for area resistance detection.
Find support levels after correction structure.
Follow the short term development, click on chart below.
Note: Updates will follow below.
Trade with care!
Like if my analysis is useful.
Cheers!

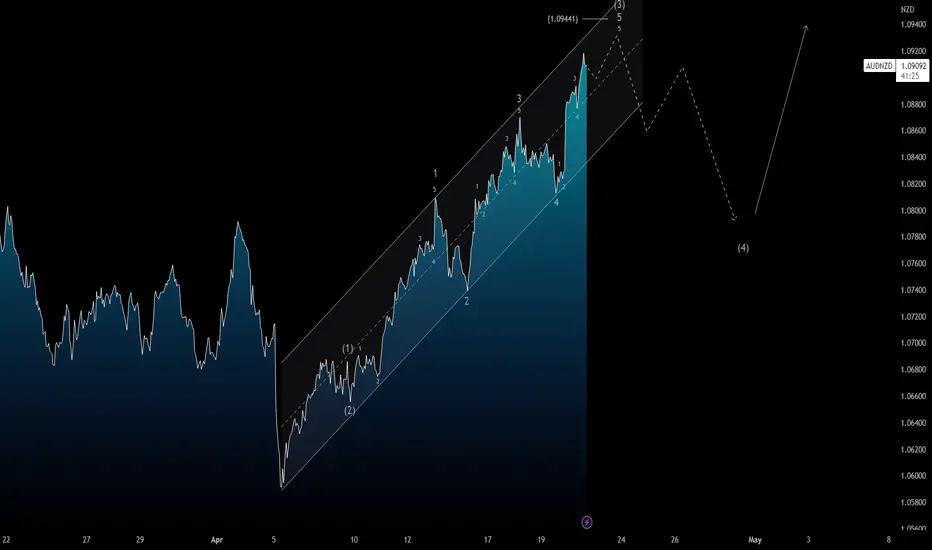
AUDNZD: Short Term Technical AnalysisThe trend is bullish but in short term some corrective structure is possible, having said that, from a technical point of view, the rally triggered on hourly chart should continue after the pullback completing the impulsive structure (1-2-3-4-5).
Trade with care! 👍 ...and if you think that my analysis is useful, please..."Like, Share and Comment" ...thank you! 💖
Cheers!
N.B.: Updates will follow below