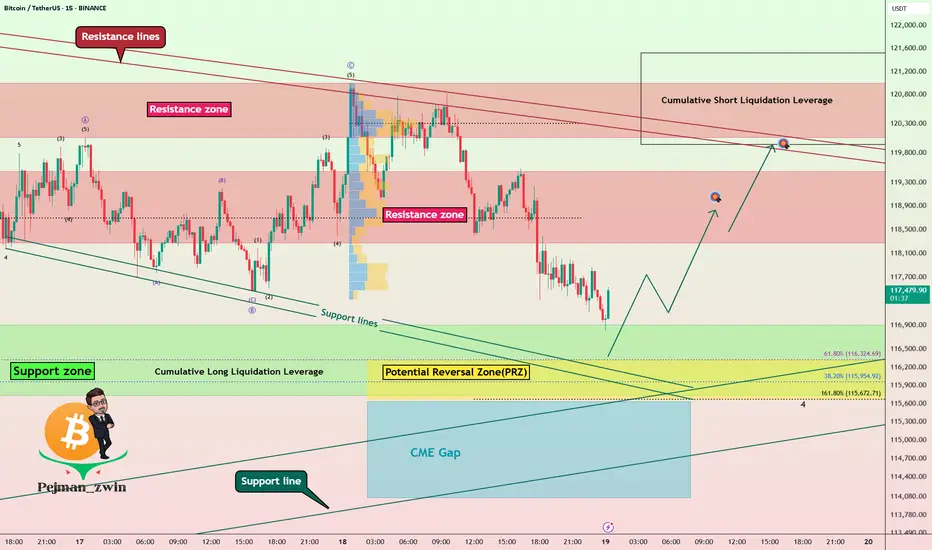
Bitcoin Technical Setup: Support Holds, Eyes on $118,600Bitcoin ( BINANCE:BTCUSDT ) moved as I expected in the previous ideas and finally completed the CME Gap($117,255-$116,675) in the last hours of the week. ( First Idea _ Second Idea )
Before starting today's analysis, it is important to note that trading volume is generally low on Saturday and Sunday , and we may not see a big move and Bitcoin will move in the range of $121,000 to $115,000 ( in the best case scenario and if no special news comes ).
Bitcoin is currently trading near the Support zone($116,900-$115,730) , Cumulative Long Liquidation Leverage($116,881-$115,468) , Potential Reversal Zone(PRZ) , and Support lines .
According to Elliott Wave theory , Bitcoin had a temporary pump after the " GENIUS stablecoin bill clears House and heads to Trump's desk " news, but then started to fall again, confirming the end of the Zigzag Correction(ABC/5-3-5) . Now we have to wait for the next 5 down waves or the corrective waves will be complicated .
I expect Bitcoin to rebound from the existing supports and rise to at least $118,600 . The second target could be the Resistance lines .
Do you think Bitcoin will fill the CME Gap($115,060-$114,947) in this price drop?
Cumulative Short Liquidation Leverage: $121,519-$119,941
Do you think Bitcoin can create a new ATH again?
Note: Stop Loss(SL)= $114,700
Please respect each other's ideas and express them politely if you agree or disagree.
Bitcoin Analyze (BTCUSDT), 15-minute time frame.
Be sure to follow the updated ideas.
Do not forget to put a Stop loss for your positions (For every position you want to open).
Please follow your strategy and updates; this is just my Idea, and I will gladly see your ideas in this post.
Please do not forget the ✅' like '✅ button 🙏😊 & Share it with your friends; thanks, and Trade safe.
Elliott Wave
Final Phase of Circle Wave 3 XAG/USDFXOPEN:XAGUSD
We’re currently in the final stages of Circle Wave 3, which has developed through a series of 1–2–3 structures and internal ABC corrections.
Right now, we’re within the yellow count, moving from Wave 4 to Wave 5 – typically unfolding as an ABC structure.
🟡 Zooming In: Current Setup
✅ Wave A (of 4→5) is already complete – it formed as its own ABC
🔄 We’re currently transitioning from A → B
📈 A short-term move up is likely before a short entry targeting the final Wave C of 5
📏 Key Fibonacci Confluence Zone
I’ve marked the 71% extension level in green – it aligns perfectly with my broader Fibonacci target zone, where we could see the highest volume come in
My personal limit sell is at 37,700, inside this confluence zone
🛑 Stop-loss: 37,500 (below Wave 4)
🎯 Take-profit: Around 39,260, though this area could extend higher depending on momentum
💡 Trade Idea Summary
A clean, simple setup:
Look for upside push (Wave B)
Set limit short in the Fib zone (green area)
Watch for reversal into Wave C to complete Circle Wave 3
After that, I’ll be looking for mid- to long-term short setups 🔽

XAU/USD Analysis – Wave 2 Still in ProgressOANDA:XAUUSD
We're currently in a corrective structure following our Circle Wave 3.
✅ (A) and (B) of the correction are already complete.
🔽 Now we're in the development of Wave (C), which should unfold as a 1–2–3–4–5 structure.
📌 Current Situation
Wave 1 of (C) was very impulsive – a strong move confirming the structure
We're now in Wave 2, which is developing as a classic ABC correction
✅ Circle A and Circle B are complete
🔄 Currently transitioning from Circle B to Circle C
🧠 Market Insight
We’ve already seen the first touch of the Fib zone, but I don’t believe that marks the end of Circle C just yet – the time duration of B → C is too short compared to 1 → A and A → B.
That's why I expect a smaller degree correction playing out now:
→ (A) → (B) → (C) (lower timeframe within Circle C)
Alternatively, the whole 1 → 2 could even unfold as an A–B–C–D–E triangle, though I personally prefer ABC structures for cleaner setups and better trade entries.
📈 Trade Setup
There are two short setups currently marked in the chart:
Sell from small B → small C
🎯 Take-Profit: Aligned with Fib Extension Zone near 3400
🛑 Stop-Loss: Just above the small A
Sell from small C extension move
🛑 Stop-Loss: Below (B)
🎯 Target: Also around the major Fib confluence zone at 3400
📊 Conclusion
✅ Wave (1) done
🔄 Wave (2) still unfolding as complex ABC
⚠️ Be patient for confirmation of small B → C
🟢 Fib zones aligned – volume expected around 3400
🧩 Clean setups preferred over triangle flags

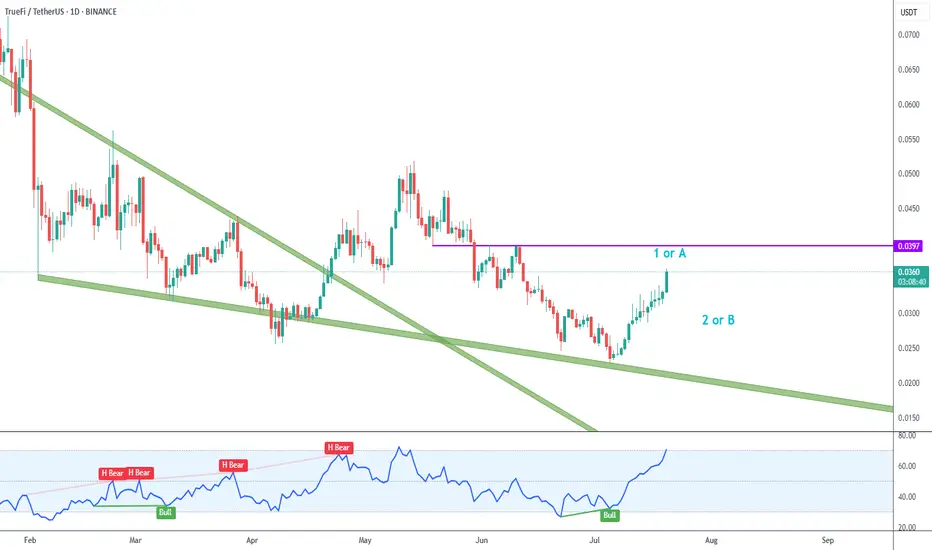
TRU Upside Reversal
Truefi´s recent upside after touching the green descending trendline looks convincing, with a motive wave and bullish RSI divergence.
I´m labeling this as wave 1/A.
Right now price is overbought, so I´ll wait for wave 2/B pullback to look for long trades.
Next key resistance zone is just below 0.04.
MKR 4h Chart Analysis
On the 4H Chart the 2,200 supply zone proved to be too strong for bulls, and there was a strong rejection.
My primary count considers that was wave Y, and I´m currently neutral to bearish.
A break of blue support zone around 1,970 should take us to another retest of 1,700 support.

SOLANA - BULLISH & BAERISH
Hello everyone,
here is my current outlook on Solana (SOL):
Personally, I am currently only watching Solana as we may already be in a correction phase. Nevertheless, there is an interesting scenario where we could still be in a green wave 5, which could potentially reach prices above USD 300.
Possible course:
In April 2025, the bottom may have been found following an ABC formation.
Wave 1 (yellow) could be completed in May 2025.
Wave 2 (yellow) could end in June 2025.
We could currently be in wave 3 (yellow).
Important point to watch:
If the price does not make it sustainably above the yellow wave 1 (approx. USD 190), the probability increases strongly that we are still in a B wave.
This would mean that we are still in a major correction, which could theoretically take us back to around USD 60. In this scenario, wave 1 would have already ended in January 2025 and we would still be in the correction of wave 2.
Conclusion:
The indicators are particularly important in this phase. Keep a close eye on them to better understand the structure.

Looking to complete a wave 4 Retracement on Arbitrum Short term outlook is bearish as we are looking to complete an expanding flat to the downside. Wave B neared it invalidation, but reversed down. Lets see if the bears can push it down to the 0.5 Fib Target, soft target is the 0.382 Fib. If volume increases this could be a third up, but we need the wave 4 at the moment, and wave B of the expanding flat is a clear 3 waver so far. Long term we are still bullish with plenty of nested wave 3s to keep us counting to the upside in the future haha. Not Financial Advice
ETH roadmap to 5000!Ethereum Wave 3 in Play? Eyes on the $4500 Target
Ethereum may currently be progressing through a wave 3, which is often the strongest leg of an impulse. The structure so far supports that idea, and based on standard projections, the most likely target sits near $4500.
If price can break and hold above the 4k level, we could see a consolidation forming above the previous high. That would be a constructive sign and might set up the next leg higher.
But there’s still a chance ETH struggles to clear that level. If that happens, consolidation could form just underneath, which would still be acceptable within a wave 3 framework. What matters next is the shape and depth of the pullback.
Wave 4 will be the key. A shallow or sideways correction would keep bullish momentum intact. A deeper pullback doesn't ruin the structure, but it does mean we’ll need to watch support zones more closely.
If wave 4 behaves well and broader market conditions stay supportive, then a final wave 5 could bring ETH into the $5000 region. That’s the upper edge of this current roadmap, based on conservative assumptions.
Stay flexible. Let the structure guide the bias.

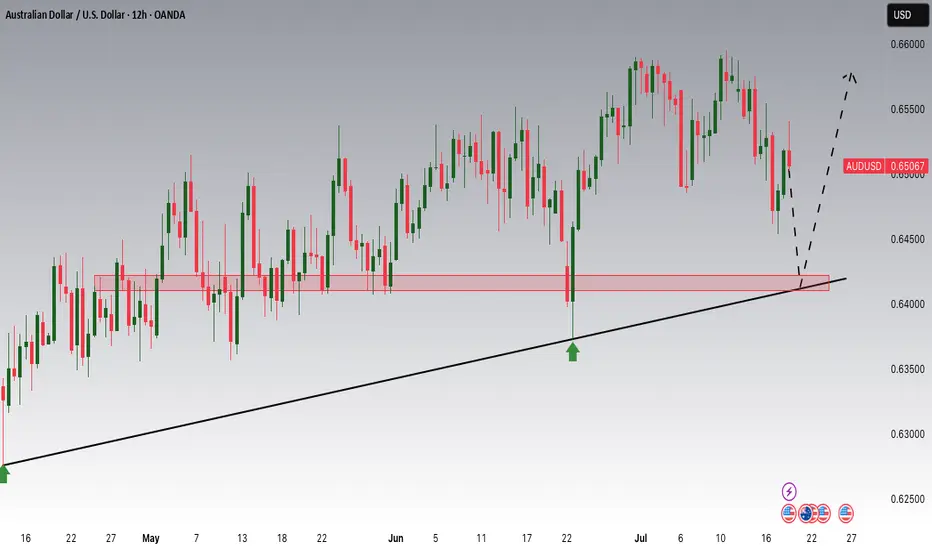
AUDUSD Potential UpsidesHey Traders, in tomorrow's trading session we are monitoring AUDUSD for a buying opportunity around 0.64200 zone, AUDUSD is trading in an uptrend and currently is in a correction phase in which it is approaching the trend at 0.64200 support and resistance area.
Trade safe, Joe.
$SHIB Ready to Move?CRYPTOCAP:SHIB has printed confirmed weekly bullish divergence in RSI and is now attempting to overcome the weekly 200EMA resistance.
A High Volume Node lies just above but a close above this will signal a bullish trend ready to move the initial target of the weekly pivot point followed by the 0.0003579 High Volume Node.
Price completed its retracement to the 'alt-coin' golden pocket 0.786 Fibonacci retracement.
Bearish divergence is currently growing on the weekly RSI but will be diverted with a thrust high!
Is it MEME season? CRYPTOCAP:DOGE also looks ready to go!
Safe trading

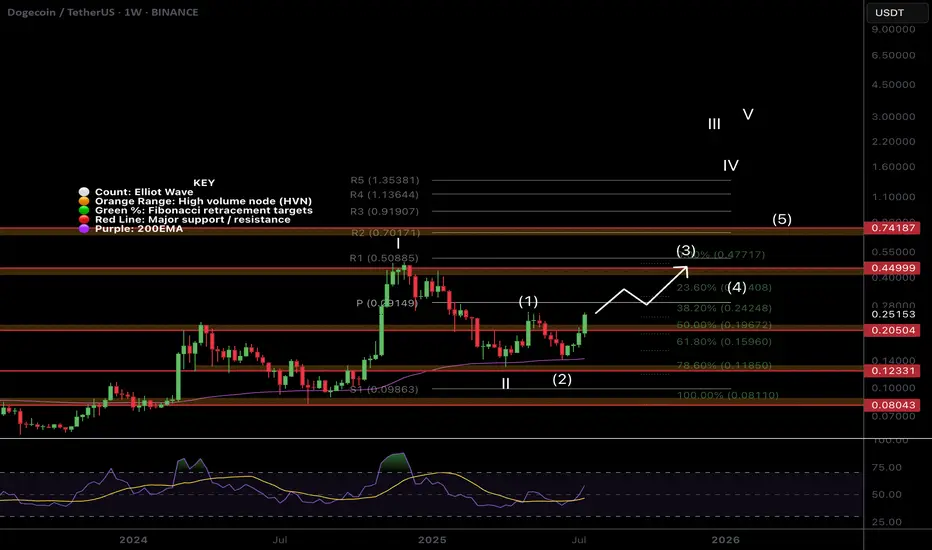
$DOGE Flipping to Bullish Structure!CRYPTOCAP:DOGE is coming to life after a second test of the weekly 200EMA as support and about to make a higher high, cementing in that higher low and flipping the macro structure bullish!
If the count is correct wave 3 of (III) should be powerful! The weekly pivot should put up a challenge as the first resistance before the High Volume Node at $0.45
Safe Trading
BTC Ready for the new impulse ? Elliott wave analysis 20/7/2025In my view, Bitcoin (BTC) has completed its micro correction and is now poised to move toward the $135,000–$139,000 target zone. This expectation is supported by the following factors:
1. Completion of the Sub-Waves in Wave (4)
My analysis of wave (4) indicates that it consists of an ABC correction, where wave B formed a WXYXZ pattern.
Additionally, I have counted the sub-waves within wave C of wave (4) and observed a complete 5-wave structure, suggesting that the fifth wave of wave C has ended, confirming the completion of wave (4).
2. Cypher Harmonic Pattern Pivot Point
I have identified a Cypher harmonic pattern with a pivot point around $116,600.
The termination of wave (4) occurred close to this pivot level, followed by a new impulsive move that made a higher high and formed a clear 5-wave structure—further confirming that wave (4) has likely ended.
3. Hidden Bullish Divergence on the 4-Hour Timeframe
A hidden bullish divergence can be observed on the 4-hour chart, particularly at the end of wave (a) and wave (c).
Historically, 4-hour hidden bullish divergences have often preceded strong bullish impulses. For instance, a similar setup occurred during the bullish rally from April 9, 2025, to May 22, 2025.
4. Failure to Make a New Low After Resistance Retest
The new impulse wave that emerged after the end of wave (4) has met resistance but failed to make a new low, suggesting that a fresh upward impulse is underway.
How Far Could Wave (5) Extend?
It is important to note that the wave (5) (blue) impulse is a sub-wave of wave (5) (purple).
The lengths of wave (3) (purple) and wave (5) (purple) are currently similar, which is unlikely because both are part of the major wave V (green), where typically only one wave should extend.
Since wave (3) has already completed, wave (5) is likely to be the extended wave, with a target length between 1.272 and 1.618 times the length of wave (3).
Interestingly, two Gann fan projections point to resistance levels in the $135,000–$139,000 range, which perfectly aligns with this 1.272–1.618 extension zone.
Invalidation Point
The invalidation level is around $117,000, as the micro correction within the new impulse should not drop this low.
If BTC falls below $117,000, it could imply that wave (4) has not yet completed and may be taking another corrective form.
For example, the wave (c) we currently see might only be wave 1 of a larger wave (c), or the correction in wave (b) may still be ongoing.
However, this scenario seems unlikely given the weight of evidence suggesting that wave (4) has already ended.

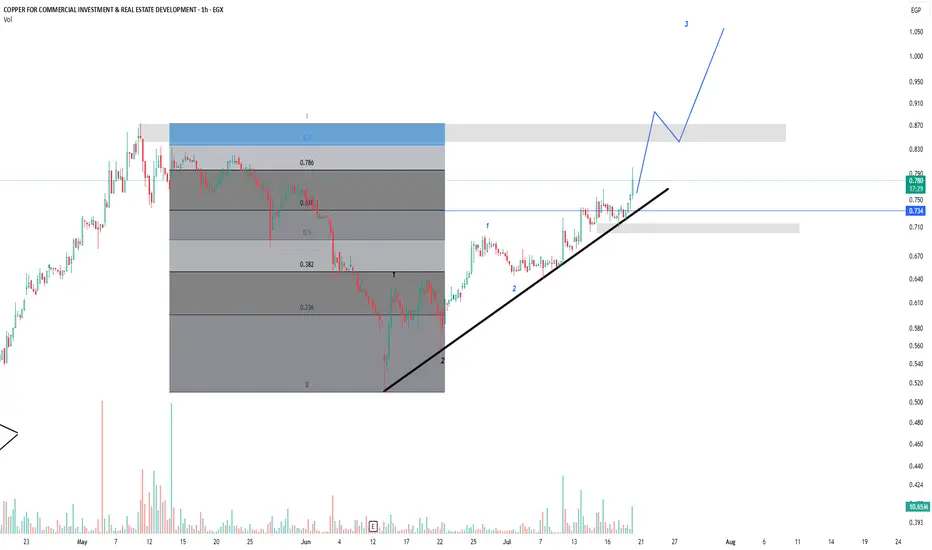
copran impulse wave is in its way to make new highs ,, i think 0.87 will be easy to be shocked very soon ,,,, 61% level is a strong support now
USDT DOMINANCE NEW UPDATE (1D)In a previous analysis, I mentioned that the long-term outlook for this parameter (USDT.D) remains extremely bearish. At the time, a bear flag was clearly visible—but it hadn’t been broken yet.
Well, now it has.
The breakdown confirms the bearish continuation, and there’s still more room to fall. As USDT.D continues to descend towards the projected target for Wave 3, we are likely to see a new All-Time High in Bitcoin, accompanied by a strong rally in many altcoins.
The main target for Wave 3 sits at 3.75%—a historically critical level. For years, USDT.D has never fallen below this zone, making it an extremely strong support area.
⚠️ Reminder: Consider taking profits when USDT.D approaches the 3.80–3.75% region. A reversal or temporary bounce is highly likely there.

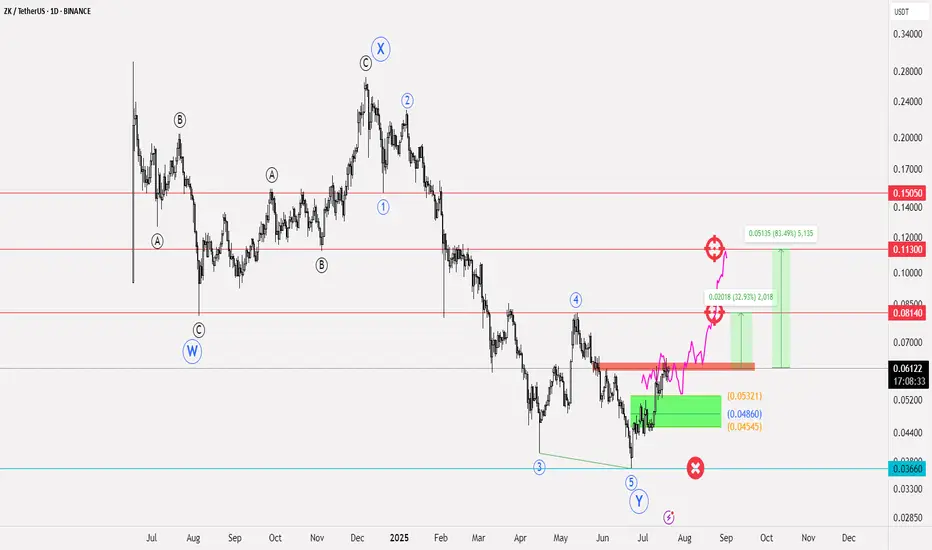
ZKUSDT Elliott Waves analysis📝 Currency NYSE:ZK
✅ Entry points for the currency: at the current price of 0.06135, the reinforcement should be within the range of 0.05321 - 0.04860
🔴 Stop loss is below 0.03660
💹 Potential targets: first target 0.08140 and if the currency enters a bullish wave, the target will be towards 0.1130, reaching up to 0.150
📊 The profit-to-loss ratio is 5:1
📝 This idea is based on Elliott Waves analysis, especially since the beginning of the currency's listing, where a WXY pattern formed, and this pattern was confirmed after the upward rebound from 0.03660, which we considered as our stop loss. The liquidity range is the range we defined for reinforcement; its stability will give momentum and strength to the currency to complete an upward path, at least achieving a trend towards the peak of wave 4
❤️ Good luck to everyone - do not enter any currency before studying the risk ratio you will undertake
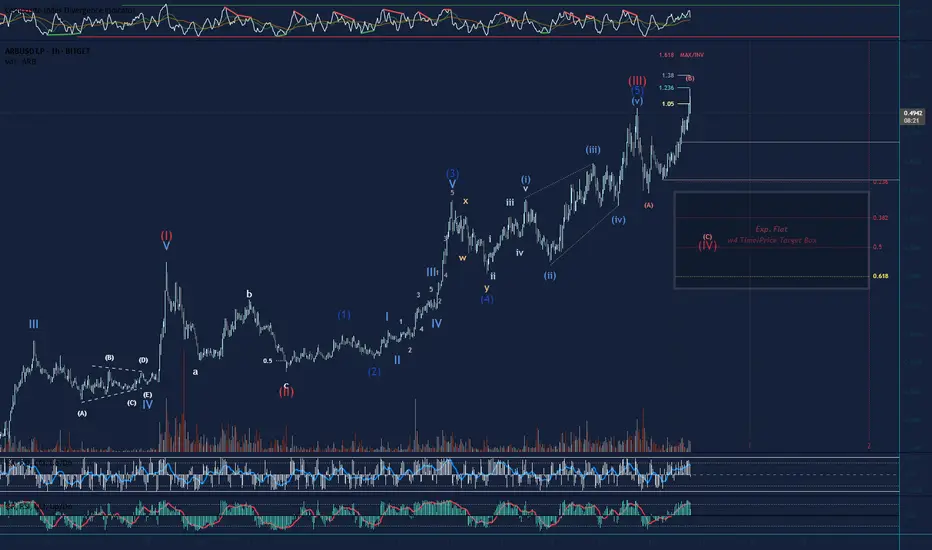
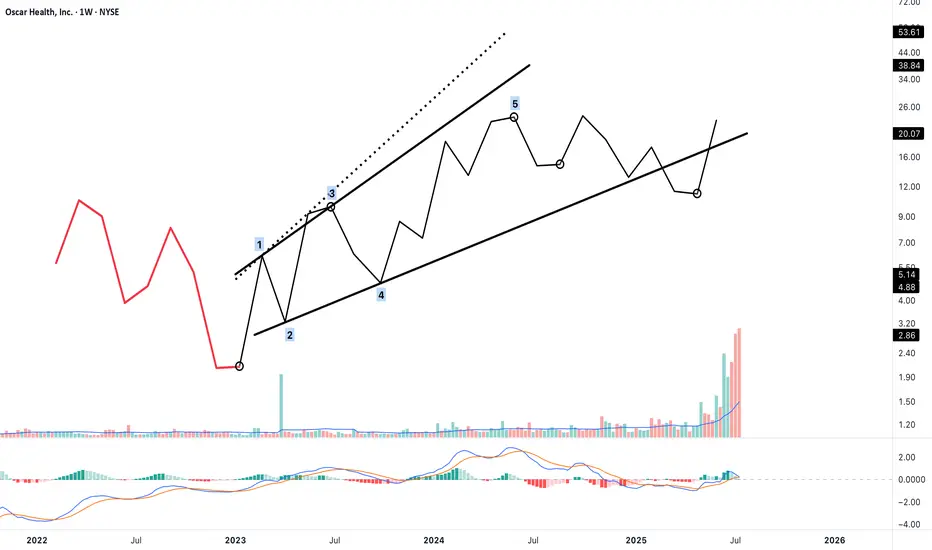
Possible Terminal Impulse as Wave 1 or A — Structure Completion?This chart presents a potential 5-wave terminal impulse structure — most likely a 5-extension terminal, where waves 1, 3, and 5 display impulsive character.
This move may represent the beginning of a new sequence — either as:
"Wave 1 of a larger motive structure"
"or Wave A of a corrective formation"
🔹 The wave is segmented using 12-bar intervals on a weekly chart.
🔹 Wave 3 and Wave 5 both meet the price extension and structural criteria of Neely’s Rule 4.
🔹 The final wave (5) reaches just above 141.4% of Wave 3, consistent with a 5-extension terminal.
🔹 Channel boundaries and post-terminal retracement suggest a completed structure.
According to NeoWave guidelines, the structure meets both:
Impulsive appearance, and
Overlap conditions required for a terminal.
The current focus shifts to analysing the post-terminal movement to determine whether it is part of a:
"2nd wave correction (if terminal was Wave 1)"
"or B wave retracement (if terminal was Wave A)"
🔍 Further bar-by-bar and structural analysis will be applied to this segment next, likely starting from m10 and beyond.
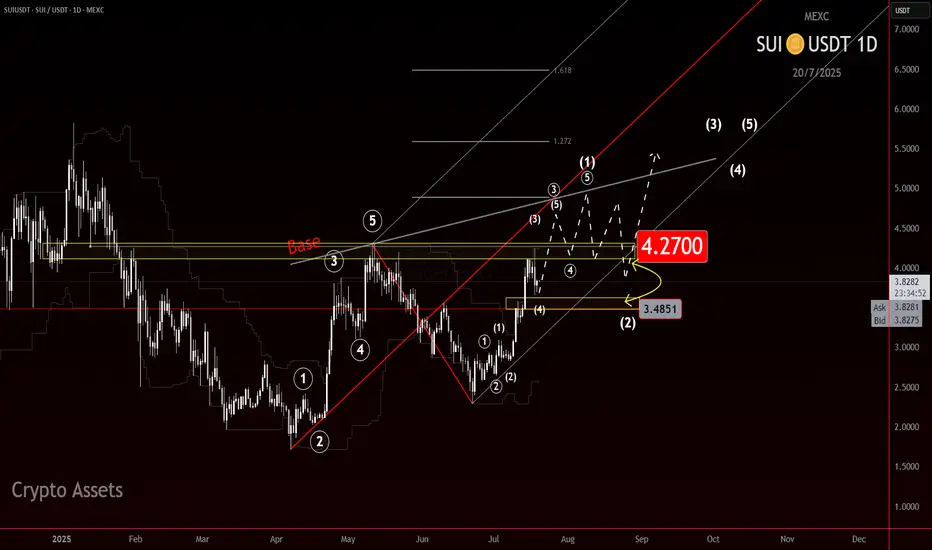
SUI: Calm Before the Wave 3 Surge?CRYPTOCAP:SUI is shaping up to be one of those charts that makes you lean in a little closer.
Right now, it appears to be sitting inside a potential wave 3, but something feels off. It hasn’t exploded yet. And when you’re looking for wave 3 behavior, that’s what you want: speed, commitment, follow-through. A clean surge, ideally in a straight line, that clears doubts and leaves the doubters behind.
We’re not seeing that yet. Right now the move is decipherable at many nested degrees making this move feel cautious.
And that opens the door to some possibilities:
It is a wave 3, just one that hasn’t lit the match yet.
We’re still nesting, multiple wave 1s and 2s stacking before the actual move hits.
Or it's a wave C of a Zig Zag.
As for levels, $4.20 stands out. Whether this turns into a rocket or a reset likely hinges on how price reacts there.
Stay nimble. If this is a true wave 3, it’ll leave no time for hesitation.
Be early, but not reckless.
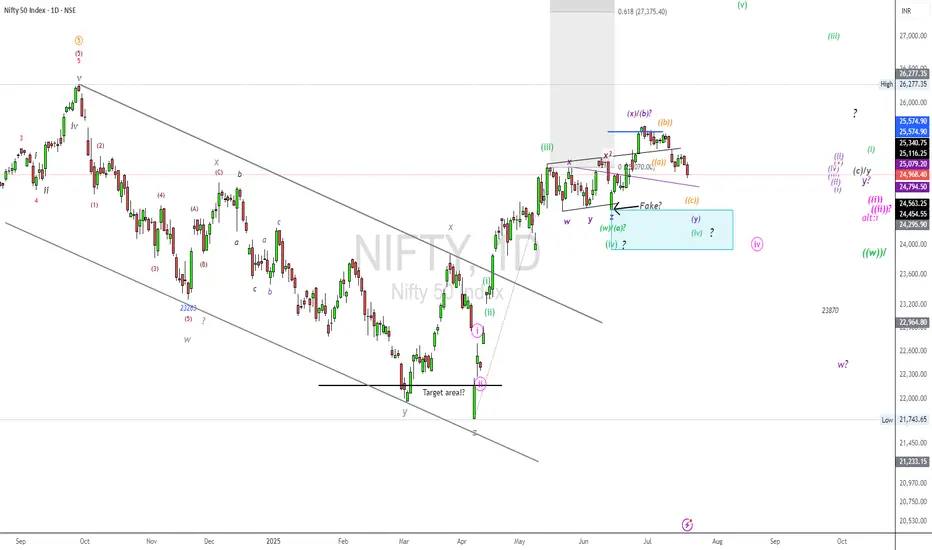
NIFTY50.....Where are the targets?Hello Traders,
The NFTY50 failed to make new high's, but has achieved my long-term target @25577 points.
It also broke below the trend-line, connecting the high's of 25116 to 25222. This is a bearish sign!
I have labelled the chart as a w-x-y pattern, that could also morph into an a-b-c!
But what to expect for the coming sessions?
Chart analysis.
The weakness at chart is not done to my view!
In normal, a corrective move, here a possible wave ((iv)), pink, will return to a wave 4 of lower degree. So we should expect a target range at or around the 24000 points! If so to come, this would be potentially buy_area! A break to the upside is not in (my) the cards. Too much overlapping waves, buy and immediately sell-orders..... This is not how an impulse look like!
Of course; a wave iv correction can morph into a w-x-y pattern. And if so, the price would extend to an 2.618 Fibo after it was complete!
Again. The correction look like not complete, and it will be interesting how markets will answer on Monday.
So, that's it for today!
Have a great weekend.....
Ruebennnase
Please ask or comment as appropriate.
Trade on this analysis at your own risk.
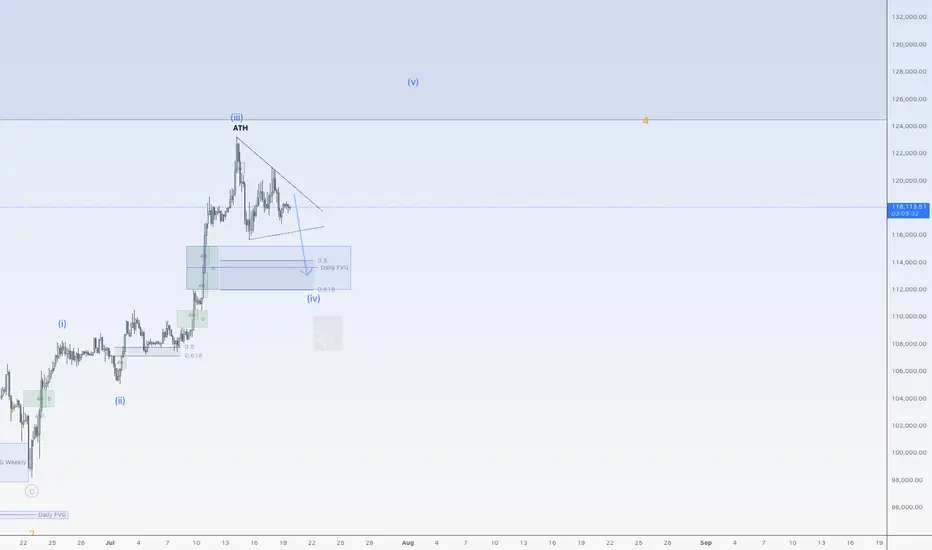
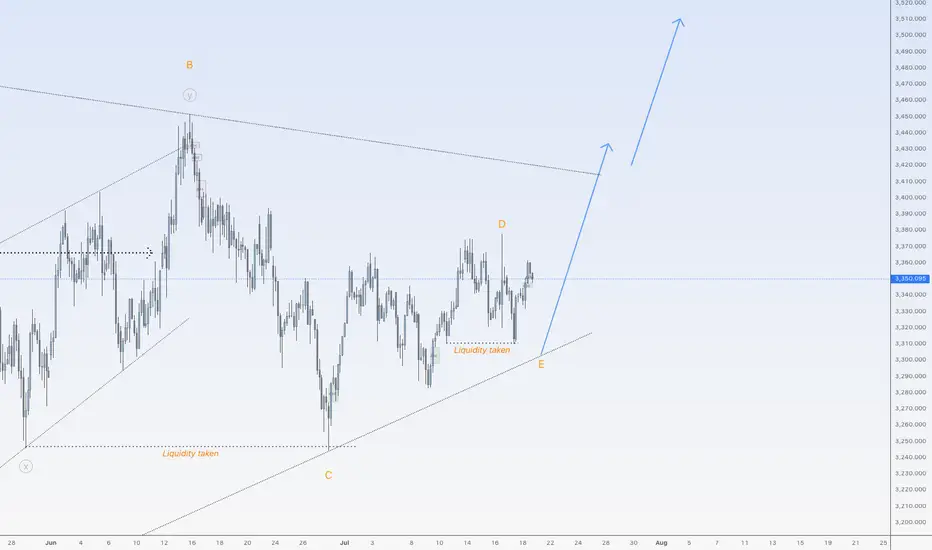
Correction down for BitcoinHi traders,
Last week Bitcoin made a small correction down and up again to finish wave 3 (blue).
After that it started a bigger correction down for wave 4 (blue). This could be a Triangle (no break of previous low) or Zigzag (break of previous low into the bullish Daily FVG).
After the finish of the correction down we could see more upside again.
Let's see what the market does and react.
Trade idea: Wait for the correction down to finish.
Then after an impulse wave up, a small correction down on a lower timeframe and a change in orderflow to bullish you could trade longs.
If you want to learn more about trading FVG's with wave analysis, please make sure to follow me.
This shared post is only my point of view on what could be the next move in this pair based on my analysis.
Don't be emotional, just trade your plan!
Eduwave
Gold is ready to go upHi traders,
Last week gold made another correction down for Wave E but after that it broke the low again. This could be wave 2 of the next impulsive wave up and gold will continue to rise next week.
Or price makes one more move down for wave E and then start the next impulsive wave up.
Let's see what price does and react.
Trade idea: Wait for a small correction down on a lower timeframe and a change in orderflow to bullish to trade longs.
If you want to learn more about trading FVG's & liquidity sweeps with wave analysis, please make sure to follow me.
This shared post is only my point of view on what could be the next move in this pair based on my technical analysis.
Don't be emotional, just trade your plan!
Eduwave
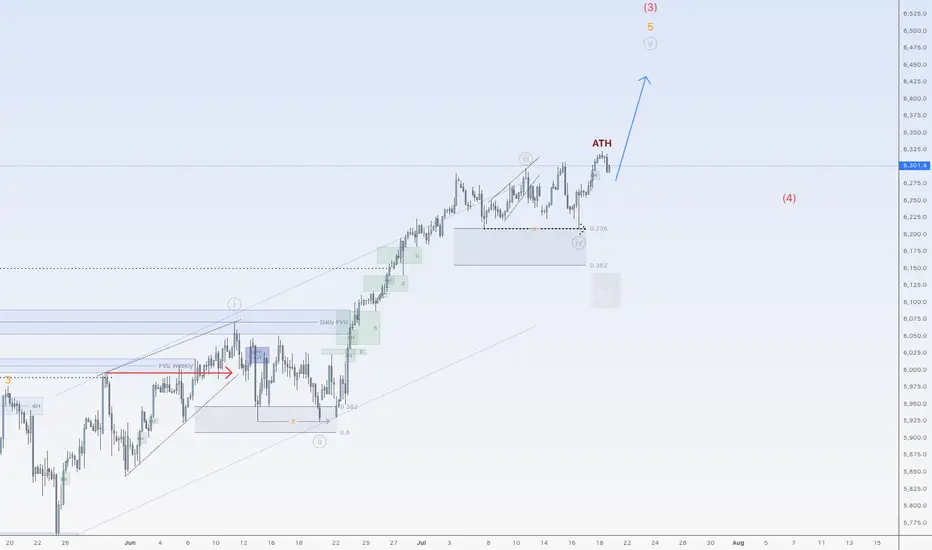
More upside for SPX500USDHi traders,
Last week SPX500USD made a small correction down (grey wave 4) and after it swept the dotted trendline it went up again. This could be the next impulse wave 5 (grey).
If this is true, then next week we could see more upside for this pair.
Let's see what the market does and react.
Trade idea: Wait for a small pullback and a change in orderflow to bullish on a lower timeframe to trade longs.
If you want to learn more about trading FVG's & liquidity sweeps with Wave analysis, then please make sure to follow me.
This shared post is only my point of view on what could be the next move in this pair based on my technical analysis.
Don't be emotional, just trade your plan!
Eduwave
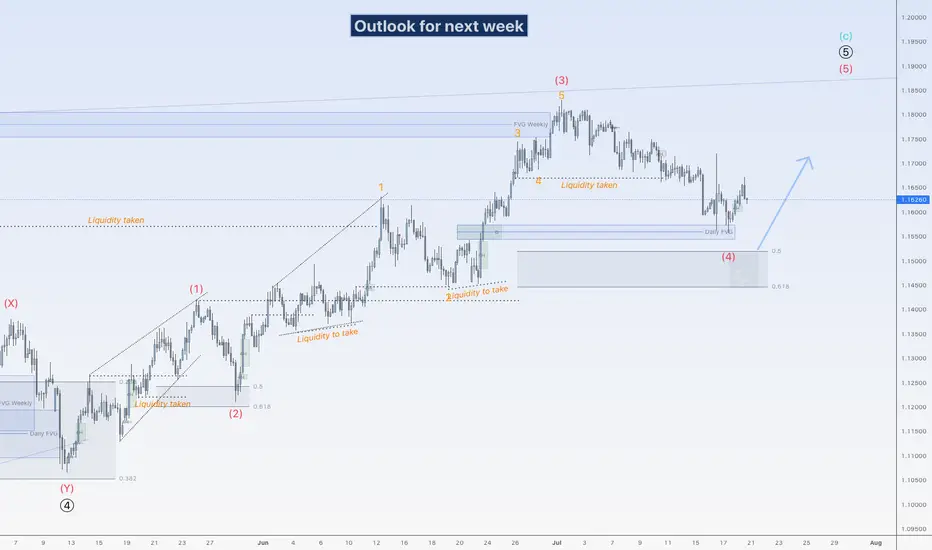
EU could go up againHi traders,
Last week EU continued the slowly down movement to the next bullish Daily FVG. Price rejected from there and swept the low of the rejection. After that it slowly went up again.
Next week we could see price go higher for the start of the next (impulsive or corrective) wave up.
Let's see what the market does and react.
Trade idea: Wait for the finish of a correction down and a change in orderflow to bullish on a lower time frame to trade longs.
If you want to learn more about trading with FVG's, liquidity sweeps and Wave analysis, then make sure to follow me.
This shared post is only my point of view on what could be the next move in this pair based on my technical analysis.
Don't be emotional, just trade your plan!
Eduwave
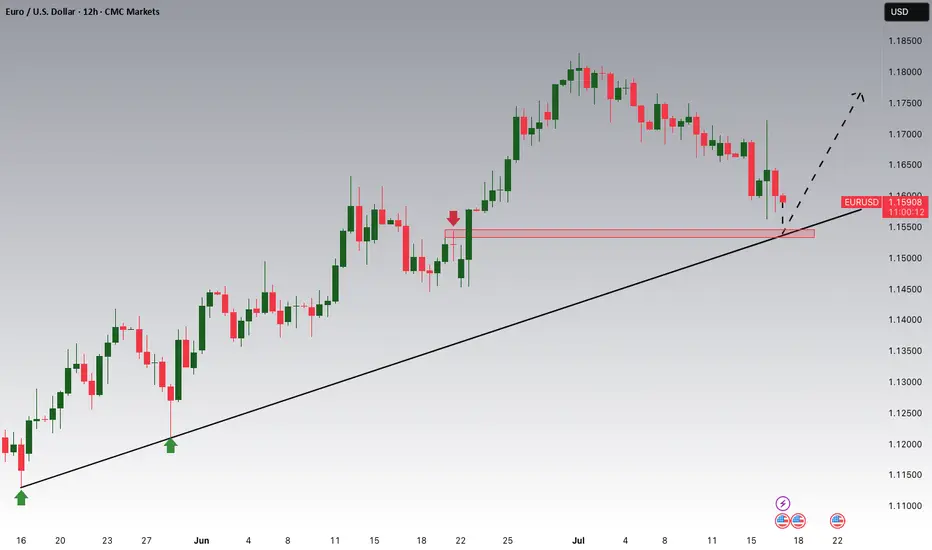
EURUSD is Nearing an Important Support!!Hey Traders, in today's trading session we are monitoring EURUSD for a buying opportunity around 1.15400 zone, EURUSD is trading in an uptrend and currently is in a correction phase is in a correction phase in which it is approaching the trend at 1.15400 support and resistance area.
Trade safe, Joe.