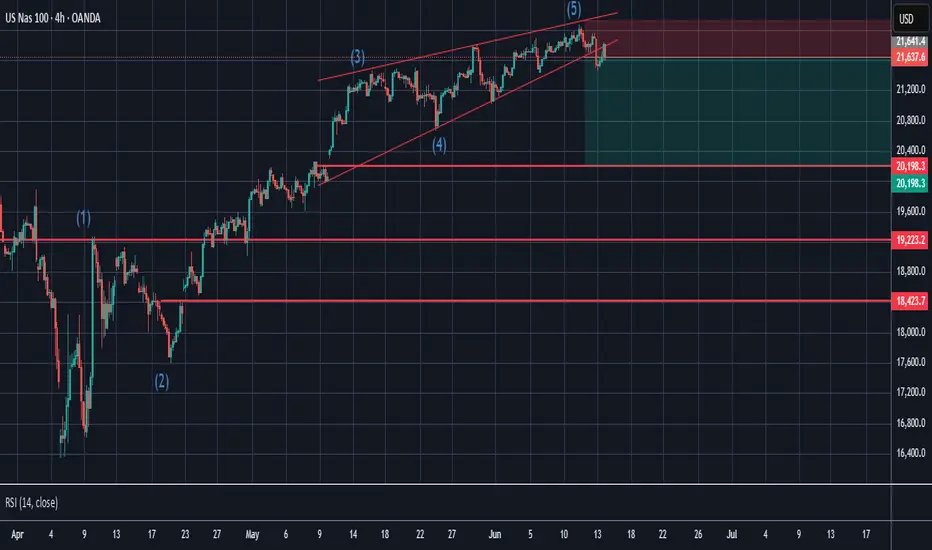
NAS100I think its time to sell, Ive held this analysis for a while now and its still in play, currently on Daily TF we also have RSI Divergence confirmation along the pinned candle.
Elliott Wave
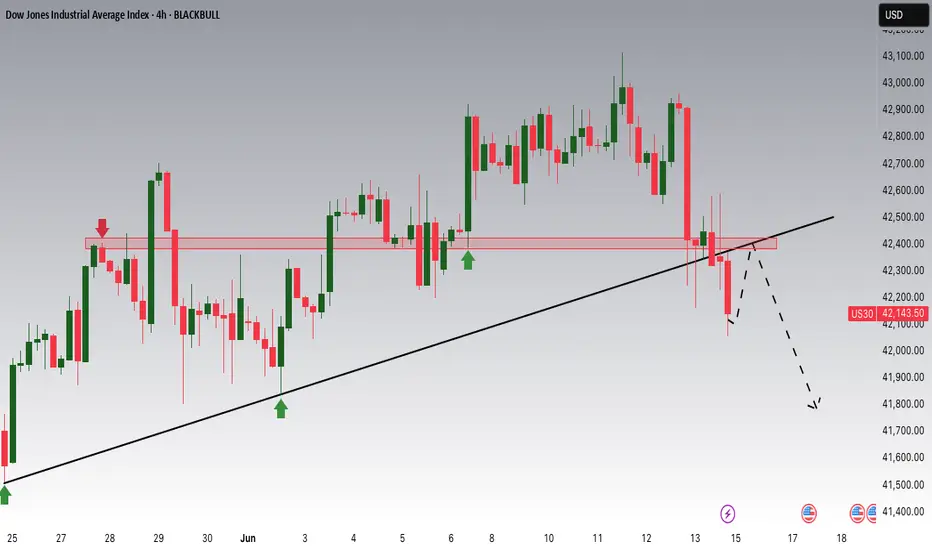
Dow Jones Breakout and Potential RetraceHey Traders, in the coming week we are monitoring US30 for a selling opportunity around 42,400 zone, Dow Jones was trading in an uptrend and successfully managed to break it out. Currently is in a corerction phase in which it is approaching the retrace area at 42,400 support and resistance area.
Trade safe, Joe.
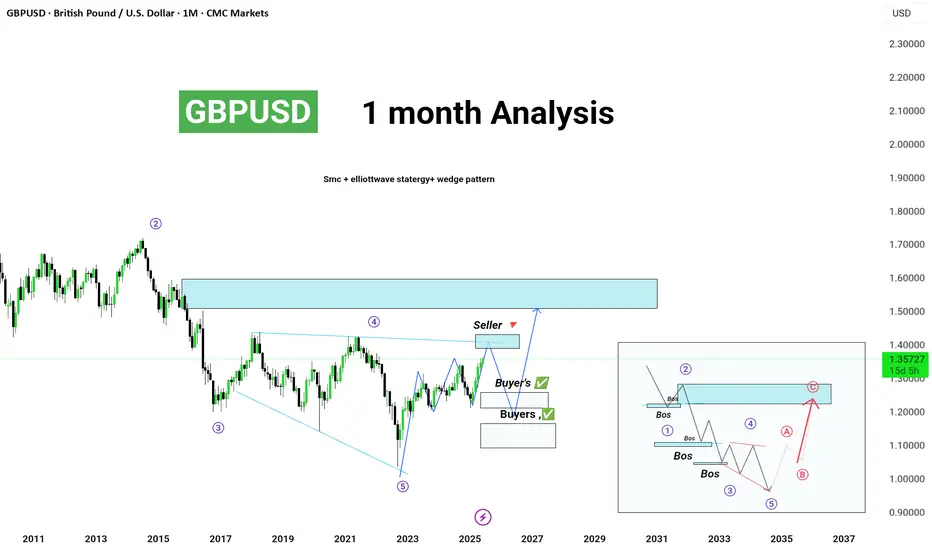
GBPUSD – 1 Month Analysis (Long-Term Outlook)Strategy Used:
✔ Smart Money Concept (SMC)
✔ Elliott Wave Theory
✔ Wedge Pattern Breakout
---
🔍 Chart Overview:
The pair has completed a classic falling wedge pattern, hinting at a potential long-term bullish reversal.
Wave 5 completion suggests the start of a new cycle or correction (ABC).
Currently in a buyer-dominated zone, with momentum pushing towards the key supply area (seller zone) marked in blue.
A breakout above this zone could indicate continuation toward major highs, while rejection might trigger Wave C or a deeper corrective structure.
---
💡 Key Levels:
Immediate Support Zones:
1.2550 - 1.2700 (Buyer's Checkpoint)
1.2000 - 1.2200 (Deeper Buyer Interest)
Major Resistance / Supply Zone:
1.5500 - 1.6000
---
🧠 SMC Perspective:
Break of Structure (BoS) confirms bullish intent in multiple zones.
Expecting reaction from premium zone – either for continuation or smart money reversal.
---
🌀 Elliott Wave Outlook (Box Inset):
Current wave structure hints at a completed 5-wave impulsive decline.
Now in early stages of ABC correction.
Targeting Wave C to reach the major supply zone in the long-term.
---
📌 Summary:
A macro bullish opportunity is unfolding after years of consolidation and impulse decline. Keep eyes on higher timeframe confirmations and reactions at key zones. This chart aligns well with institutional footprints and macro price action logic.
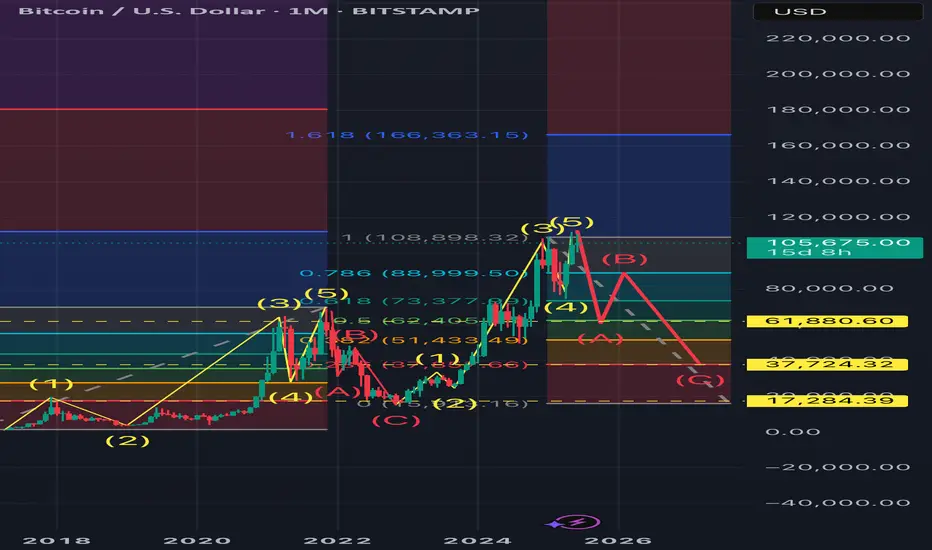
BITCOIN TOPPED. ELLIOT WAVE LONG Long term outlook of Bitcoin using EWT. I personally think Bitcoin has topped and the btc.d charts support it as well as the actual chart shown here. We’re beggining the massive correction as it did way back and I kept the ratios the same so after wave C next year or whenever, we can all buy btc at around 30k and ride the next waves up.
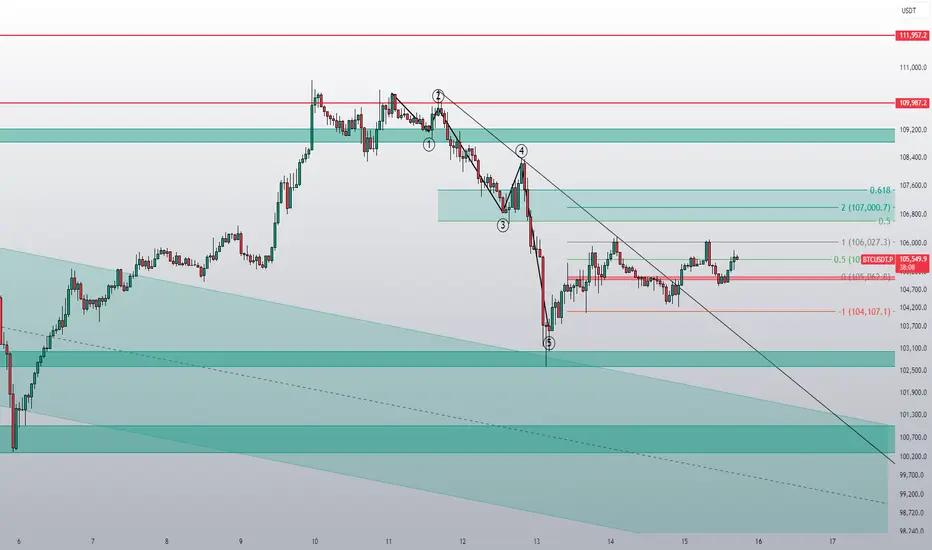
Reversal?I have to make a correction to my previous publication. Five waves had already been completed. This potential reversal therefore makes perfect sense at this point.
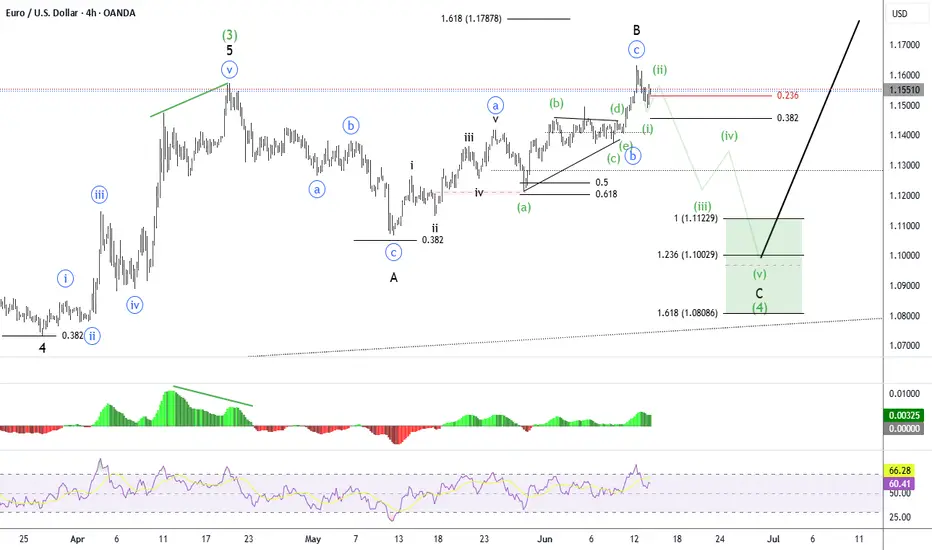
EUR/USD Elliott Wave Outlook – Expanded Flat Playing Out?EUR/USD appears to be unfolding a classic expanded flat correction for wave (4):
Wave A formed as a 3-wave zigzag
Wave B retraced beyond the start of A — a key trait of expanded flats
Now looking for a 5-wave C-leg decline toward the 1.1122 – 1.1002 area
Aligned with 1.0–1.618 extensions of A
RSI + MACD divergence adds bearish confirmation at the B top
Potential bullish reversal zone into late June / early July
As long as price holds below the B high (~1.1650), the bearish path in wave C remains in play.
📍 Target zone: 1.1122–1.1002
📈 Bias: Bearish short-term, bullish long-term (wave 5 up next)
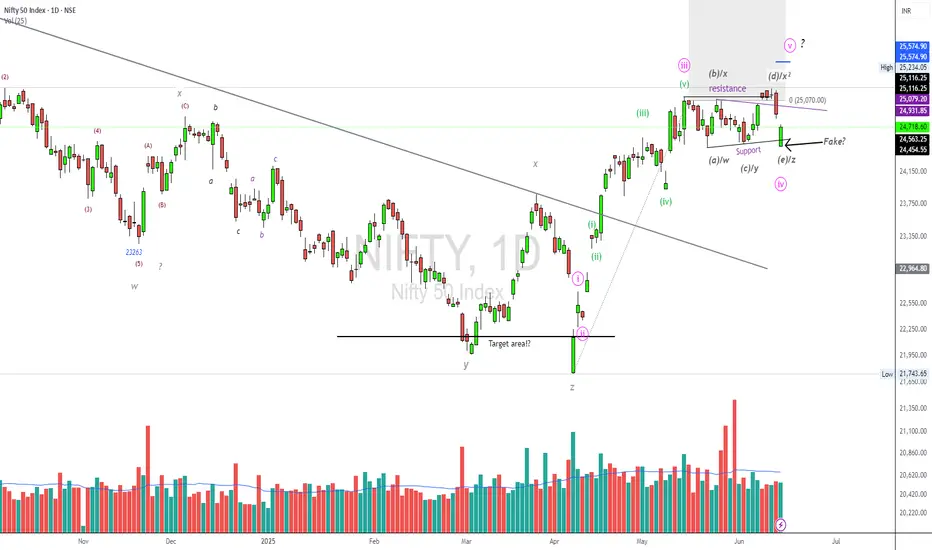
NIFTY50.....Don't loose your panic!Hello Traders,
the NIFTY50 is trading within a range of 25116 to 24462 point range. This range began on May 15th and is ongoing 'til this week!
I have labelled this move as a wave 4!
Chart analysis:
If so to come, the next move should reach targets of roughly, 25574.90! Here, a wave 5 could end, or this was all of wave 1 of 5!
If the move is a wave 1 of 5, the targets are much higher for the coming 2-3 weeks ahead!
When it was all of wave 5 the next move would be a correction to the levels of 0.5 to 0.618 of the Fibo-retracements!
In any case, the advance is not over yet, and should last for a considerable amount of time!
If the index will exceed the former ATH @ 26277 points, here the risk is ascending for an end of an impulse!
But, step by step!
Due to the conflict between Israel and Iran, I recommend to step aside and wait for calm down the dispute in the coming days! Hopefully!
This conflict has the potential to set the region on fire!
In case of an escalation of this conflict, the risk would be really hard to forecast, but I guess the potential for a formidable crash is given!
Protect your tradingaccounts with suitable products to prevent the situation from escalating (sell calls, for example)!
I don't want to hear about anyone losing their entire trading account!
Have a great week.....
Ruebennase
Please ask or comment as appropriate.
Trade on this analysis at your own risk.
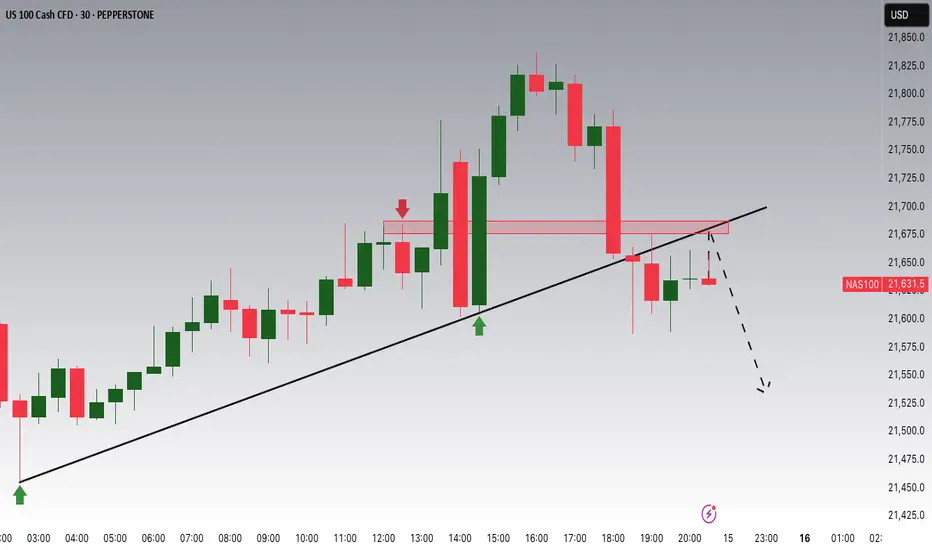
NASDAQ Breakout and Potential RetraceHey Traders, in tomorrow's trading session we are monitoring NAS100 for a selling opportunity around 21,700 zone, NASDAQ was trading in an uptrend and successfully managed to break it out. Currently is in a correction phase in which it is approaching the retrace area at 21,700 support and resistance zone.
Trade safe, Joe.
BABA Stock: A Detailed Analysis using Elliott Wave Theory RulesHello Friends,
Welcome to RK_Chaarts,
Let's analyze Ali Baba Group Holdings Limited, also known as BABA, listed on the NYSE. We'll be using the Elliott Waves theory.
Friends, as we can clearly see, after hitting a low of around $95.75 on 9th April 2025, it started an impulse wave. Within this wave, we've completed intermediate degree blue bracketed (1), (2), (3), (4), (5), and primary degree ((1)) in Black. Currently, we're completing primary degree ((2)), with a low around $111.
If it breaks the level of $111, we'll assume we're still in primary degree ((2)), as marked in scenario 2 on the chart. This means wave ((2)) is unfolding, and wave ((3)) might start after wave ((2)) is complete.
If it doesn't break the $111 level, it's likely that wave ((2)) has completed, and we've started a subdivision of wave ((3)) or its further subdivisions. If it moves further up, following scenario 1 (the black line on the chart), this is a possibility.
According to Elliott Wave theory, wave ((2)) cannot retrace more than 100% of wave ((1)). So, our main invalidation level for this count is $95.75. Yes, BABA is turning up against the 95.75 low, and in the near term, we expect the stock to trade higher.
Somewhere, this stock might move towards $150 or $160 if it doesn't break down below $ 95.75.
I am not Sebi registered analyst.
My studies are for educational purpose only.
Please Consult your financial advisor before trading or investing.
I am not responsible for any kinds of your profits and your losses.
Most investors treat trading as a hobby because they have a full-time job doing something else.
However, If you treat trading like a business, it will pay you like a business.
If you treat like a hobby, hobbies don't pay, they cost you...!
Hope this post is helpful to community
Thanks
RK💕
Disclaimer and Risk Warning.
The analysis and discussion provided on in.tradingview.com is intended for educational purposes only and should not be relied upon for trading decisions. RK_Chaarts is not an investment adviser and the information provided here should not be taken as professional investment advice. Before buying or selling any investments, securities, or precious metals, it is recommended that you conduct your own due diligence. RK_Chaarts does not share in your profits and will not take responsibility for any losses you may incur. So Please Consult your financial advisor before trading or investing.

FARTCOIN | Dream scenarioTextbook ABC correction into the $0.83–0.75 zone.
Will the fartcoin gods let us bid sub $1 again? Odds are low, but man can dream.
If filled, expecting a big wave up — ultimate R/R.
Main risk: market front-runs and never fills — be nimble, ladder bids if you're serious.
"If you get the dream fill, don't fumble the bag."

One more drop?I assume the correction is not quite over yet. One more drop for BTC would make perfect sense.

Bitcoin could drop to 95KHi traders,
Last week Bitcoin followed my outlook exactly.
Price went up a little higher to finish wave B (grey) and after that it started the next wave down.
Now we could see a small correction up and after that down again.
Let's see what the market does and react.
Trade idea: Wait for the correction up to finish to trade shorts.
If you want to learn more about trading FVG's with wave analysis, please make sure to follow me.
This shared post is only my point of view on what could be the next move in this pair based on my analysis.
Don't be emotional, just trade your plan!
Eduwave
Gold is on a riseHi traders,
Last week gold went exactly as I've said in my previous outlook.
After price came into the bullish 4H FVG it started the next impulse wave 3 (purple) up.
So next week we could see a small correcton down and more upside.
Let's see what price does and react.
Trade idea: Wait for a small correction down on a lower timeframe to finish and trade longs again.
If you want to learn more about trading FVG's & liquidity sweeps with wave analysis, please make sure to follow me.
This shared post is only my point of view on what could be the next move in this pair based on my technical analysis.
Don't be emotional, just trade your plan!
Eduwave

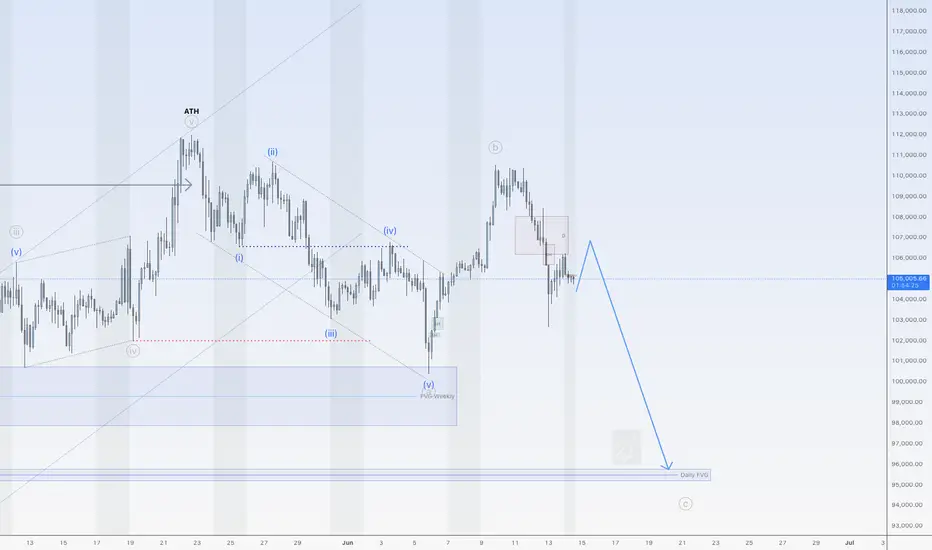
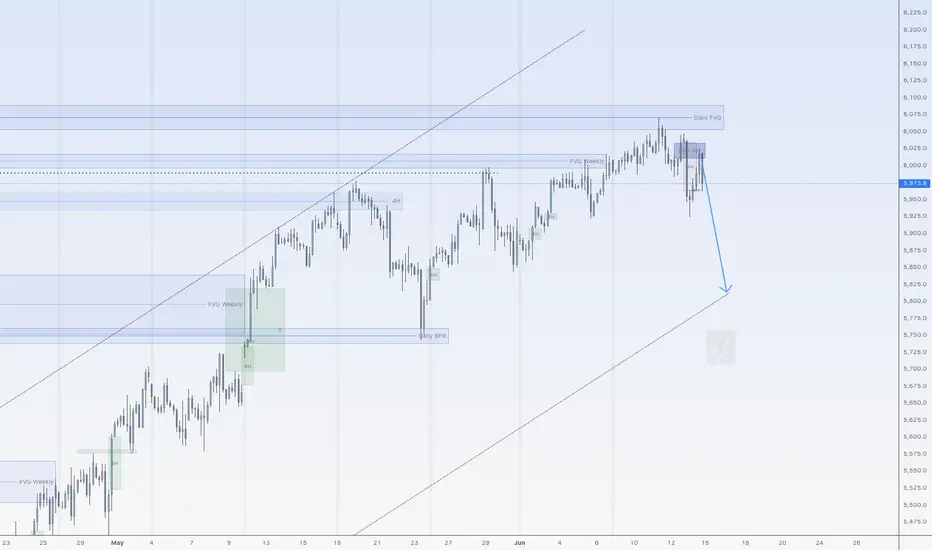
Down for SPX500USDHi traders,
SPX500USD went exactly to the target of my previous outlook.
After price came into the Daily FVG it rejected from there and started the correction down.
So next week we could see more downside for this pair to finish a bigger correction down.
Let's see what the market does and react.
Trade idea: Wait for a small correction up on a lower timeframe to trade short term shorts to the previous Weekly low.
If you want to learn more about trading FVG's & liquidity sweeps with Wave analysis, then please make sure to follow me.
This shared post is only my point of view on what could be the next move in this pair based on my technical analysis.
Don't be emotional, just trade your plan!
Eduwave
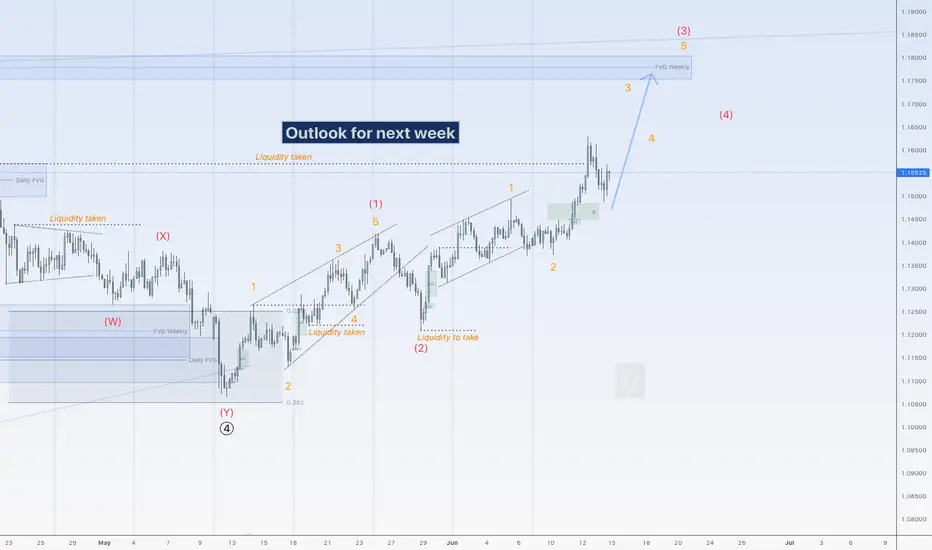
More upside for EUHi traders,
Last week EU made a small correction to the downside but after that it went up again.
This could be wave 3 (red).
So if this is true, next week we could see more upside to finish wave 3 into the Weekly FVG.
Let's see what the market does and react.
Trade idea: Wait for the finish of a small correction down on a lower time frame to trade longs.
If you want to learn more about trading with FVG's, liquidity sweeps and Wave analysis, then make sure to follow me.
This shared post is only my point of view on what could be the next move in this pair based on my technical analysis.
Don't be emotional, just trade your plan!
Eduwave
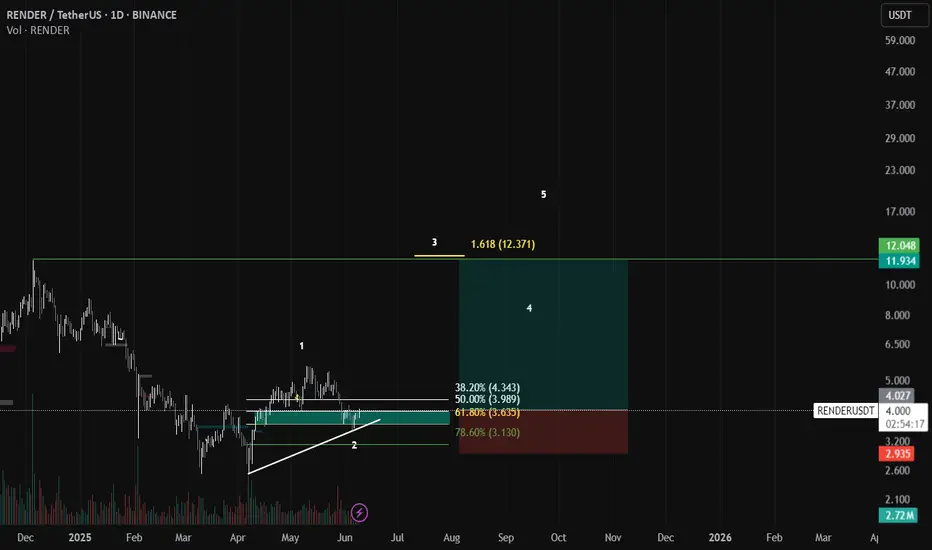
Render Trade plan RNDR/USDT – Wave 3 Setup in Progress 🚀
This is an Elliott Wave-based setup on the 1D chart for RENDER. Wave 1 and Wave 2 appear to be completed, with Wave 3 yet to unfold. Price is currently sitting near the 50%–61.8% Fibonacci retracement zone ($3.98–$3.63), which is a typical launchpad area for a strong impulsive Wave 3 move.
📉 Wave Structure:
✅ Wave 1: Complete
✅ Wave 2: Retested key Fib zone
🔜 Wave 3: Expected to extend towards the 1.618 Fib extension at $12.37
🎯 Entry Zone: $3.98–$4.00
🛑 Invalidation: Below $3.13 (78.6% retracement)
🚀 Wave 3 Target: ~$12+
This setup offers a favorable risk-to-reward ratio with clear invalidation. Watching closely for bullish confirmation.
#RNDR #ElliottWave #CryptoAnalysis #RenderToken #AltcoinSeason
Ai16z Trade plan updatedbefore my previous update on this coin that the wave is unfolding so after the recent decline we have retested the .618 golden fib traders can start to accumulate again at this stage for the upcoming wave 3 which will be explosive. I Know alot of u are sacred rn due to market uncertainty but I tell u the wave 2 is always a tricky wave to have it will test u deep that u will sell at loss
the sl and tp are given in the chart

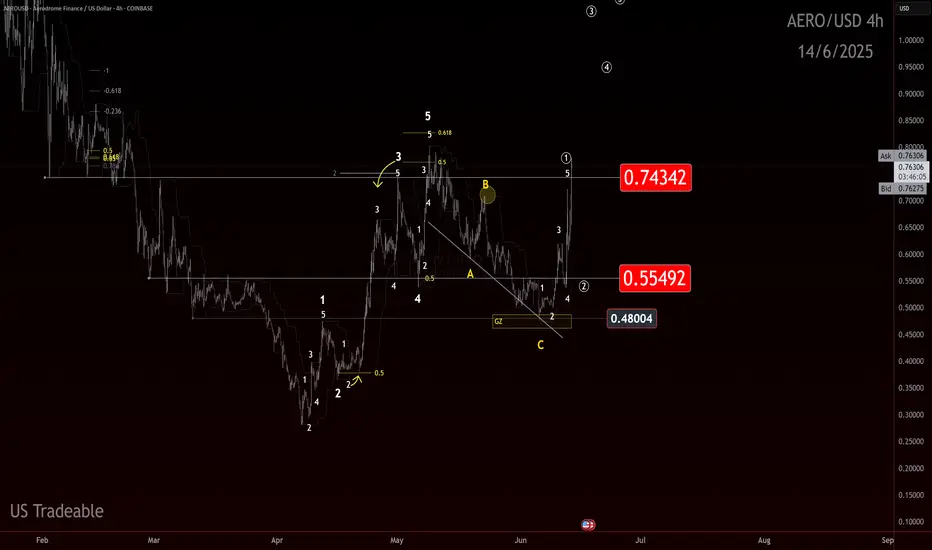
AERO: Take Off!?If you find this information inspiring/helpful, please consider a boost and follow! Any questions or comments, please leave a comment!
Long Entry at $0.515
Recap
SPARKS:AERO caught a bid after Coinbase news hit, but world events quickly clipped the rally’s wings. Price bounced cleanly off the .48 level, which aligned with an Area of Interest (AOI), a Level of Interest (LOI), and a golden zone retracement displayed in the last analysis.
Explanation
The .48 level was key and the reaction was textbook. The Coinbase news provided a catalyst just as price reached the .55 level. However, macro uncertainty remains a headwind.
Now, all eyes are back on .55. Bulls need to defend this structural level. The current pierce of .75 is an encouraging move. Continuation and a proper flip of that level would keep confidence high. Wave 3s are a sight to see, so a retrace may not even occur if price simply sends. Still, while AERO stood up and moved counter to the broader market when world news dropped, that alone may not be enough if global bearish reactions continue.
Outlook
Entry projected in the previous analysis has played out in ideal fashion, but the market remains fluid. Key levels:
.75 recent break
.55 ideal hold
.48 impulse invalidation
Current trend at the lesser degree is up and holding higher lows. Next objective: take out the .80 pivot and change the trend at the higher degree.
Break of the higher lows at the lesser degree would be the first sign of weakness. I’m watching for a definitive correction for a potential long add. A swift move that breaks higher lows could signal danger to bulls.
Trade Safe!
Trade Clarity!
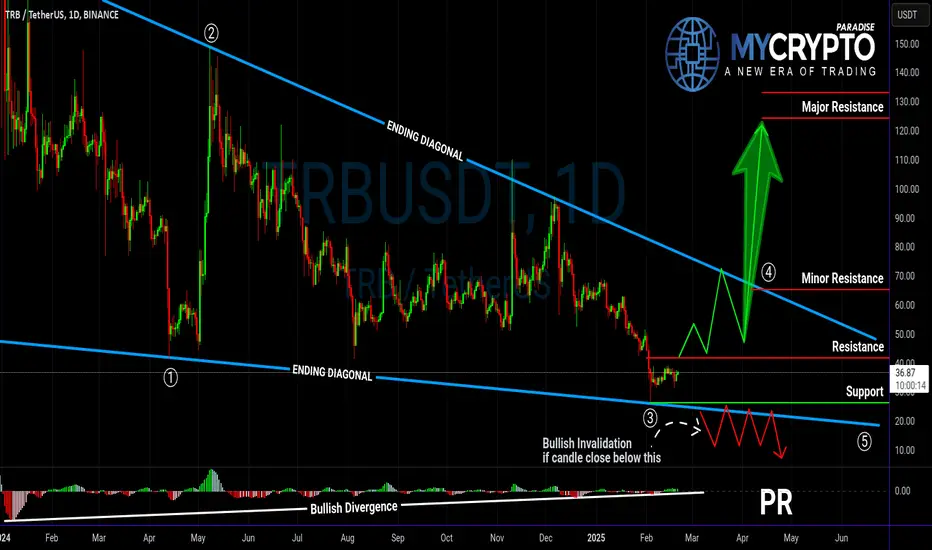
TRBUSDT on the Verge of a Major Move – Breakout or Breakdown?Yello, Paradisers! Is TRBUSDT gearing up for a bullish breakout, or is a deeper retracement coming? Let’s break it down.
💎TRBUSDT is forming an ending diagonal while showing bullish divergence, increasing the probability of an upward move. But for this bullish scenario to play out, we need confirmation.
💎If TRBUSDT breaks out and closes candle above the resistance level, the probability of a bullish move strengthens, setting up a potential wave 4.
💎However, if the price retraces further, we could still see a bounce, but given the broader market conditions, this would be a low-probability setup.
💎On the flip side, a breakdown and candle close below support would invalidate the bullish outlook, signaling that it’s safer to wait for a better price action structure before taking any positions.
🎖Remember, patience and disciplined execution are what separate winners from the rest. Stay sharp, Paradisers, and don’t let emotions dictate your trades!
MyCryptoParadise
iFeel the success🌴
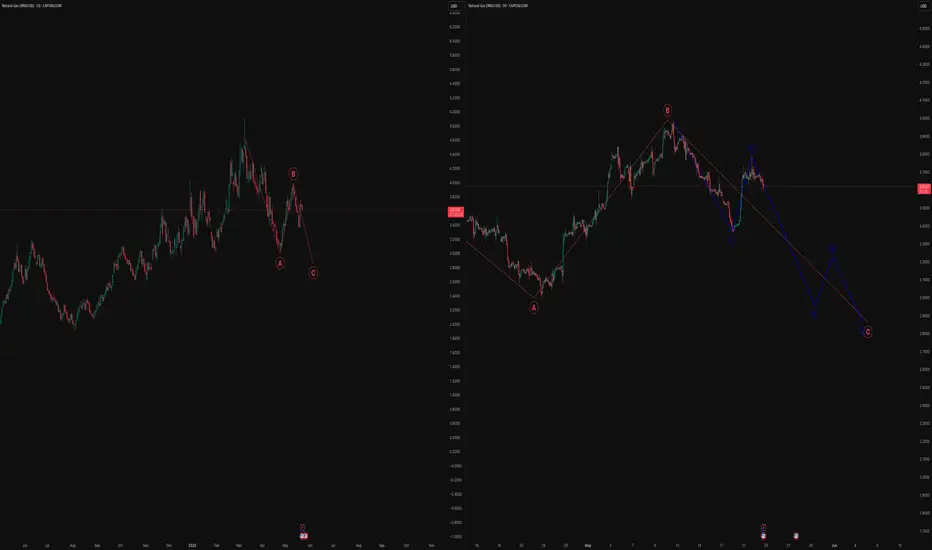
Technical Analysis Summary - NG🔍 Technical Analysis Summary – Natural Gas (NG1!)
📉 Left Chart (Daily Timeframe – ABC Correction):
Market structure shows a clear ABC corrective pattern forming.
Wave A completed with a sharp down move.
Wave B retracement is also complete.
Now initiating Wave C, projecting a downside target near $2.90–$3.00.
The structure indicates a correction within a larger downtrend continuation.
📊 Right Chart (90-Minute Timeframe – Elliott Impulse):
The chart breaks down Wave C into an impulsive 5-wave structure:
Wave I: Down move from ~$3.90 to ~$3.45.
Wave II: Pullback (currently ending).
Wave III, IV, V: Projected further downside.
Final target: $2.85–$2.90 region.
Multiple EMAs (34, 62, 89, 144) show bearish alignment — resistance in recent pullback.
Price action is below all EMAs, confirming bearish trend continuation.
📌 Conclusion:
Natural Gas is likely entering Wave C of a larger ABC correction.
Expect further downside with potential targets:
Short-term: $3.10
Mid-term: $2.85–$2.90
Trend remains bearish unless price reclaims above the EMA cluster (~$3.65–$3.80).
⚠️ Disclaimer:
This analysis is for educational purposes only. It is not financial advice. Please consult your financial advisor before making any trading decisions.
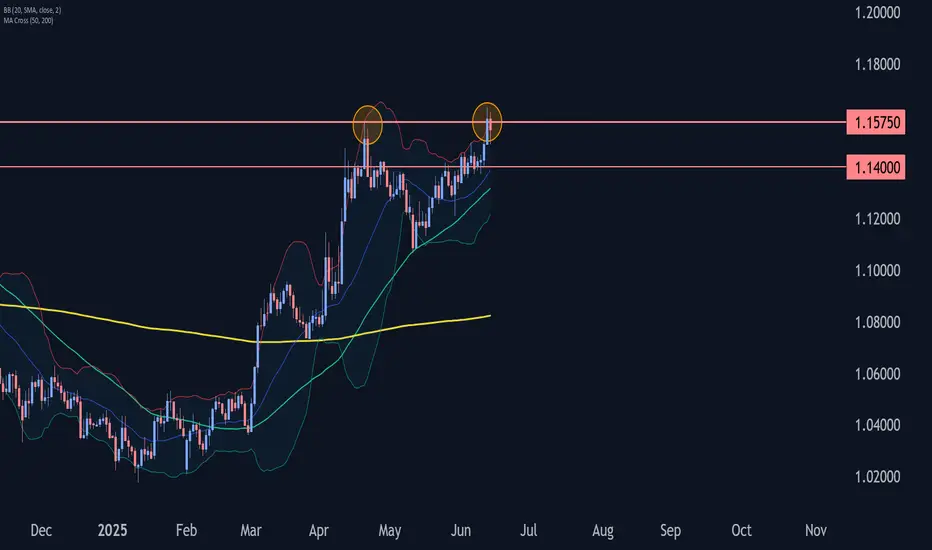
EURUSD Wave Analysis – 13 June 2025- EURUSD reversed from the resistance level 1.1575
- Likely to fall to support level 1.1400
EURUSD currency pair recently reversed down from the resistance level 1.1575, which stopped the previous sharp impulse wave (1) in the middle of April.
The resistance zone near the resistance level 1.1575 was strengthened by the upper daily Bollinger Band.
EURUSD currency pair can be expected to fall to the next support level 1.1400 (which stopped the previous correction ii).
SOL (Weekly timeframe): Trend structure Price is approaching a key macro support zone. However, as long as it remains below the $148 level, I cannot rule out the possibility of one more corrective leg toward the $76–$55 range before a medium-term bottom is established and a potential resumption of the broader uptrend begins.
A breakout and sustained close above the $148 level would serve as the first technical signal that either:
- a corrective wave B (preceding a deeper correction toward the macro support zone) is unfolding, or
- a new long-term bullish trend aiming for all-time highs is beginning.
Monthly outlook:
My previous idea from November 2024 has fully realized its structure:
Thanks for reading and wishing you successful trading and investing decision!

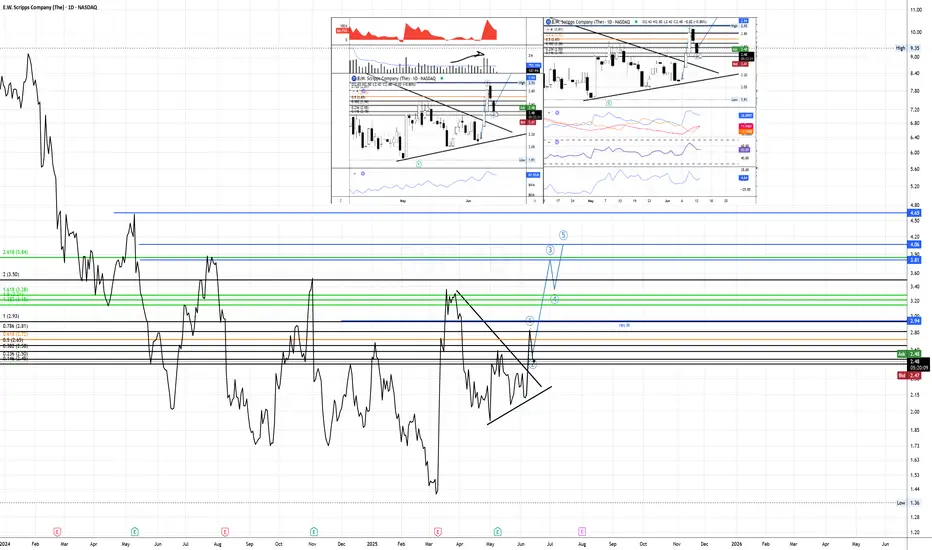
$SSP Low volume on Wave 2, momentum risingFirstly, on the line chart is possible to watch the possible targets - blue lines - which one of it is almost as the same level as 2,618.
Fibonacci measured from the breakout to monthly resistance.
res M = monthly resistance
During the Wave 2, the two candles from last two days showed low volume as usual to happen during formation of W2, and it is possible to see that price at the breakout and after it was above average which can be read as high interest from buyers.
Confirming the volume, the EFI even though is decreasing still show strength,OBV follow the price trend but looks like buyers are entering again.
When it comes to momentum is possible to see that RSI did not crossed the equilibrium even after two bearish days, as ROC being a leading indicator which already changed direction . ADX is showing some strength for the trend direction confirmed by as DMI+ is still above DMI-
DTC = 1,36