Bitcoin Short: Video Walkthrough on 4th and 5th waveOver in this video, I explained the bitcoin short by explaining the wave 4 structure and how I set the stop losses and take profit target using resistance level and previous waves and Fibonacci extension levels.
I also talk about how I will trade this setup by scaling in.
Elliott Wave

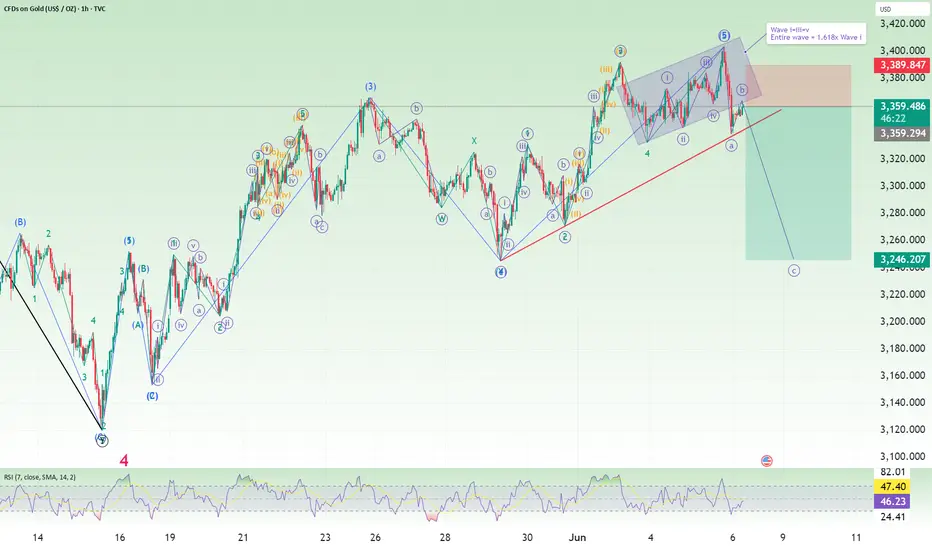
Gold Short: Wave C of 2Gold has completed a 5-wave structure. This big structure should be a wave 1 of cycle wave 5. Now we should be on wave B and going into Wave C of Wave 2 of cycle Wave 5.
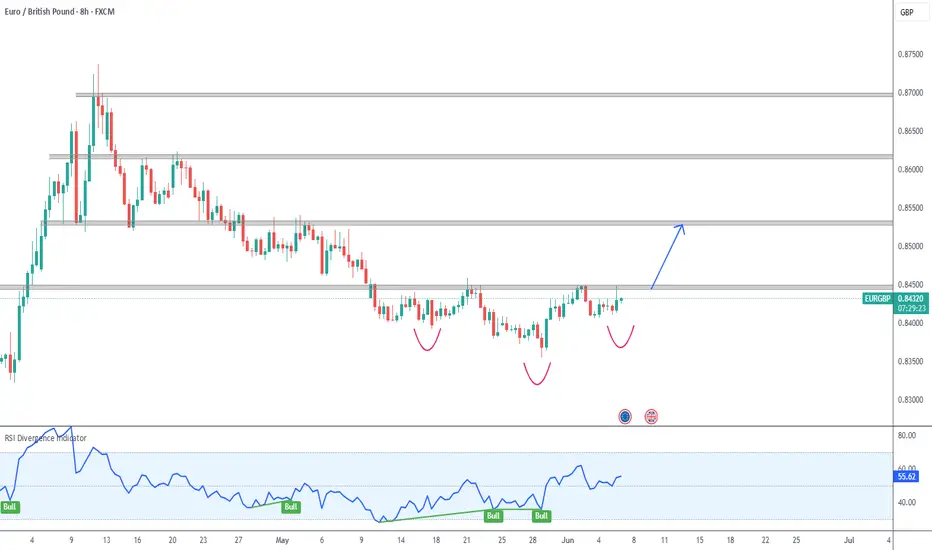
EURGBP Potential H&SI´m following a potential reversal for EURGBP as a Head and Shoulders pattern.
Neckline break at 0.845 would take us to the next strong resistance level at 0.853.
Bullish RSI divergence is supportive of this scenario.
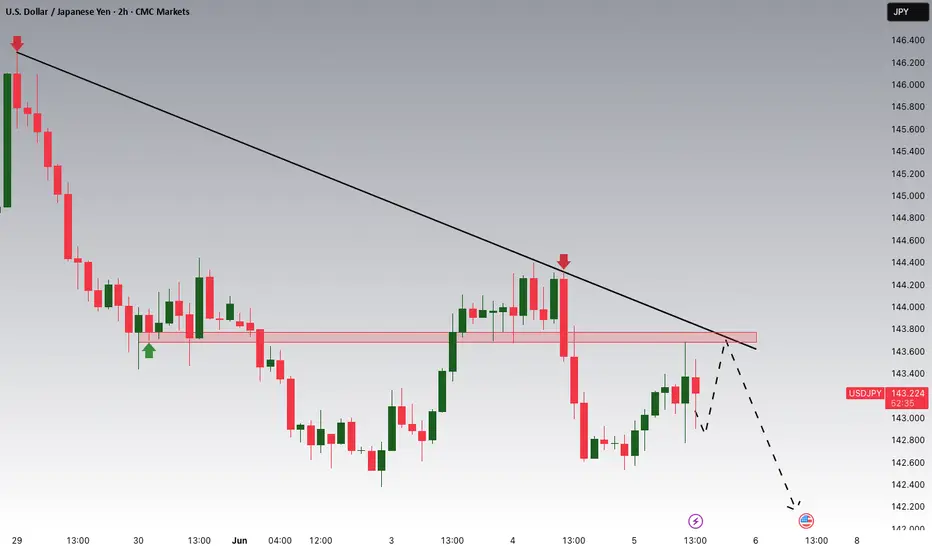
USDJPY is Nearing an Important ResistanceHey Traders, in today's trading session we are monitoring USDJPY for a selling opportunity around 143.700 zone, USDJPY is trading in a downtrend and currently is in a correction phase in which it is approaching the trend at 143.700 support and resistance area.
Trade safe, Joe.
Bitcoin is looking great so far!Once the potential Wave 2 correction is over, we can enter a potential Wave 3 on the daily timeframe, reaching at least 140k before the next "major" correction.

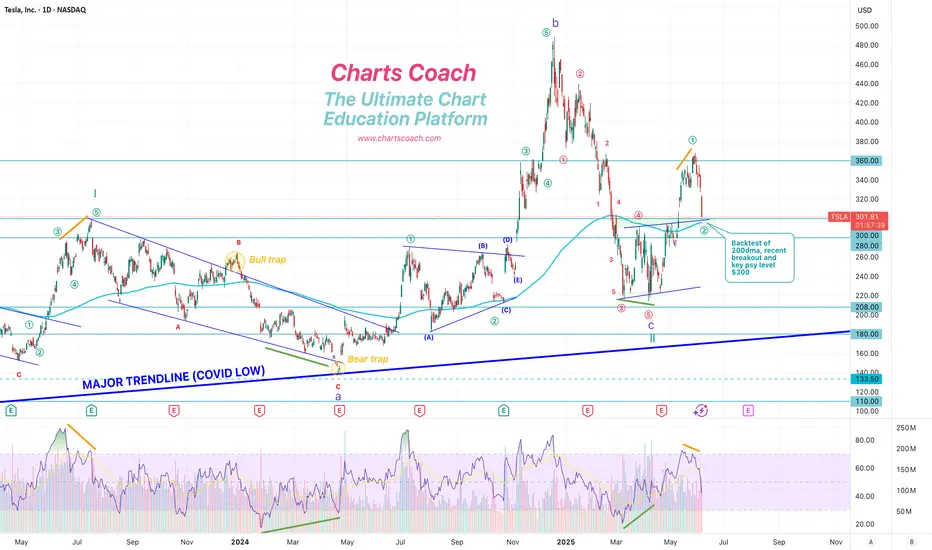
TSLA Backtest: A robo-taxi launchpad? TBD ... 𝗧𝗲𝘀𝗹𝗮 𝗕𝗮𝗰𝗸𝘁𝗲𝘀𝘁: A robo-taxi launchpad? 🤖🚗
After a 20%+ breakout, NASDAQ:TSLA is retesting its 200dma with $295–300 now key support. Hold that — and bulls have room to run to $400+.
𝘉𝘶𝘭𝘭𝘪𝘴𝘩 𝘴𝘦𝘵𝘶𝘱 𝘸𝘪𝘵𝘩 𝘢 𝘥𝘢𝘵𝘦: June 12 robo-taxi reveal in Austin could mark Tesla’s first real step toward autonomous ride-hailing at scale.
𝘏𝘪𝘨𝘩 𝘱𝘳𝘪𝘤𝘦, 𝘩𝘪𝘨𝘩 𝘩𝘰𝘱𝘦𝘴: Tesla's valuation has always priced in the future. This time, the future might show up in a self-driving Model Y.
$NQ_F NASDAQ:NDX NASDAQ:QQQ NASDAQ:NVDA NASDAQ:AAPL AMEX:SPY NASDAQ:SOX CBOE:ARKK #Tesla #Robotaxi #FSD #ElonMusk #Stocks
Elliot Waves on the daily timeframeWave 5 should wrap up by tomorrow, and BTC should be set to hit new highs.

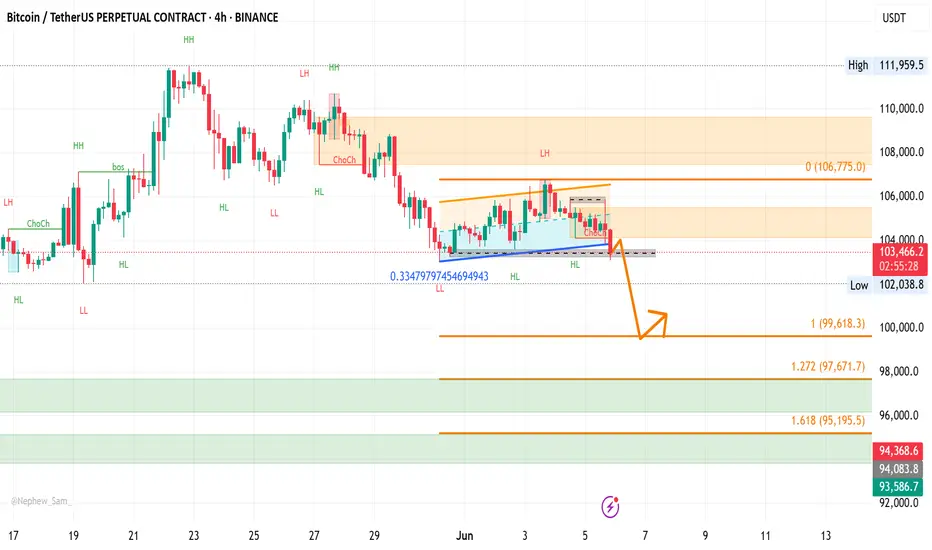
BTCUSD Analysis – Bearish Elliott Wave Structure UnfoldingAfter BTC recently made a high around 111,959, we observed a clear impulsive bearish move followed by minor pullbacks.
The current market price stands at 103,396, and based on the structure, it appears that BTC is unfolding a bearish Elliott Wave pattern. If this holds, we could be in the midst of Wave 3, which typically shows strong momentum and continuation.
Key downside levels to watch:
99,620
97,670 – This level also aligns with a bullish breaker on the 4H chart, making it a potential area of interest for buyers.
Strategy:
My current approach is to sell on pullback, targeting the formation of lower highs and aiming for a break below the recent lower lows.
XAUUSD (GOLD)XAUUSD Technical Analysis – 1H Timeframe
According to the Elliott Wave structure, wave 5 appears to have completed, and price is now entering a corrective phase. The break of the rising trendline and resistance zone signals the possibility of a new downward move. Key support levels lie around 3299 and then 3165 USD

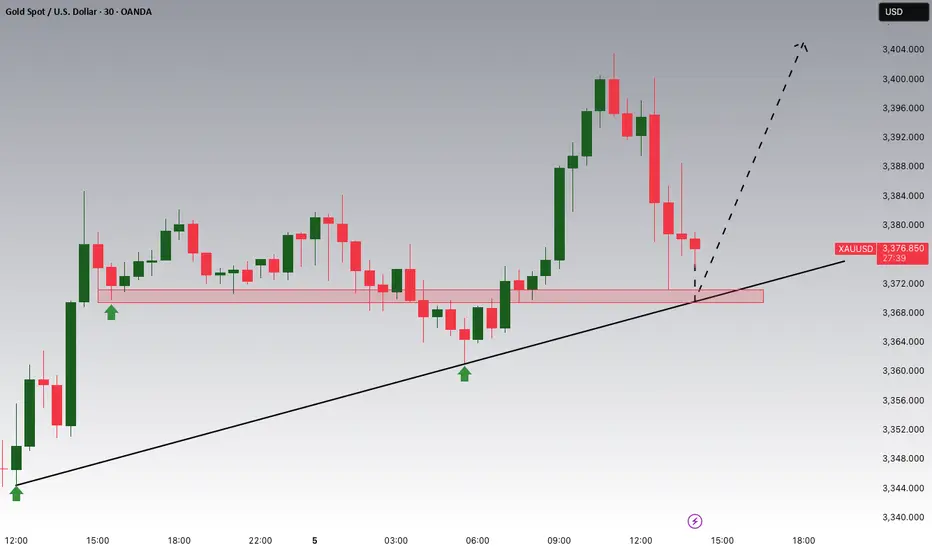
Gold Potential UpsidesHey Traders, in today's trading session we are monitoring XAUUSD for a buying opportunity around 3,370 zone, Gold is trading in an uptrend and currently is in a correction phase in which it is approaching the trend at 3,370 support and resistance area.
Trade safe, Joe.
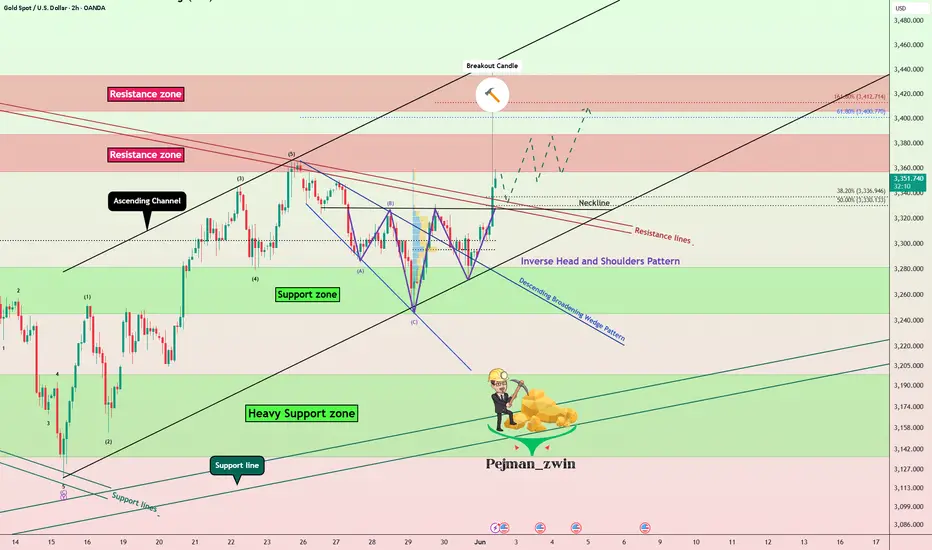
Gold= Breaks Resistance by Bullish Patterns + Geopolitical BoostGold ( OANDA:XAUUSD ) touched $3,337 as I expected in my previous idea .
Gold has now managed to break the Resistance lines and is trying to break the Resistance zone($3,387-$3,357) .
From a Classic Technical Analysis perspective, two Bullish Reversal Patterns are clearly visible on the Gold chart :
Descending Broadening Wedge Pattern
Inverse Head and Shoulders Pattern
According to Elliott Wave theory , by breaking the Resistance zone($3,387-$3,357) , we can confirm the start of an impulsive wave .
Also, given the increasing tension between Ukraine and Russia in recent days, there is a possibility that the price of Gold will increase due to the increased tensions .
I expect Gold to start rising again after a pullback to the neckline and resistance lines , and after breaking the Resistance zone($3,387-$3,357) , to rise to the target I have indicated on the chart.
Note: If Gold touches $3,299 , we should expect further declines.
Note: There is a possibility of emotional movements in the chart today when Fed Chair Powell speaks.
Gold Analyze ( XAUUSD ), 2-hour time frame.
Be sure to follow the updated ideas.
Do not forget to put a Stop loss for your positions (For every position you want to open).
Please follow your strategy; this is just my idea, and I will gladly see your ideas in this post.
Please do not forget the ✅' like '✅ button 🙏😊 & Share it with your friends; thanks, and Trade safe.
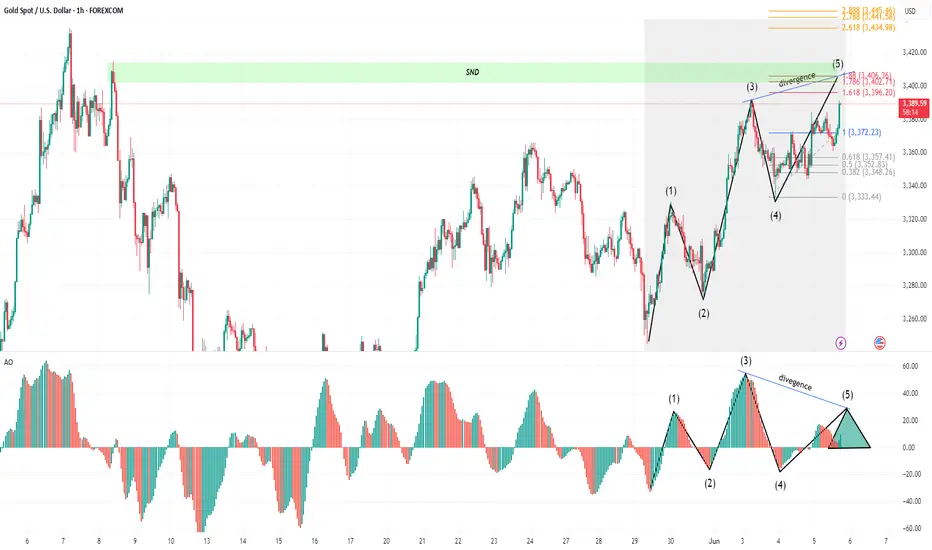
XAUUSD (Gold) – Bearish Setup in Play | H1 Wave Count + AO Dive🟡 XAUUSD (Gold) – Bearish Setup in Play | H1 Wave Count + AO Divergence 🟡
🗓️ Date: June 5, 2025
📉 Timeframe: 1H
🔍 Elliott Wave Count:
The current structure appears to have completed a classic 5-wave impulse.
Wave (5) has just printed, and notably, Awesome Oscillator (AO) confirms a divergence:
Wave 3 had a higher AO peak than Wave 5, signaling bearish momentum loss.
This divergence is a strong reversal signal, often preceding a corrective move (ABC).
📊 Technical Confluence:
Price is now entering a key Supply and Demand (SND) zone between 3401 – 3414, an area that previously caused a strong rejection.
Multiple Fibonacci extensions also cluster near this level:
1.618 and 2.618 extensions align closely with current highs.
These confluences further strengthen the sell bias.
📉 Trade Idea:
🎯 Bias: Bearish
📍 Entry Zone: Around 3401 – 3414
❗ Confirmation: Look for bearish engulfing candle or breakdown from rising wedge
🎯 First Target: 3372 (Fib 0.618 retracement of wave 4–5)
🎯 Second Target: 3357 or deeper if larger correction unfolds
❌ Invalidation: Break and close above 3418
🧠 AO Divergence Reminder:
Divergence between price and oscillator like AO (lower momentum on a higher high) often signals exhaustion of trend — perfect timing for contrarian plays at strong SND zones.
📌 Summary:
Wave (5) completion with AO divergence near a significant SND zone (3414–3401) sets the stage for a high-probability short trade. Monitor lower timeframes for entry triggers.
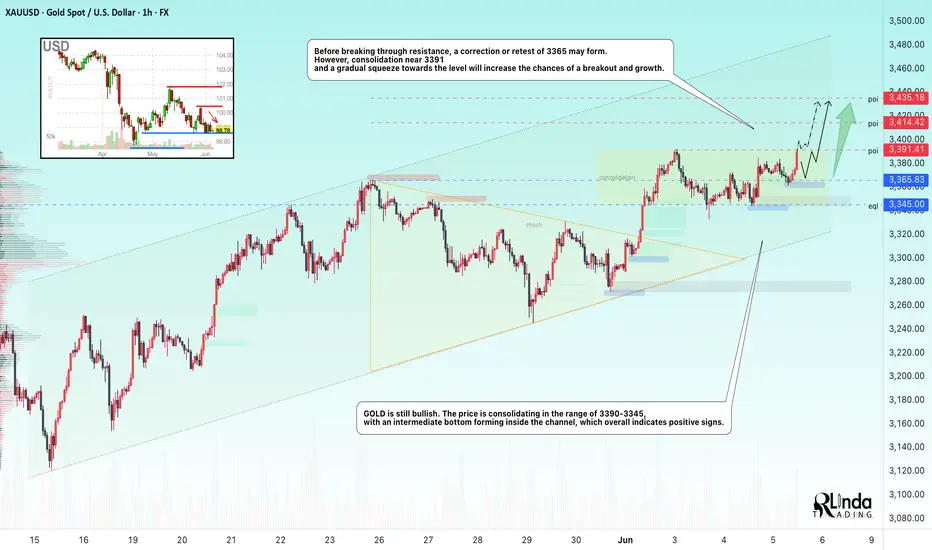
GOLD → Retesting resistance may lead to a breakoutFX:XAUUSD is still bullish. The price is consolidating in the range of 3390-3345, with an intermediate bottom forming inside the channel, which overall indicates positive signs.
On Thursday, gold is consolidating ahead of $3390. Consolidation after growth, within a bullish trend, is a good sign. But, on the one hand, the price is supported by growing tensions between Russia and Ukraine. On the other hand, optimism about US trade negotiations with Canada, the EU, and China is strengthening the dollar and holding back demand for gold.
Additional pressure on the dollar is coming from weak US macro statistics, especially ADP data and the decline in the ISM Services PMI, which have reinforced expectations of Fed policy easing. Traders are waiting for further signals from the regulator.
Resistance levels: 3391.4, 3414, 3435
Support levels: 3365, 3345
Technically, gold is rising and forming a retest of consolidation resistance. If the 3391 level is broken, the price may head towards 3435. Before breaking through resistance, a correction or retest of 3365 may form. However, consolidation near 3391 and a gradual squeeze towards the level will increase the chances of a breakout and growth.
Best regards, R. Linda!
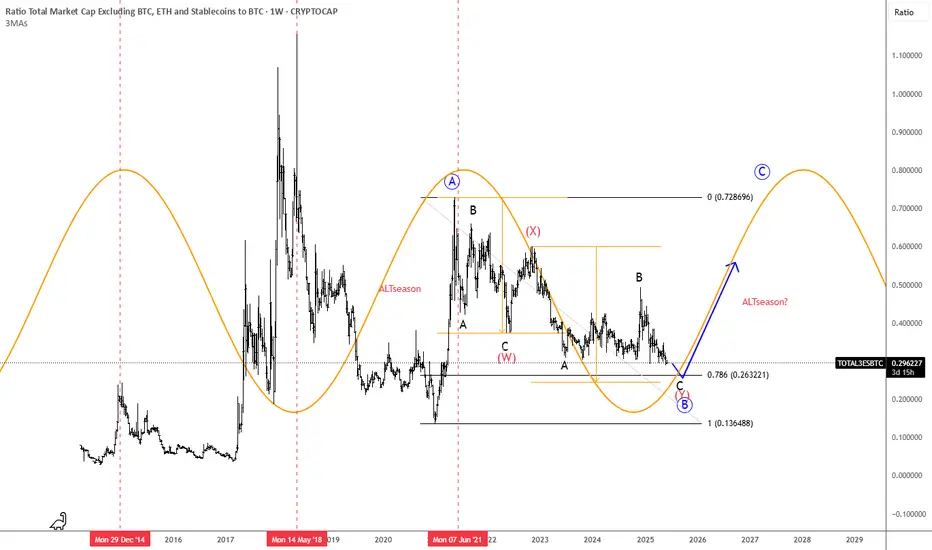
ALTseason May Show Up In 2025We found an interesting chart, which is showing us the ratio of TOTAL3(ALTcoins) market cap against Bitcoin with ticker TOTAL3ESBTC. Well, even this chart is showing that ALTcoins may start outperforming BTC soon. It can be finishing final subwave C of (Y) of a correction in blue wave B that can cause a new strong rally into wave C, which can bring the ALTseason similar as in the beginning 2021.
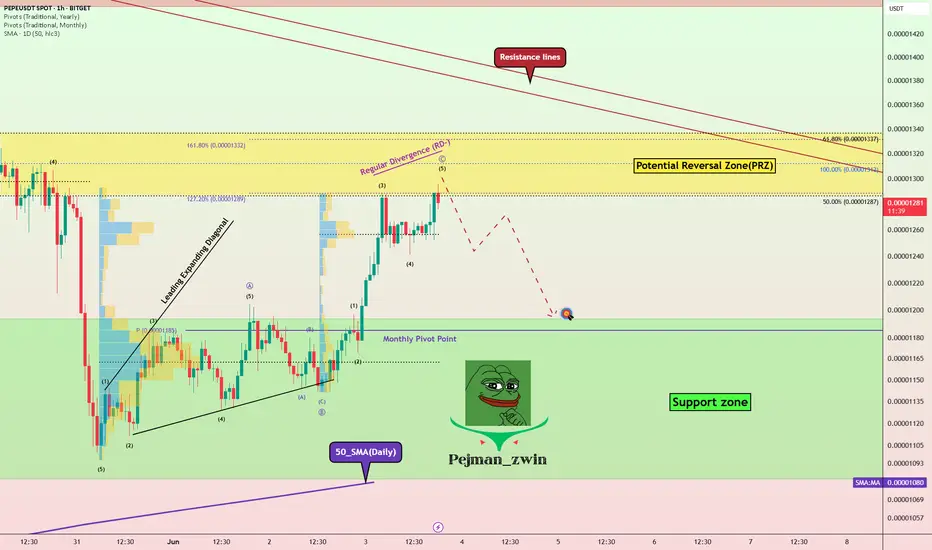
PEPE at Key Reversal Zone — Support Test Coming Soon?Today I want to look at the PEPE token ( BINANCE:PEPEUSDT ), which is part of the memecoin category, and provide you with a short-term analysis on the 1-hour timeframe .
PEPE token is trading in Potential Reversal Zone(PRZ) .
In terms of Elliott wave theory , the PEPE token appears to be completing the microwave 5 of the main wave C . The structure is a Zigzag Correction(ABC/5-3-5) .
Also, we can see the Regular Divergence(RD-) between Consecutive Peaks .
I expect the PEPE token to attack the Support zone($0.0000120-$0.0000108) after completing the main wave C .
Note: Stop Loss = $0.0000362
Please respect each other's ideas and express them politely if you agree or disagree.
Pepe Analyze (PEPEUSDT), 1-hour time frame.
Be sure to follow the updated ideas.
Do not forget to put a Stop loss for your positions (For every position you want to open).
Please follow your strategy and updates; this is just my Idea, and I will gladly see your ideas in this post.
Please do not forget the ✅' like '✅ button 🙏😊 & Share it with your friends; thanks, and Trade safe.
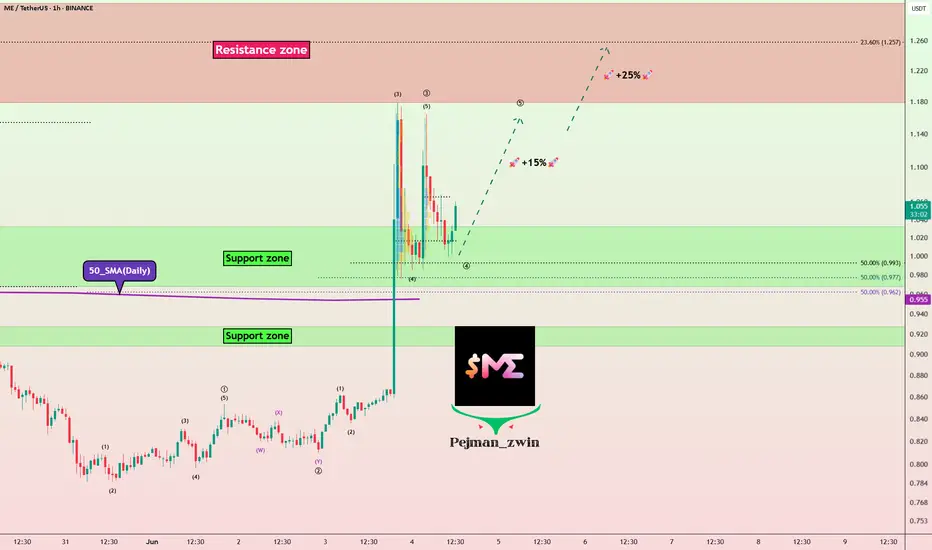
Magic Eden’s ME Token Eyes Bounce After Trump Wallet VolatilityOn June 3, , Magic Eden ( BINANCE:MEUSDT ) announced a collaboration with a project called to launch a new" Trump Wallet "
This announcement triggered a + 35% price increase , pushing the price of ME Token to approximately $1.17 .
However, shortly afterward, members of the Trump family, including Donald Trump Jr. , denied any involvement with the wallet or the project.
This resulted in a -20% price drop due to shaken investor confidence .
-----------------------------
Let’s see how ME Token is doing on the 1-hour timeframe .
ME Token is trading in the Support zone($1.03-$0.96) near the 50_SMA(Daily) .
From the Elliott Wave theory perspective, ME Token seems to have completed the main wave 3 and is currently completing the main wave 4 .
I expect ME Token to rise to at least $1.146(+15%) .
Second Target: $1.237
Note: Stop Loss = $0.95
Please respect each other's ideas and express them politely if you agree or disagree.
Magic Eden Analyze (MEUSDT), 1-hour time frame.
Be sure to follow the updated ideas.
Do not forget to put a Stop loss for your positions (For every position you want to open).
Please follow your strategy and updates; this is just my Idea, and I will gladly see your ideas in this post.
Please do not forget the ✅' like '✅ button 🙏😊 & Share it with your friends; thanks, and Trade safe.