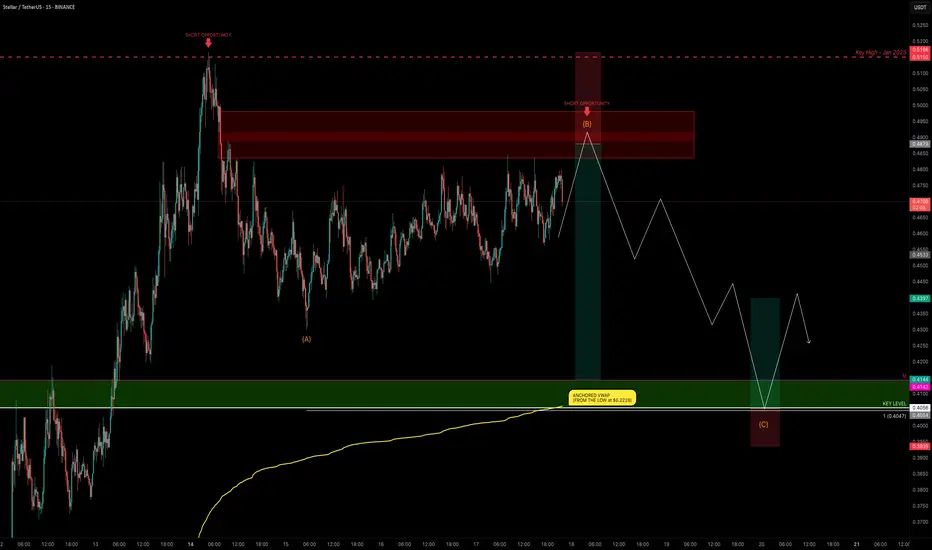
XLM Explodes +132% — Is the Party Over or Just Starting?XLM has been one of the top movers, sweeping the January 2025 swing high at $0.515 before stalling and moving sideways for the past 4 days.
Is XLM gearing up for another push toward the highs, or is a correction imminent?
Let’s dive into the details.
🧩 Market Structure & Fractal Pattern
XLM skyrocketed +132% in just 13 days, mirroring the explosive move seen back in November 2024.
If we apply the November fractal, the current price action suggests we could be setting up for an ABC corrective move.
📉 Key Levels & Confluences
FVG Zone: ~$0.49–$0.50 — likely to be swept before any major move down.
Monthly Support: $0.4142
Key Level / Liquidity Pool: $0.4056 — likely cluster of stop-losses.
Anchored VWAP (from $0.2228 start of trend): currently near $0.4056, adding strong confluence.
1.0 Trend-Based Fib Extension (ABC projection): If price pushes to ~$0.49 to complete wave B, the projected 1.0 TBFE for wave C lands right on the $0.4056 key level + VWAP, creating a perfect confluence zone.
➡️ Conclusion: The $0.4142–$0.4056 zone is a critical support and liquidity area with multiple confluences lining up.
Trade Setups
🔴 Short Setup:
Entry zone: $0.48–$0.50 (ladder in)
Stop-loss: Above $0.5166 (prior high)
Take-profit: $0.4142–$0.4056 zone
R:R ≈ 1:3
🟢 Long Setup:
Entry zone: $0.4142–$0.4056 (preferably near VWAP)
Stop-loss: Below $0.395
Take-profit: $0.44
⚡ Final Thoughts
Watch for a potential final push toward $0.49–$0.50 before a corrective wave unfolds.
The confluence at the $0.4142–$0.4056 zone — including monthly/weekly levels, VWAP, liquidity pool, and the 1.0 TBFE target — makes it a key area for decision-making.
Stay patient and wait for confirmation at these levels. Will post an update as things unfold!
_________________________________
💬 If you found this helpful, drop a like and comment!
Want breakdowns of other charts? Leave your requests below.
Elliott Wave
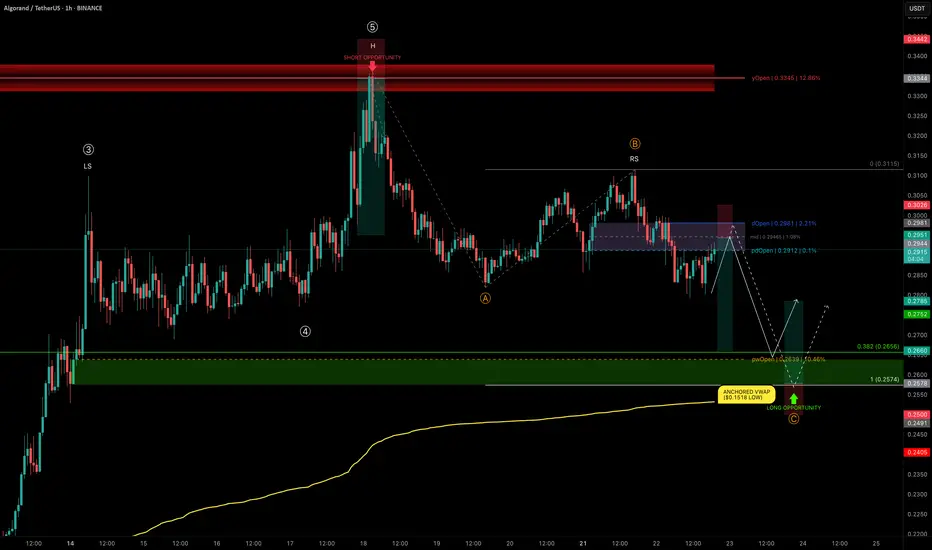
ALGO rejects at yOpen — Mapping High-Conviction Trade ZonesALGO has delivered an impressive +124% rally from $0.1518 to $0.336 in just 25 days, completing a 5-wave Elliott impulse right into the yearly open resistance.
We are now in a correction phase, and the current structure is showing a head and shoulders pattern, with the right shoulder currently forming.
Let’s break down the key levels and setups.
🧩 Technical Breakdown
➡️ ABC Corrective Structure:
Targeting wave C near the trend-based fib extension (TBFE) at $0.2574
➡️ Fib Retracement Confluence:
0.382 retracement of the entire 5-wave move → $0.2656
Previous weekly open (pwOpen) → $0.2639
Liquidity pocket likely to be swept
Anchored VWAP from the $0.1518 low (start of the bullish trend) → currently at $0.2532, acting as a major support layer
Conclusion: Long opportunity zone between $0.2656–$0.2574
Trade Setups
🔴 Short Setup:
Why? ALGO has lost dOpen and pdOpen — a bearish sign for downward continuation.
Entry Zone: Between dOpen and pdOpen
Stop-loss: Above dOpen
Target (TP): 0.382 fib retracement (~$0.2656)
R:R: ≈ 1:3.5
🟢 Long Setup:
Entry Zone: Laddered Entries between $0.2656–$0.2574
Stop-loss: Below anchored VWAP (~$0.2532)
Target (TP): ~$0.2785+
R:R: ≈ 1:2.65
🛠 Indicator Note
I’m using my own indicator called "DriftLine - Pivot Open Zones " for this analysis, which I recently published.
✅ Feel free to use it in your own analysis!
Just head over to my profile → “Scripts” tab → apply it directly to your charts.
💡 Educational Insight: Why Confluence Matters
High-probability trades aren’t based on just one tool or level — they come from confluence, where multiple signals align: fib levels, VWAP, liquidity pools, price structures , and key levels.
For example, in this ALGO setup, it’s not just the fib retracement or just the VWAP — it’s the stacking of all these elements together that creates a precise zone with a better statistical edge.
✍️ Lesson: Don’t chase trades off single signals; stack tools for confirmation.
Patience, confirmation, and confluence — as always, the keys to high-probability setups. 🚀
_________________________________
💬 If you found this helpful, drop a like and comment!
Want breakdowns of other charts? Leave your requests below.
DOGE Breakout
➡️ Dogecoin blasted away from the black descending channel and past green resistance (now support).
➡️ In my primary count, we are currently in green IV correction, and expect new higher highs.
➡️ A retest of green support would be nice, but it is probable that price won´t go that far.

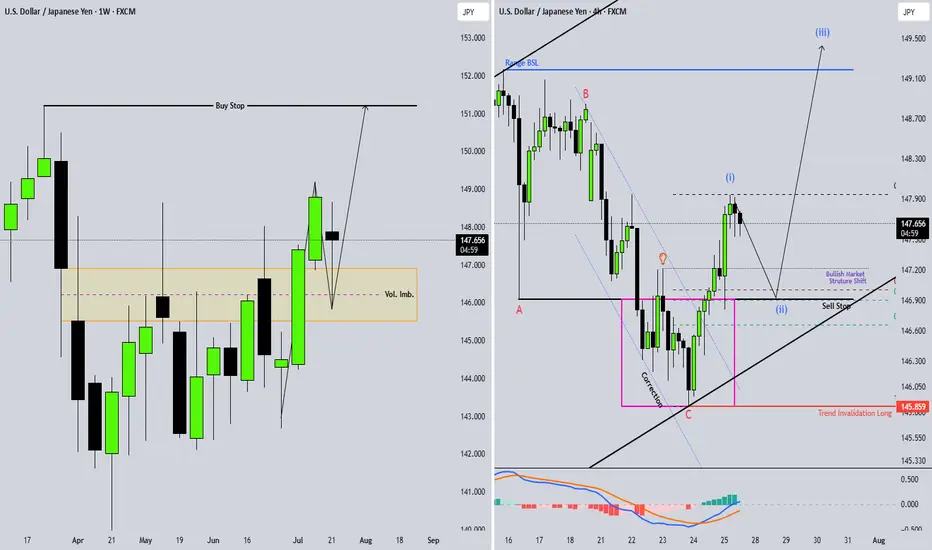
USDJPY BullishAfter exiting a correction, the first impulse (Wave 1) appears. I expect a retracement of at least 50% of the Fibonacci.
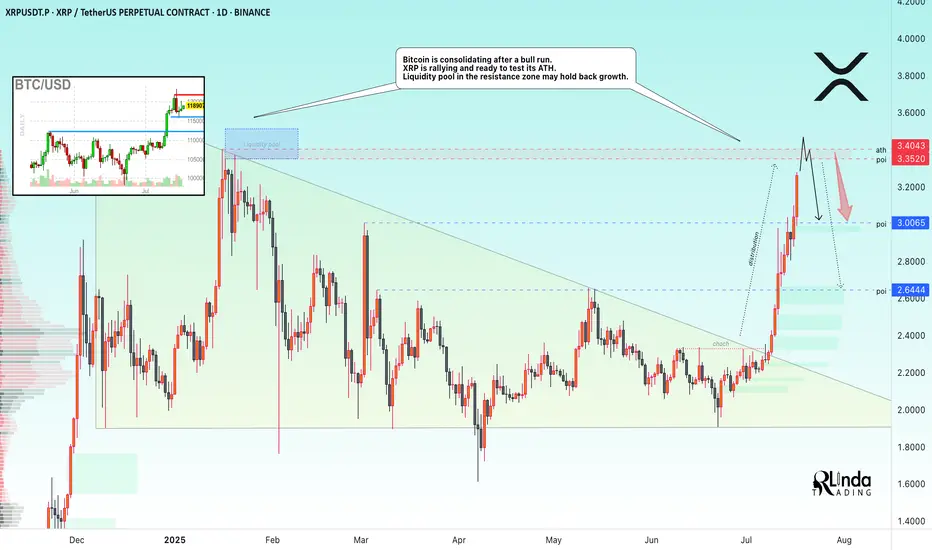
XRP → ATH retest. Reversal or continued growth?BINANCE:XRPUSDT.P is rallying and ready to test the resistance zone - ATH. Against this backdrop, Bitcoin is consolidating after a bull run. The liquidity pool may hold back growth.
Fundamentally, there is excitement across the entire cryptocurrency market. Altcoins are rallying after Bitcoin hit a new high and entered consolidation. The BTC.D index is declining, which generally provides a good opportunity for altcoins to grow. However, the index is approaching technical support, which may affect market sentiment overall...
As for XRP, there is a fairly strong liquidity pool ahead — the ATH resistance zone. The price is in a distribution phase after a change in character and a breakout of the downtrend resistance in the 2.33 zone. The momentum may exhaust its potential to break through the 3.35-3.34 zone, and growth may be halted for correction or reversal (in correlation with Bitcoin's dominance in the market).
Resistance levels: 3.35-3.40
Support levels: 3.0, 2.64
A breakout of resistance without the possibility of further growth, a return of the price below the level (i.e., inside the global flat) will confirm the fact of a false breakout of resistance, which may trigger a correction or even a reversal.
Best regards, R. Linda!
Gold. Could this be the final "shape" of triangle? 26/July/25XAUUSD. back to previous ideas that we possible having a contracting /symmetrical triangle pattern on gold chart..Probarly a "big surprise" on 31 July FED/FOMC meeting?
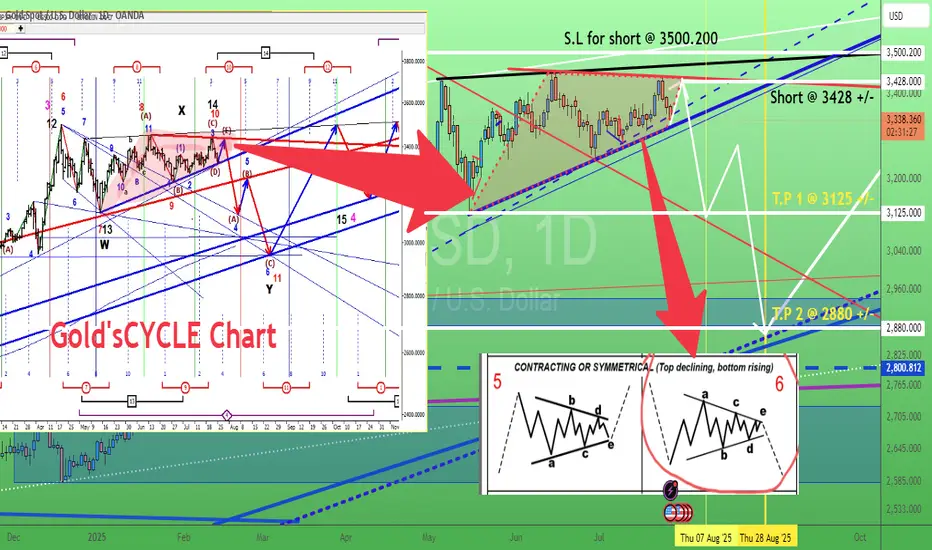
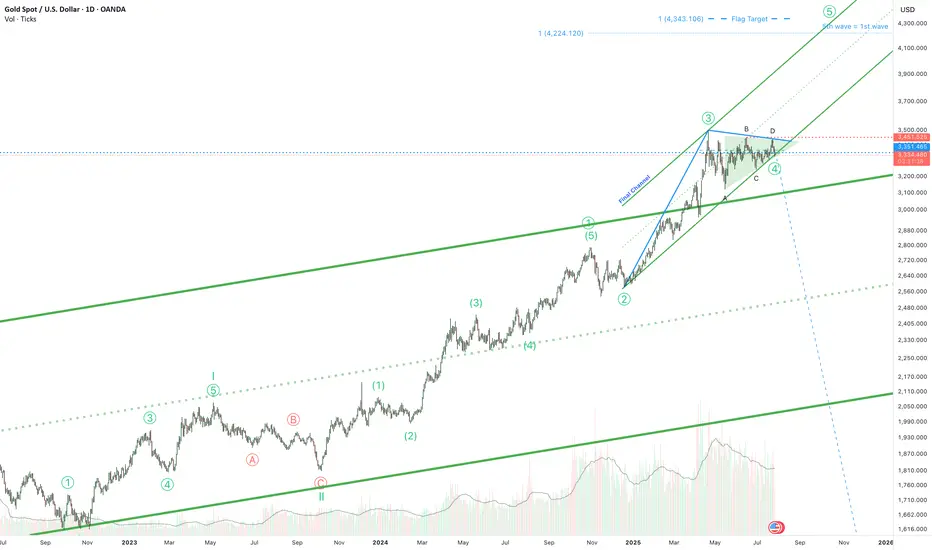
Gold is ready for the 5th wave!Hello! If you're following gold, here's some exciting news. The triangle correction phase that began in April is almost over. It's been a long journey, but we're almost there.
And guess what? The final phase is expected to reach around $4,300. But wait, there's more! The price is holding above the top of a long-term channel. This isn't just a random move; it could be a strong signal that the price could rise even higher than the $4,300 mark.
So, if you're following the gold market, keep your eyes peeled. Big moves could be just around the corner!
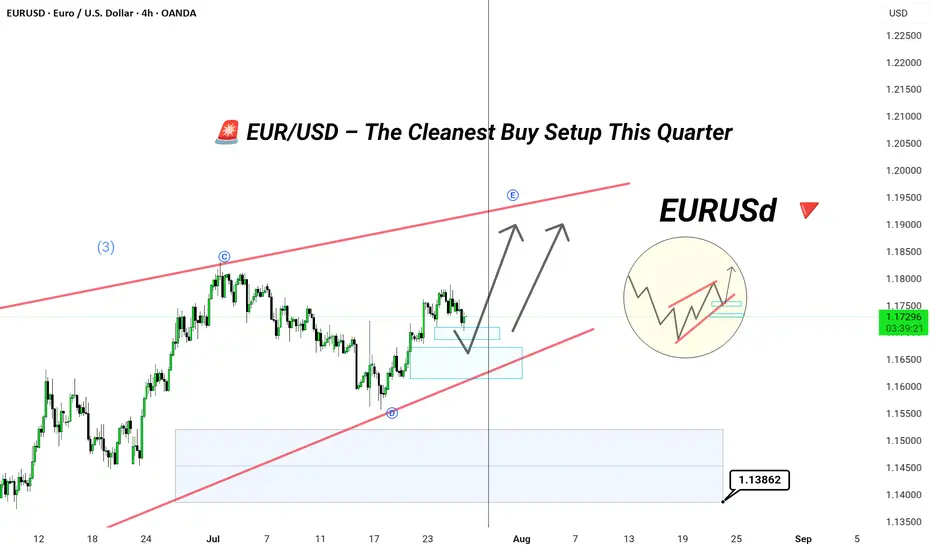
EUR/USD – The Cleanest Buy Setup EUR/USD – The Cleanest Buy Setup This Quarter (Wave E Targeting New Highs)
---
📄 TradingView explanation
📊 EUR/USD 4H Chart Analysis
The pair has beautifully respected the corrective channel from Wave C to D and is now preparing for the final leg — Wave E.
🟦 Key Highlights:
🔹 Price bouncing off demand zone
🔹 Tight consolidation near mid-channel = accumulation
🔹 Next targets: 1.1900 / 1.2050
🔹 Bullish continuation expected after liquidity sweep
🎯 The cleanest and most technically sound buy opportunity this quarter — align your longs with the trend before the breakout happens.
💬 Let them call it a bubble — we call it precision and patience. 🧠💸
#ElliottWave #EURUSD #ForexSetups #SmartMoneyMoves
?
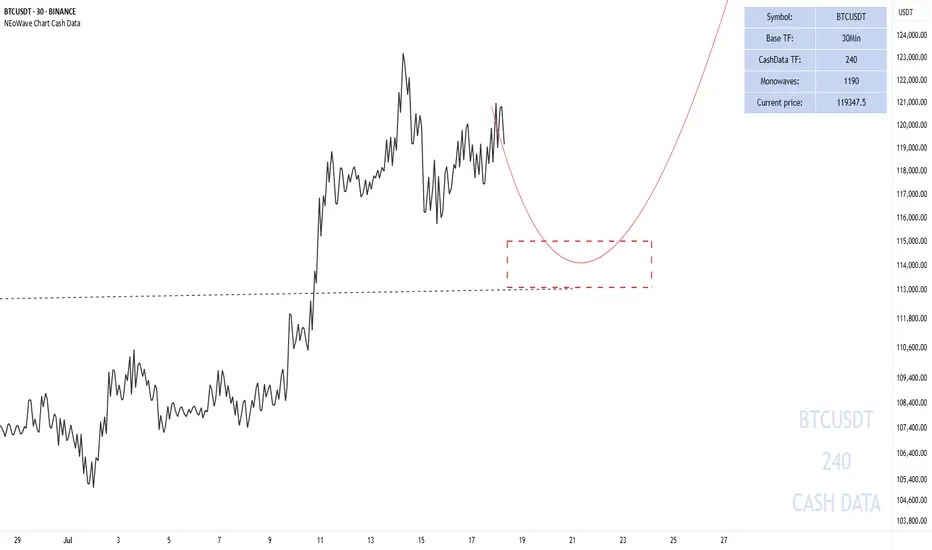
Short-term BITCOIN analysisShor-term
In my opinion, Bitcoin could make a move towards $113,000-115,000 and then start moving upwards. In any case, according to previous analysis and apart from short-term fluctuations, it could touch the target of $140,000-150,000.
Good luck
NEoWave Chart
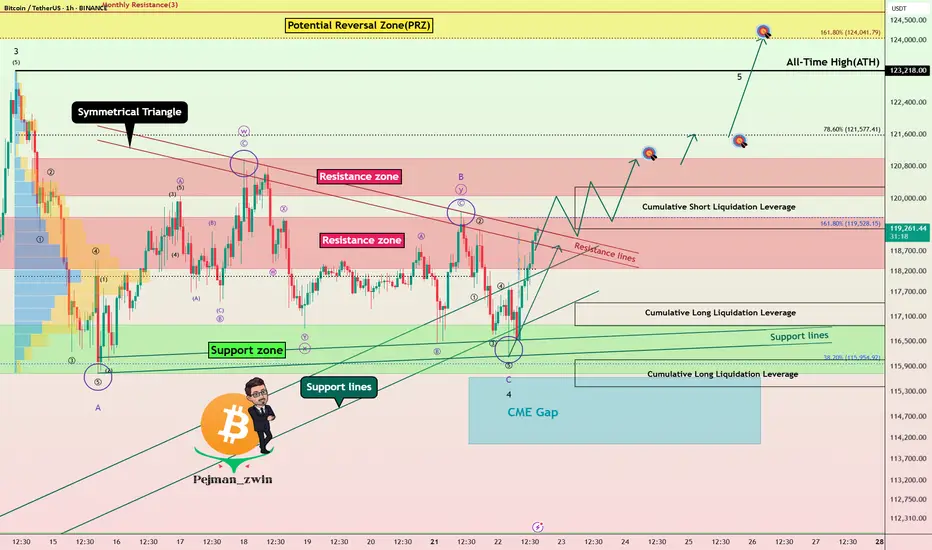
Powell’s Comments Could Decide BTC’s Fate: New ATH or Rejection!Bitcoin ( BINANCE:BTCUSDT ) has attacked the Support zone($116,900-$115,730) several times over the past week but failed to break through, meaning that buyers are still hoping for a BTC increase or even a new All-Time High(ATH) .
Bitcoin has reached a Resistance zone($119,530-$118,270) again and is trying to break the upper lines of the Symmetrical Triangle Pattern . The Cumulative Short Liquidation Leverage($117,255-$116,675) is important and includes high sell orders , so if Bitcoin can break the Resistance zone($119,530-$118,270) and the Resistance lines with high momentum , we can hope for a continuation of the upward trend.
Whether or not the Resistance zone($119,530-$118,270) and the Resistance lines break could depend on the tone of Jerome Powell’s speech today .
Jerome Powell will speak at the opening of the “ Integrated Review of the Capital Framework for Large Banks ” — the final major appearance before the Federal Reserve enters its pre-meeting blackout period.
Market Expectations:
The speech is officially about regulatory frameworks (like Basel III), but traders are watching closely for any hints regarding interest rate policy. Even indirect comments could move risk assets like BTC.
Rate Cut Signals?
With political pressure mounting (including criticism from Trump ) and markets pricing in a potential cut later this year, Powell may adopt a cautious, data-dependent tone emphasizing flexibility in decision-making.
--------------------
In terms of Elliott Wave theory , it seems that the wave structure of the main wave 4 correction is over. The main wave 4 has a Zigzag Correction(ABC/5-3-5) , so that the microwave B of the main wave 4 has a Double Three Correction(WXY) . Of course, the breakdown of the Resistance zone($119,530-$118,270) and Resistance lines can confirm the end of the main wave 4 .
Also, there is a possibility that the 5th wave will be a truncated wave because the momentum of the main wave 3 is high , and Bitcoin may NOT create a new ATH and the main wave 5 will complete below the main wave 3.
I expect Bitcoin to rise to at least the Resistance zone($121,000-$120,070) AFTER breaking the Resistance zone($119,530-$118,270) and Resistance lines .
Second Target: $121,620
Third Target: $123,820
Note: Stop Loss(SL)= $117,450
CME Gap: $115,060-$114,947
Cumulative Long Liquidation Leverage: $117,429-$116,878
Cumulative Long Liquidation Leverage: $116,053-$115,411
Please respect each other's ideas and express them politely if you agree or disagree.
Bitcoin Analyze (BTCUSDT), 1-hour time frame.
Be sure to follow the updated ideas.
Do not forget to put a Stop loss for your positions (For every position you want to open).
Please follow your strategy and updates; this is just my Idea, and I will gladly see your ideas in this post.
Please do not forget the ✅' like '✅ button 🙏😊 & Share it with your friends; thanks, and Trade safe.
Elliott waveelliott 5 wave structure bearish continuation
sell limit 3347-3350 stoploss 3355, tp 3320

BTC 4H Chart Uptrend
➡️ My wave count considers we're now in blue wave 4, and this corrections should finish soon.
➡️ The 125k round number is an interesting target for green wave III.
➡️ This scenario is valid as long as we stay above blue 1 top (at 110.529).

Gold. Trade Swing buy setup 25/July/25XAUUSD "erased" all its early weekly gain by having deep pullback until its weekly pivot and channel support confluence zone again..
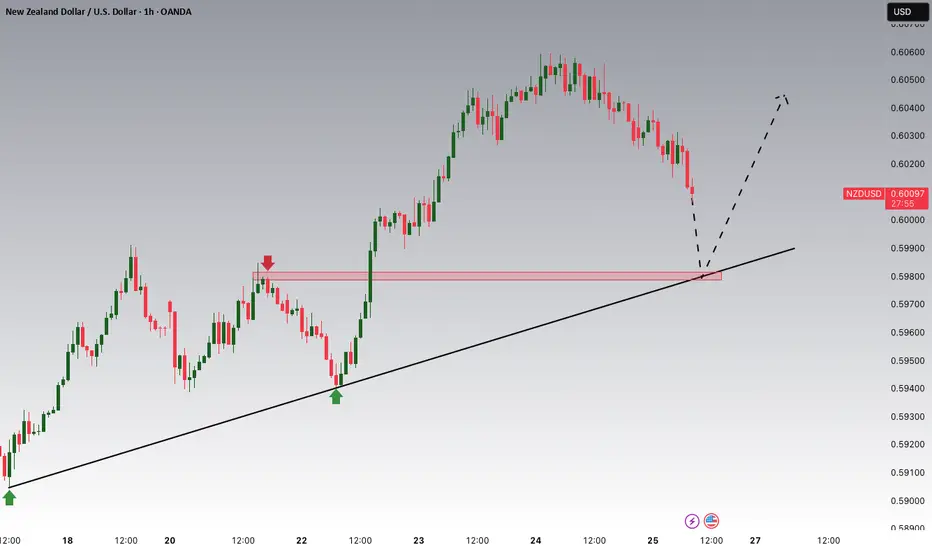
NZDUSD Potential UpsidesHey Traders, in today's trading session we are monitoring NZDUSD for a buying opportunity around 0.59800 zone, NZDUSD is trading in an uptrend and currently is in a correction phase in which it is approaching the trend at 0.59800 support and resistance area.
Trade safe, Joe.
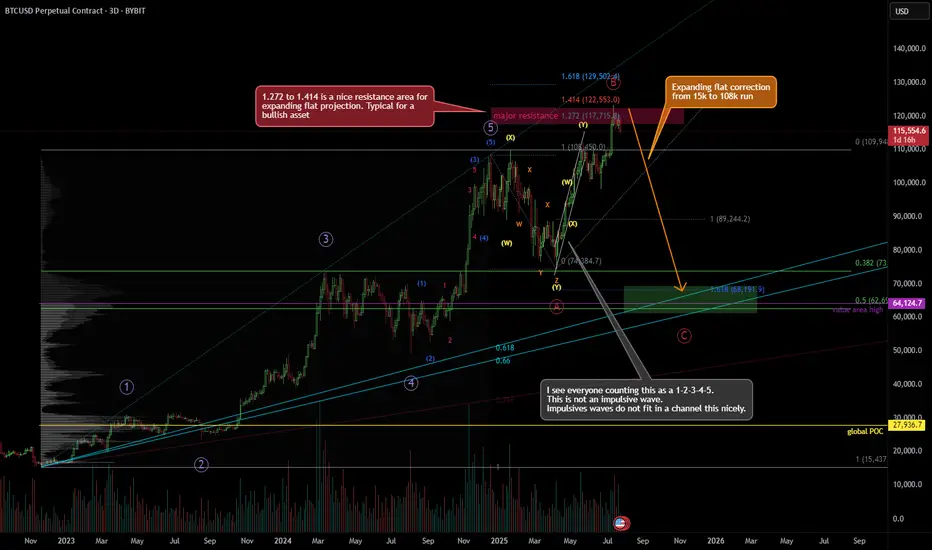
Looking for a correction, bearish Elliott Wave countThere's a probability that the Jan 25' high was the true 5-wave top, and not the Dec 24' top shown here, but because the price difference is barely 1%, the projections don't differ much.
I've long counted the April 25' to June 25' run as a very nice looking WXY. Almost perfect channel correction. A very bullish correction, sure, but still a correction.
And, we're forming an expanding flat from 109k region, down to 74k, then to 123k, and likely down to around 68k.
There's just too many confluences around 67-68k region.
(1) Huge volume node
(2) 1.618 fib projection
(3) 0.5 retracement from 15k to 109k run (2022-2025 run)
(4) Fib fan 0.618 to 0.66 (golden zone)
(5) Value area high of the 15k to 109k run
It's 7/25/25 as of posting this. Locally, in a 15min time-frame, I don't actually see this coming down right away. It's likely to spend few more weeks up here before it starts to make its movement.
posting full SSThis post serves only to share the complete SS, which was not inadvertently included in the earlier post shared today.

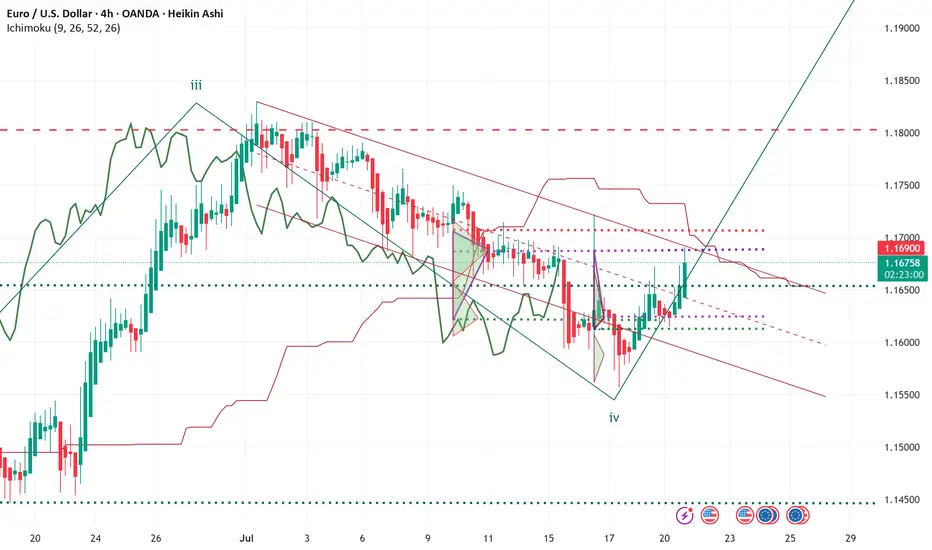
ELLIOTT WAVE EURUSD H4 update
EW Trade Set Up H4
subminuette W4 seems finished
monitor the breakout of the descending channel that appears to contain wave IV
The bullish movement that started on July 17th must assume a 5-wave pattern
key levels (area)
1.1705
1.1684 POC
1.1654
note :
the breakout upwards of the leading span B (red line) by the lagging span (green line) will confirm the start of a bullish movement in the subminuette wave v.
Failure to break above price levels 1.1684 and 1.1705 will result in a recalculation of the waves count
Xiaomi probably “bottomed” as China most major stocks. 8/Nov/22Xiaomi’s share price probably found its long term base with double bottom pattern at support zone.
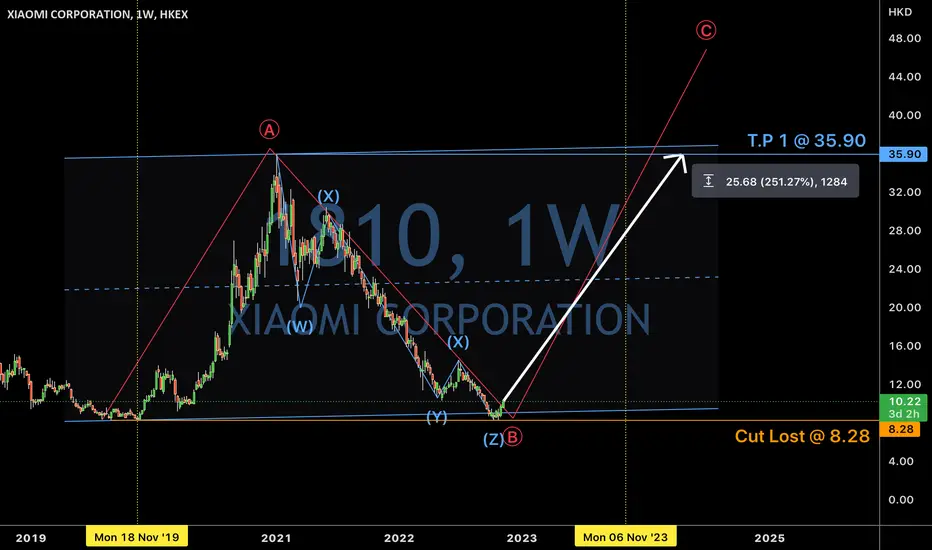
A correction ahead.If you know Elliott Wave, then you will understand this analysis. Now as you saw my last post a wave 'Y' on monthly T.F has started from 30 June. This was on a larger T.F but this analysis is on smaller T.F. Wave '1' has completed now on this T.F. and a correction ahead upto 0.618(25345) or 0.707(25420) of this enfire run as showed in screenshot.

GOLD → Countertrend correction. Where will growth begin?FX:XAUUSD faced pressure in the 3430 zone, traders moved into profit-taking mode, triggering a correction. The price entered the sell-off zone...
On Thursday, gold is trading below $3400 as traders assess progress in US-EU trade talks and await preliminary PMI data from the US and the EU. These indicators could influence expectations for Fed and ECB rates. Optimism is being bolstered by reports of trade agreements between the US and Japan and other countries. The ECB is expected to keep rates unchanged, while the probability of a Fed rate cut in September is estimated at 60%. Investors are also watching Trump's conflict with Powell amid his visit to the Fed. Technically, the daily market structure is not broken, and a correction is forming within acceptable limits.
Based on the current direction, the market may test the intermediate bottom: trend support, the 3345-3320 area.
Resistance levels: 3375, 3383, 3400.
Support levels: 3345, 3320
A retest of resistance at 3375-3383 is possible. If the bears keep the price below this zone, the metal may continue its correction phase towards the zone of interest indicated on the chart. Local sell-offs have not yet broken the bullish daily structure.
However, the absence of a downward impulse and consolidation in 3375 - 3383 with a subsequent breakout of local resistance could increase demand again, which would generally lead to premature growth to 3400 - 3435.
Best regards, R. Linda!

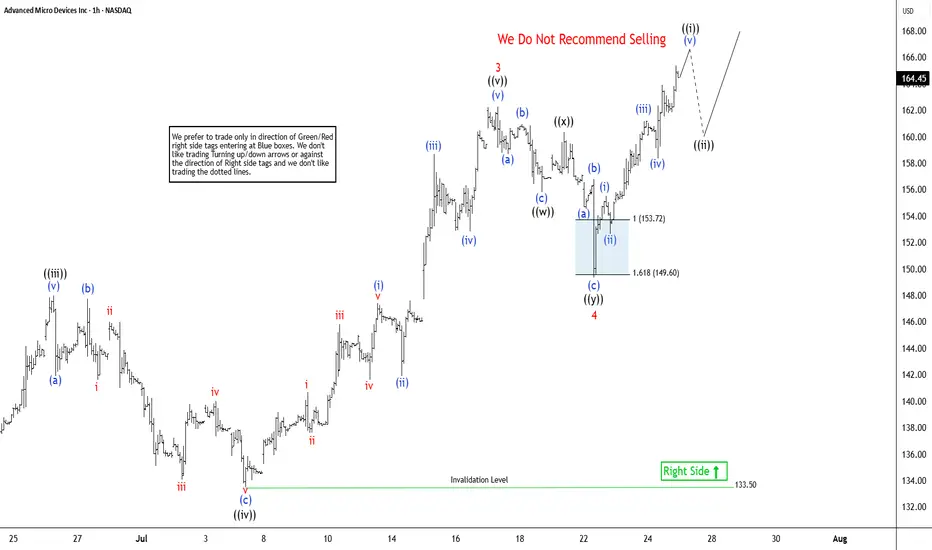
Elliott Wave Outlook: AMD Expects Pullback Soon Before RallyThe Advanced Micro Devices Inc., (AMD) favors rally in impulse Elliott Wave sequence from 4.09.2025 low & expect upside in to 168.36 – 190.36 to finish it. Impulse sequence unfolds in 5, 9, 13, 17…., swings & ends with momentum divergence. In daily, it ended pullback in 3 swings at 75.22 low in blue box area from March-2024 high. It is trading higher in nest & expect 13 swings to finish the impulse ((1)) before correcting next. Currently, it favors rally in 7th swing in daily & expect end soon in to 165.63 – 179.16 area before correcting in (4) as 8th swing. In 4-hour, it ended (1) of ((1)) at 97.91 high, (2) at 83.75 low in 4.21.2025 & favors rally in (3) as extended wave. Within (3), it placed 1 at 122.52 high, 2 at 107.09 low, 3 at 162.36 high, 4 at 149.34 low of 7.22.2025 & favors rally in 5. It is showing higher high since April-2025 low.
Below 3 high of 162.36, it ended 4 pullback in double three correction at 149.34 low. It ended ((w)) at 155.81 low, ((x)) at 160.34 high & ((y)) at 149.34 low. Above 4 low, it favors rally in ((i)) of 5 in to 165.44 – 170.43 before correcting next. Within ((i)), it ended (i) at 155.53 high, (ii) at 152.66 low, (iii) at 161.20 high, (iv) at 158.36 low & favor higher in (v). It appears three swings in (v) & expect pullback before final push above 161.52 low before correcting in ((ii)). Alternatively, the current cycle from 4 low can be 5 of (3) before it corrects in (4). In either the case, the next pullback should remain supported. In 4-hour, it is trading in 11th swing & expect pullback in 12th swings later before final rally. We like to buy the pullback in 3, 7 or 11 swings at extreme area for the upside in ((1)).
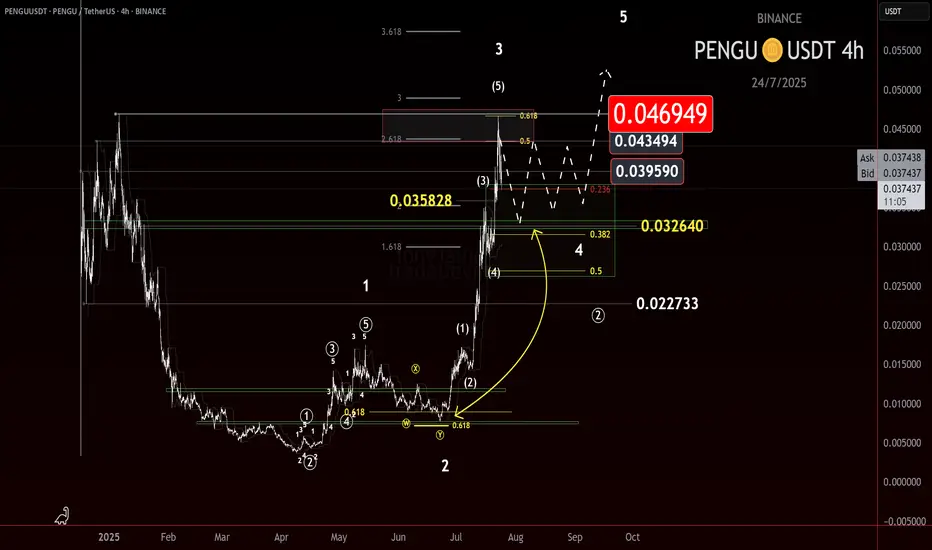
Is $PENGU Cooling Off?CSECY:PENGU continues to deliver, respecting structure and printing some clean price action. After breaking out of consolidation beneath the LOI at 0.032, price extended sharply, reaching as high as 0.0469—where we just saw a firm rejection, previously identified in the last update.
That level wasn’t random. It aligned with a Most Likely Target (MLT) for a wave 5 at a lesser degree and a wave 3 at a higher degree. That kind of confluence usually draws in some heat—and it did.
So what now?
The conservative bull outlook is that we may be entering a wave 4. How this pullback unfolds could tell us a lot. The last retrace was shallow, and if this one digs a bit deeper or breaks certain levels with pattern clarity, that might signal a higher degree wave 4 is underway. The key level here is the 0.0325 level we were watching before.
The raging bull scenario is that we’re still in a lesser degree impulse up. A hold and bounce off the key level could be enough to continue the move higher. But I’m watching the conservative outlook here until we get more print.
Here’s what I’m watching:
• Wave 4 Behavior
Is this a pause or a pivot? The next leg depends on how corrective this gets.
• 0.027
A break here would raise eyebrows. That’s a deeper level of interest and could hint at something more than a minor pullback.
• Pattern Depth & Structure
Each retrace tells a story. More complex wave 4s tend to show themselves through drawn-out corrections or deeper fib targets.
I’m still holding partial from the original 0.012 entry, having taken some profit on the way up. If we get a clean W4 print, I’ll be scouting for the next add.
Trade what’s printed. Stay flexible. Let the wave show its hand.
Trade Safe.
Trade Clarity.
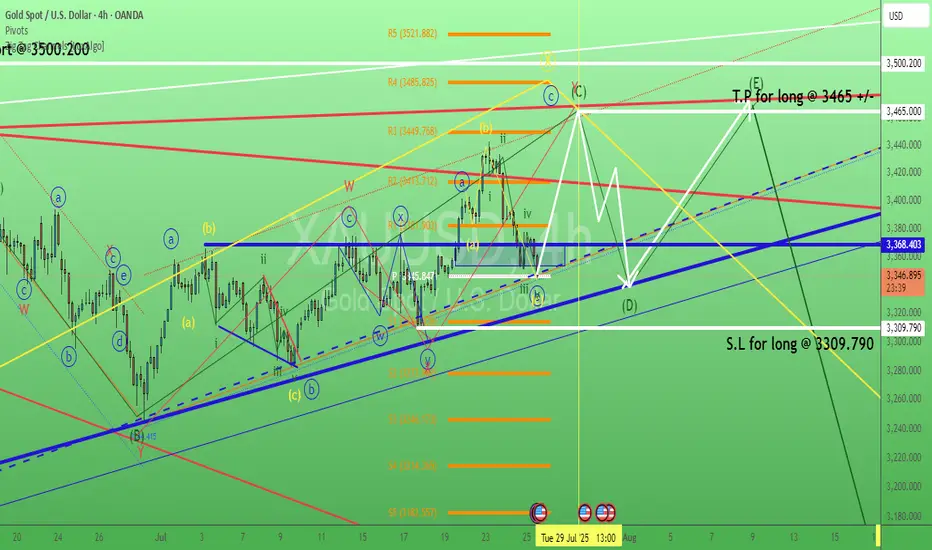
XAU/USD – Elliott Wave Update | Wave (2) in Progress)OANDA:XAUUSD
🔍 Wave Structure Overview
We’re currently in a
Prior impulse (likely 1-2-3-4-5) completed, forming (Circle) wave ①
Current correction unfolding as (A)-(B)-(C) in yellow
↳ Presently in wave (A) or transitioning into (B)
↳ Within (B), structure is forming as A-B-C
↳ Currently tracking 5-wave move from 4 to 5
📐 Fibonacci & Key Levels
Watching 61.8% retracement as a critical support zone ✅
This level also marks a high-probability TP area for short positions
Strong confluence:
🔹 Fibonacci retracement
🔹 Extension alignment (e.g. yellow fib extension to ~4403)
🔹 Trendline reaction expected
🧠 Trade Setup (Scenario-Based)
🔸 Scenario A – Early Entry:
Enter small long near 61.8% Fib zone
SL: Below last swing low
TP: To be refined once C-wave completes
🔸 Scenario B – Confirmation Entry:
Wait for break above red trendline
Add position
SL below Fib zone low
TP around Fibonacci extension / structure resistance (~4403)
⚠️ Key Considerations
Many positions will close in this zone → increase in selling pressure
Possible reversal zone → watch for confirmation (impulse or ABC)
Once wave (C) completes, we’ll likely see entry into a larger bearish move
📎 Conclusion
This is a high-probability reversal zone, supported by Elliott structure and Fib levels. I’m planning to scale in based on price action and confirmation.
📈 Stay flexible, manage risk, and watch the structure evolve.
