GBP/USD: Post-Impulse Sell Setup from Ending DiagonalThe chart depicts a completed 5-wave impulsive structure, culminating at the top of wave (5). The internal wave structure of the final fifth wave forms a classic ending diagonal pattern, typically signaling a trend reversal or deep correction.
After this extended fifth wave, the price has started rolling over, confirming the start of a corrective decline. The wave count now expects an ABC correction targeting the previous wave 4/2 demand zone, highlighted in red.
Target 1 (T1): 1.33608
Target 2 (T2): 1.32436
Stop Loss (SL): 1.35988
Ending diagonal at the top of wave (5) signals exhaustion of bullish momentum.
Clear bearish divergence (not shown here) is commonly seen with this pattern.
The price has broken the short-term structure and is now forming lower highs.
Target zone aligns with previous wave 2 consolidation – a typical retracement zone for post-impulse corrections.
Elliotwaveanalysis

Hellena | GOLD (4H): LONG to area of 3370 (Wave 2).Colleagues, gold is once again disrupting our plans, and I have to revise the wave marking. It's not easy, but the most important thing is to keep doing it.
Now I'm back to the previous marking — the price is in wave “2” correction.
To complete this wave, the price needs to overcome the level of wave “W” of the middle order 3246.82. Then the correction will be completed and wave “3” will begin an upward movement.
I see the minimum target in the area of the 3370 level.
Manage your capital correctly and competently! Only enter trades based on reliable patterns!
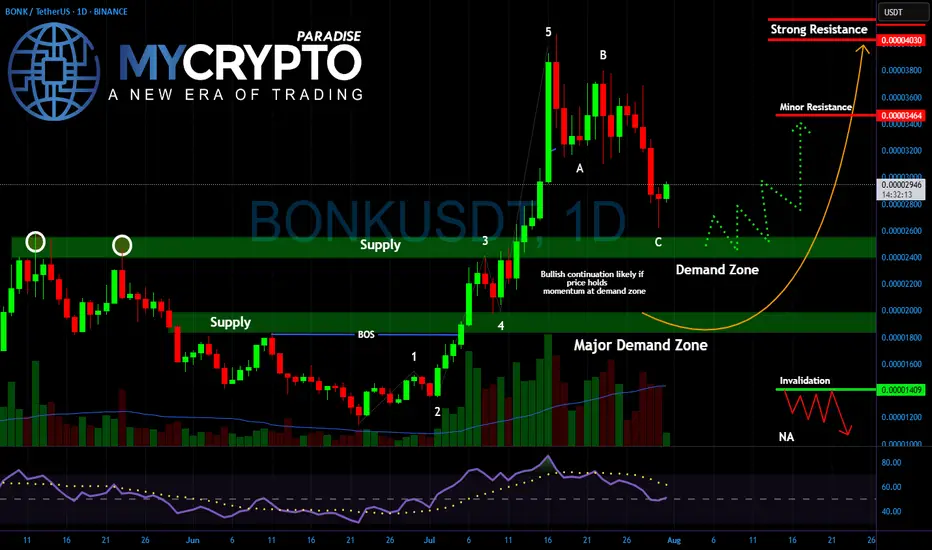
BONK About to Break Out or Break Down?Yello Paradisers! Are you ready for the next explosive move in #BONK? After nailing the last rally and spotting the impulsive 5-wave structure early, we’re now entering a critical phase — and what happens next could decide whether BONK flies or collapses.
💎The recent pullback has followed a clean A-B-C corrective structure, landing perfectly into the key demand zone between 0.00002600 and 0.00002200. This zone now acts as the battlefield between smart money buyers and weak-handed sellers. Price action is slowing down, volume is drying up, and RSI is resetting all classic signs of a potential bullish continuation. But if buyers fail to step in with conviction, the market could easily sweep lower to test the major demand zone closer to 0.00001800.
💎As long as price holds this area and confirms a reversal with follow-through momentum, we could see #BONK heading back toward 0.00003460 as the first stop, and possibly a retest of the 0.00004030 resistance. However, if price closes below 0.00001409, that would invalidate the bullish setup and confirm a deeper corrective phase.
Patience and strategy win the game, Paradisers! The market is designed to shake out weak hands before the real move happens.
MyCryptoParadise
iFeel the success🌴
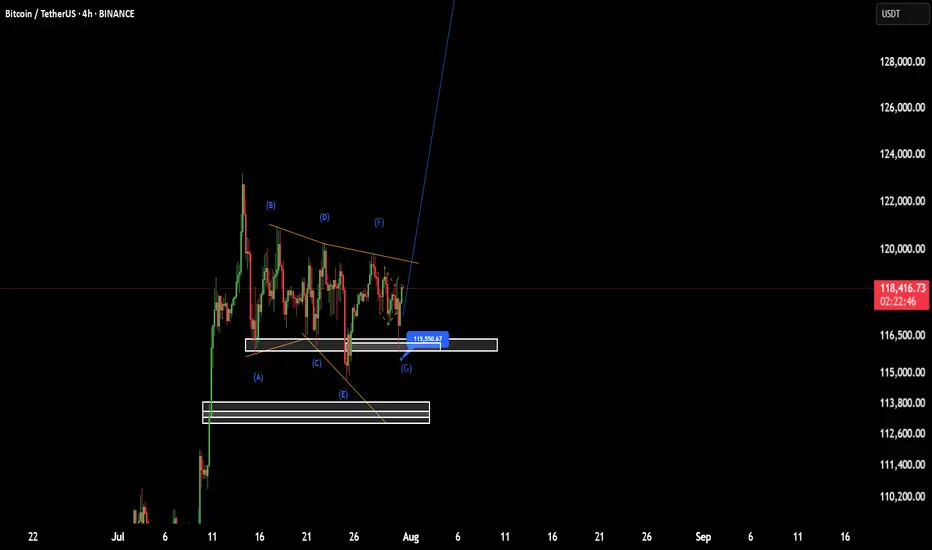
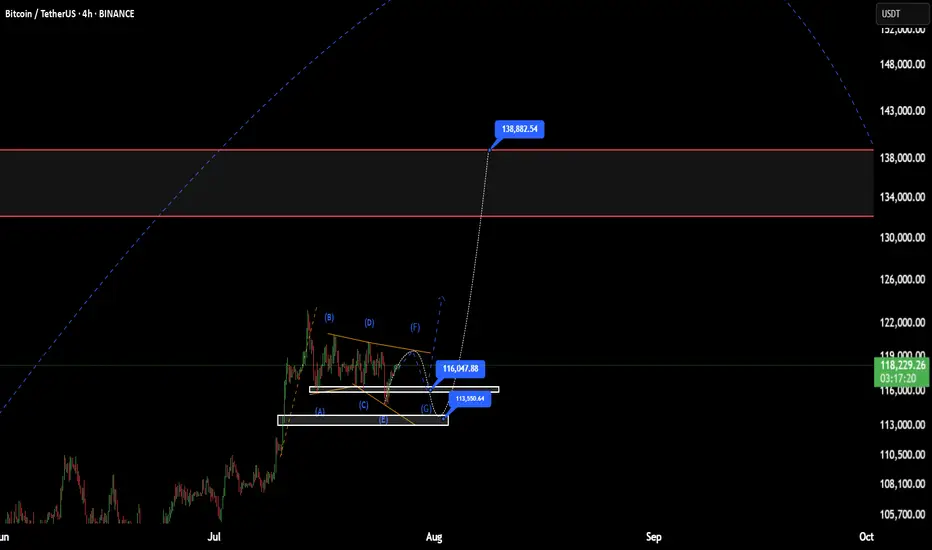
BTC(based on NEo wave)I think wave G is finished and soon it will pump to 138K.
stop loss is 115500.
attention:138K is the first target of these bullish waves.
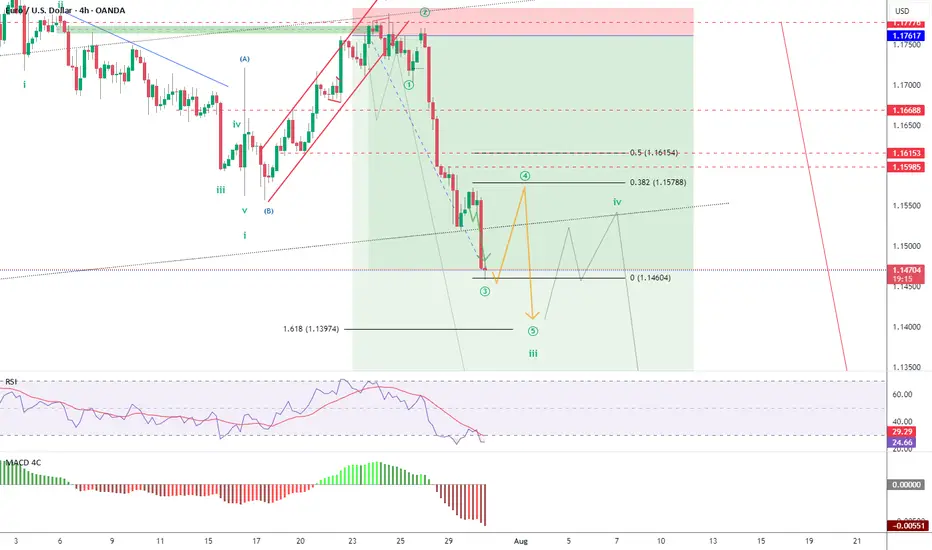
EUR/USD Elliott Wave: Corrective Pullback in Progress Wave ((4))EUR/USD 4H chart with Elliott Wave count. The pair remains in a steady downtrend after peaking at the wave (C) high, and is now in the middle of a larger wave iii decline. Bearish impulse waves dominate, with lower lows confirming the trend (mid-wave iii scenario). Now expecting a wave ((4)) relief bounce (corrective) within this wave iii. Price could rebound toward 1.15788–1.16153, the ~38.2–50% Fibonacci retracement zone of the prior drop.
This area is a likely resistance for the bounce, suggesting only a temporary uptick in an otherwise bearish move. After wave ((4)) completes, the downtrend should resume as wave ((5)) of iii kicks in. The next downside target is around 1.13974 (or lower) – near a 1.618 Fibonacci extension projection where wave ((5)) may complete. This would likely finish wave iii and aligns with the broader bearish Elliott Wave count.
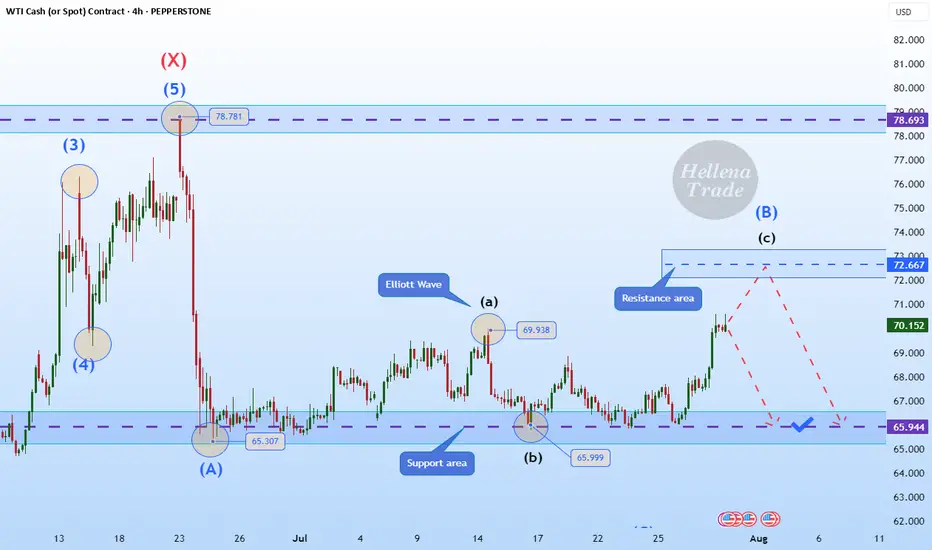
Hellena | Oil (4H): SHORT to support area of 65.944.Colleagues, I previously recommended moving trades to break-even, and for good reason. It is always necessary to hedge and reduce losses—this is part of professional work.
(Breakeven=Risk Free: Move Stop loss to the entry level).
The price has nevertheless shown a stronger correction, and I now believe that the medium-term “ABC” waves have not yet formed, nor has the large “Y” wave.
This means that I expect the completion of wave “B” and then a continuation of the downward movement in wave “C.”
I consider the support area of 65.944 to be the minimum target.
Manage your capital correctly and competently! Only enter trades based on reliable patterns!
Bitcoin (BTCUSDT) - Possible Completion of a Complex CorrectionTimeframe: 4H + 1H
Methodology: NeoWave (Glen Neely) + Smart Money Concepts (ICT/SMC)
Posted by: @CryptoPilot
⸻
🧠 NeoWave Analysis: Complex Correction Ending?
From a NeoWave perspective, BTC seems to be in the final stages of a Complex Correction that started in March 2025 from ~72k. The upward move appears to form a Contracting Diametric structure (7 legs: A–B–C–D–E–F–G), with the current leg G potentially unfolding now.
• ✅ Wave A: Sharp recovery from March lows
• ✅ Waves B–F: Alternating corrective legs with varied time and complexity
• 🔄 Wave G: Could be starting now, expected to break structure to the downside
This suggests that the entire move from March till now may represent a large Wave B, setting the stage for a deeper Wave C down.
⸻
🔍 Price Action + Smart Money Confluence
The following observations strengthen the NeoWave scenario:
• 🟨 Liquidity Pools above 120k were swept recently, creating a potential Buy-side Liquidity Grab
• 🟥 Imbalance/FVGs below 114.5k remain unfilled
• 🔻 Market Structure Shift (MSS) evident on 1H chart — lower highs forming
• 🧠 Price rejected from a key Supply Zone, aligning with end of Wave F
• 🟩 If price re-tests the internal bearish OB (near 119.5k–120k), it may provide an ideal short trigger
⸻
📌 Key Levels to Watch:
Level
Description
120.2k
Liquidity sweep zone / MSS confirmed
118k
Current structure base (pivot)
114.5k
FVG + potential Wave G target
111–112k
Strong demand zone (accumulation support)
🧭 Scenario Outlook:
Primary:
→ Price is in Wave G of a Diametric (NeoWave)
→ Likely to unfold as a 3-leg Zigzag down or a Complex combination
→ Objective: break below Wave E low and target the unmitigated imbalances
Alternative:
→ Extended Flat or Triangle, if 120.5k is broken impulsively
→ Invalidation = clean break and hold above 121k
⸻
⚠️ Risk Note:
This analysis assumes Wave G is beginning. If bulls manage to reclaim 120.5k with momentum and close above, the bearish structure will be invalidated.
⸻
💬 Final Thought:
We are potentially nearing the end of a complex corrective rally. The confluence of NeoWave structural symmetry, Smart Money traps, and market inefficiencies suggests that BTC may be preparing for a retracement. Stay alert for confirmations before executing.
⸻
📌 Follow @CryptoPilot for advanced wave structure updates, market geometry insights, and ICT-style smart money traps.
💬 Share your views or alternate wave counts in the comments!

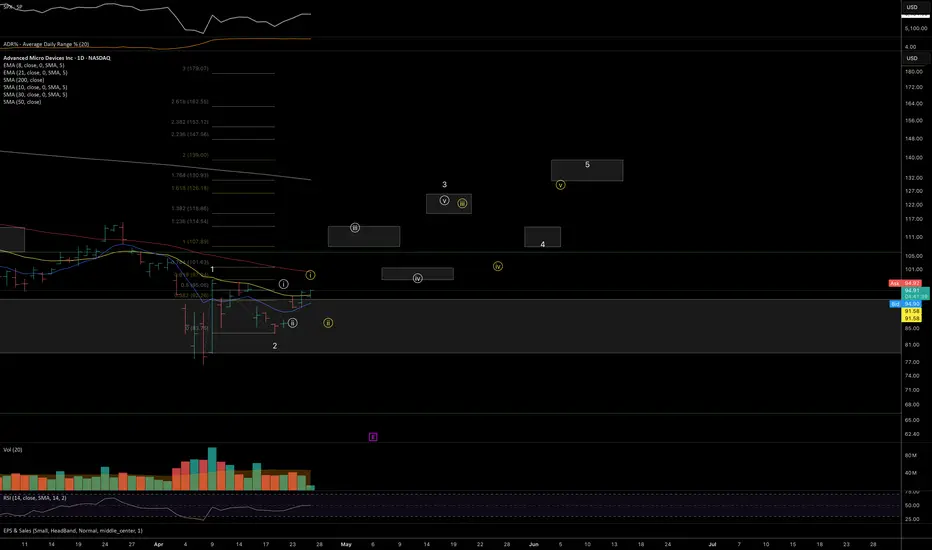
AMD: Potential Mid-Term Reversal from Macro SupportPrice has reached ideal macro support zone: 90-70 within proper proportion and structure for at least a first wave correction to be finished.
Weekly
As long as price is holding above this week lows, odds to me are moving towards continuation of the uptrend in coming weeks (and even years).
1h timeframe:
Thank you for attention and best of luck to your trading!
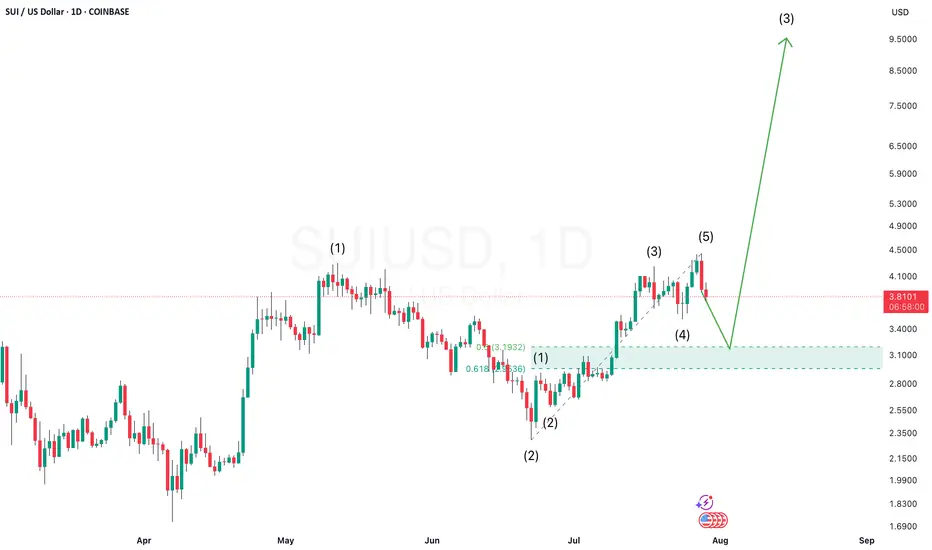
SUIUSD Setting Up for a Potential 1-2, 1-2 Pattern — Wave 3 BlasSUIUSD appears to be forming a classic 1-2, 1-2 Elliott Wave setup — a bullish structure that often precedes an explosive third wave rally.
In this pattern, we first see a motive Wave 1 followed by a corrective Wave 2, then another smaller-degree Wave 1 and 2 within the larger Wave 3. This kind of nested structure shows strong underlying bullish momentum building up in layers.
Once the second minor Wave 2 completes, SUI could launch into a powerful third wave of Wave 3, typically the strongest and most extended move in the sequence. That’s the breakout phase where price accelerates rapidly, often leaving late buyers behind.
Watch for confirmation
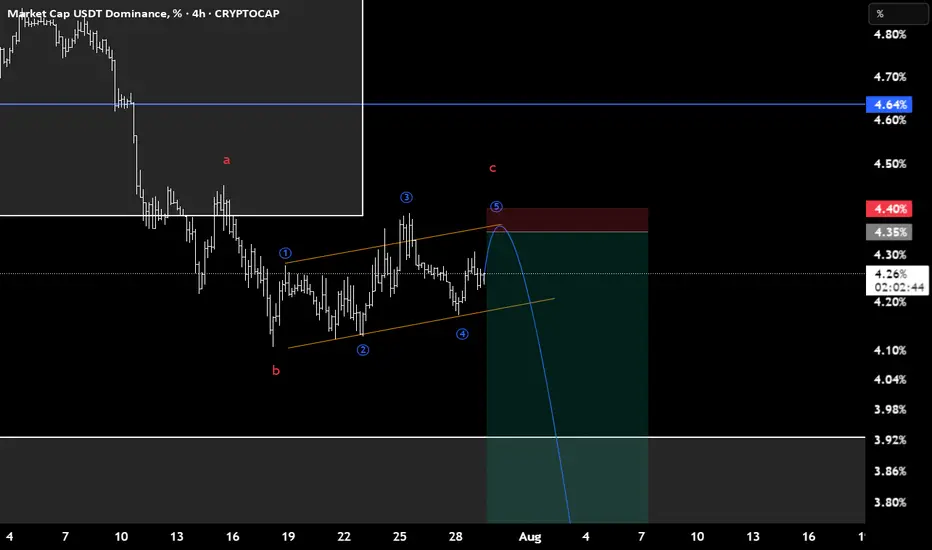
USDT.D(based on NEo wave)I consider this branch as a flat and c wave is the terminal with 3rd extended.
stop loss is 4.4.
Doge(based on NEo wave)confirmation of finishing the E wave of triangle is here now.
it takes about 400 days for all targets to pass.
see the related last chart of doge.

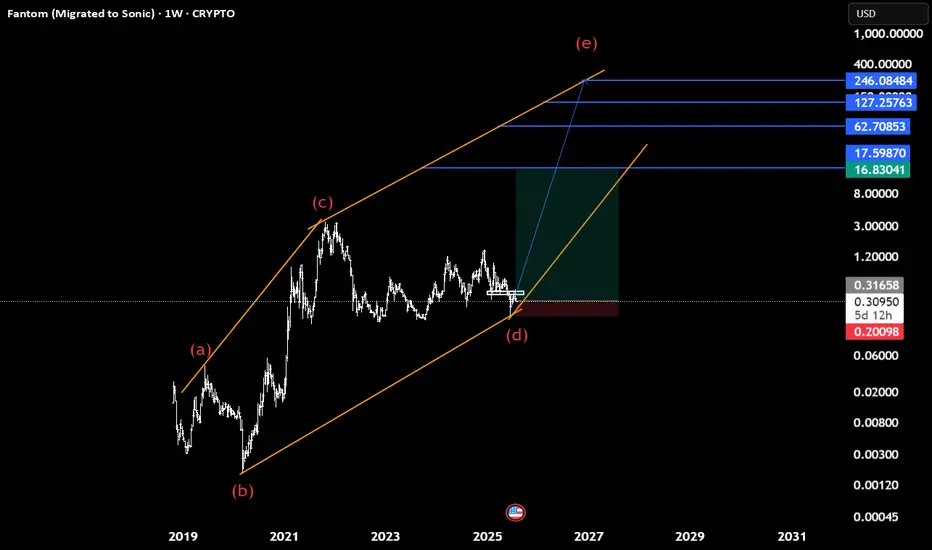
Sonic(based on NEo wave)Soon Sonic will start heavy bullish waves to the targets which shown with blue lines.
95% it is a diamnod diametric and we cant consider this as descending triangle because there is no overlap between wave d and a.
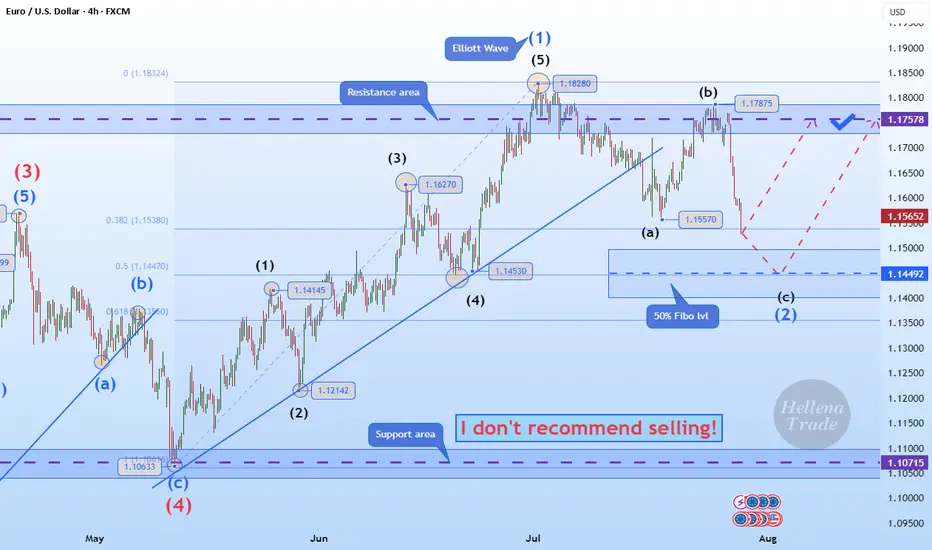
Hellena | EUR/USD (4H): LONG to the resistance area 1.17578.Colleagues, the price has made a strong downward movement, which can only mean one thing: the correction is not complete.
This means that the latest upward movement is wave “1” of medium order.
Therefore, I now expect the correction to end in wave “2” at the 50% Fibonacci level and thean upward movement to continue to at least the resistance level of 1.17578.
It is quite possible that after updating the level of 1.15570, the price will immediately begin an upward movement — this is a more risky option for entering a position.
Manage your capital correctly and competently! Only enter trades based on reliable patterns!
XRP: PullbackRipple’s XRP has once again seen a significant pullback since last Monday, raising the possibility that the high of turquoise wave B may already be in. For now, however, we continue to allow room for this corrective move to extend up to resistance at $4.09, before turquoise wave C drives the altcoin lower toward the magenta wave (2) low. With XRP still trading well above the $0.38 support level, the next upward impulse—magenta wave (3)—should then begin to take shape. Alternatively, there is a 33% chance that this bullish move has already started; however, this scenario would only be confirmed by a decisive break above the $4.09 level.
📈 Over 190 precise analyses, clear entry points, and defined Target Zones - that's what we do (for more: look to the right).

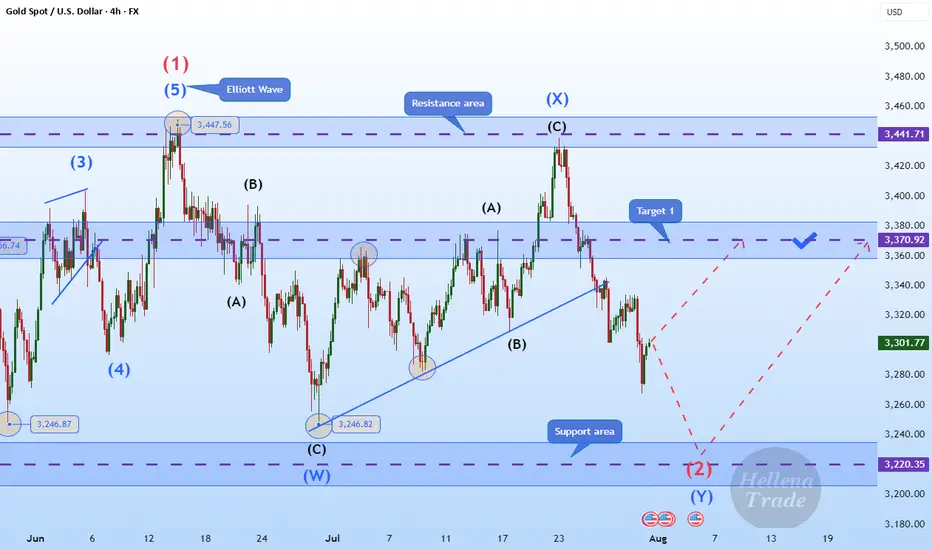
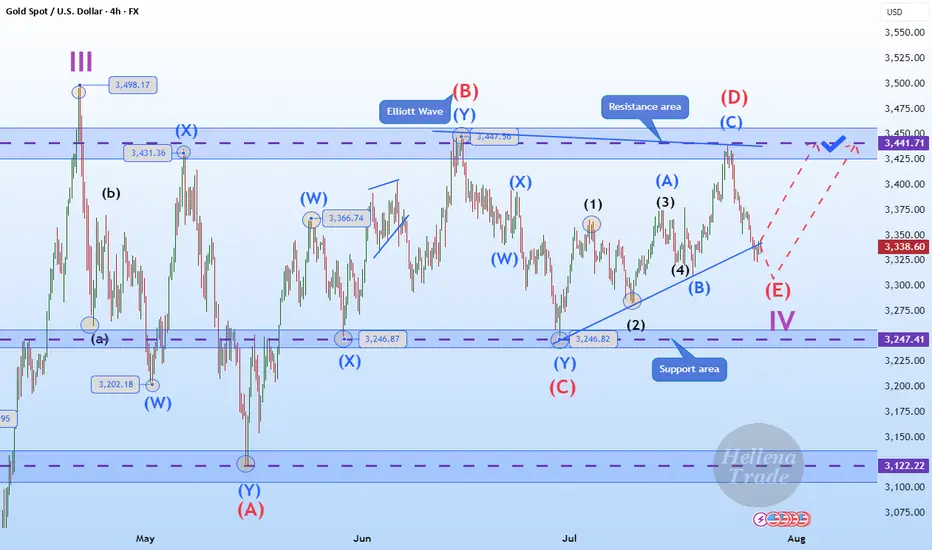
Hellena | GOLD (4H): LONG to resistance area of 3440 (Wave V).As you can see, everything turned out to be more complicated than I had previously thought. We are dealing with a complex correction and a diagonal. I believe that the “ABCDE” waves, which make up the corrective wave “4”, are completing their levels, and I continue to expect the upward movement to continue.
The first area I expect is the resistance area of 3440. This will be the beginning of the large upward wave “V.”
Manage your capital correctly and competently! Only enter trades based on reliable patterns!
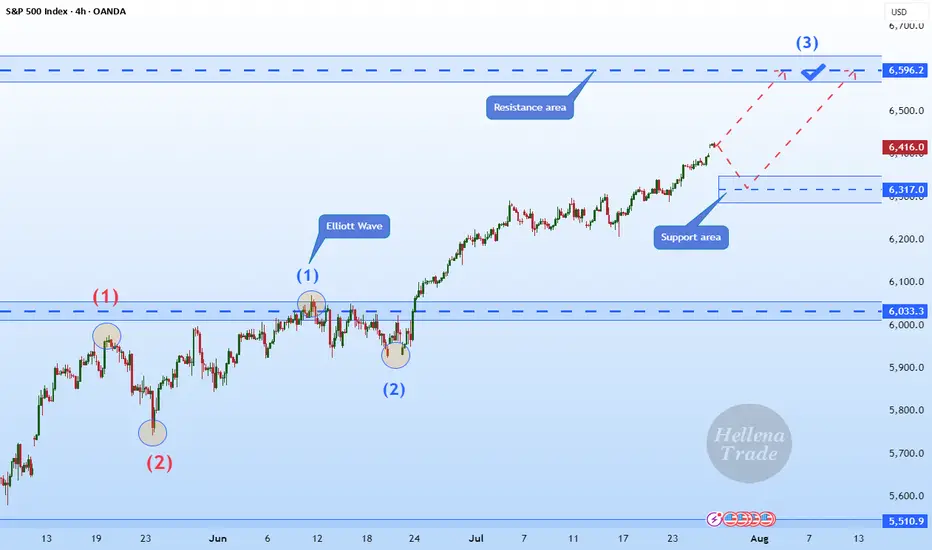
Hellena | SPX500 (4H): LONG to resistance area of 6596 .Dear colleagues, I haven't made a forecast for the SNP500 in a long time and was waiting for a correction, but it seems that a major correction is not yet close, and at the moment the price continues to be in an upward five-wave movement.
Therefore, I believe that we should expect to reach the 6596 area, which will mark the end of the medium-term wave “3.”
The corrections are not very deep at the moment, but the price may reach the 6317 area before continuing its upward movement.
Manage your capital correctly and competently! Only enter trades based on reliable patterns!
$VET Vetchain - A very generous Bullish scenario (ShortTerm)NOT FINANCIAL ADVICE
This is a very generous idea that considers the bullish scenario for $VET.
The risk/reward ratio is 7.5 (317% upside vs42.5% downside).
However, this is only due to the really high beta that NYSE:VET posits.
It's a risky trade, sure, but the rewards are sweet -- if this plays out.

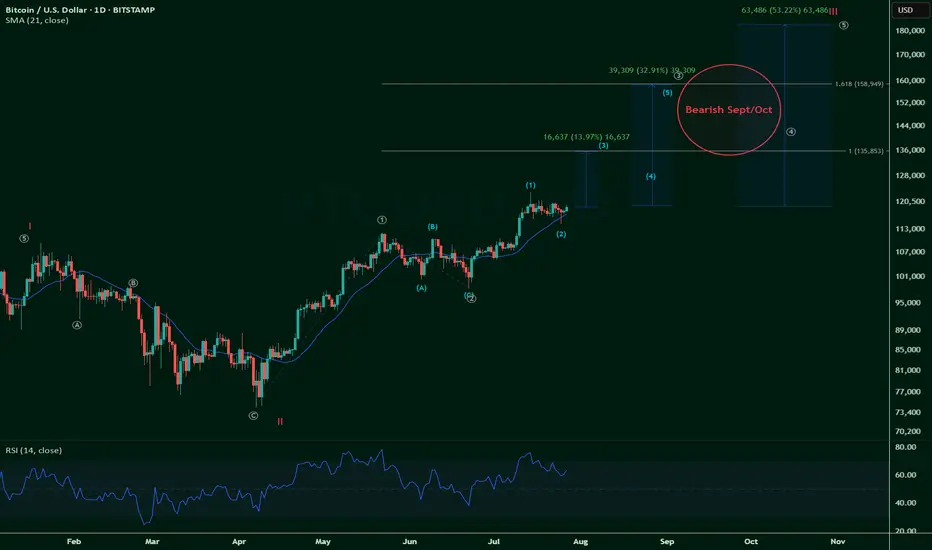
$BTCUSD - Bullish 2025 - Cycle Wave III up (eta Dec2025)NOT FINANCIAL ADVICE
Let's start with this bullish outlook on Bitcoin and its various phases:
Here, I estimate the likelihood of CRYPTOCAP:BTC 's journey through its Cycle Wave III.
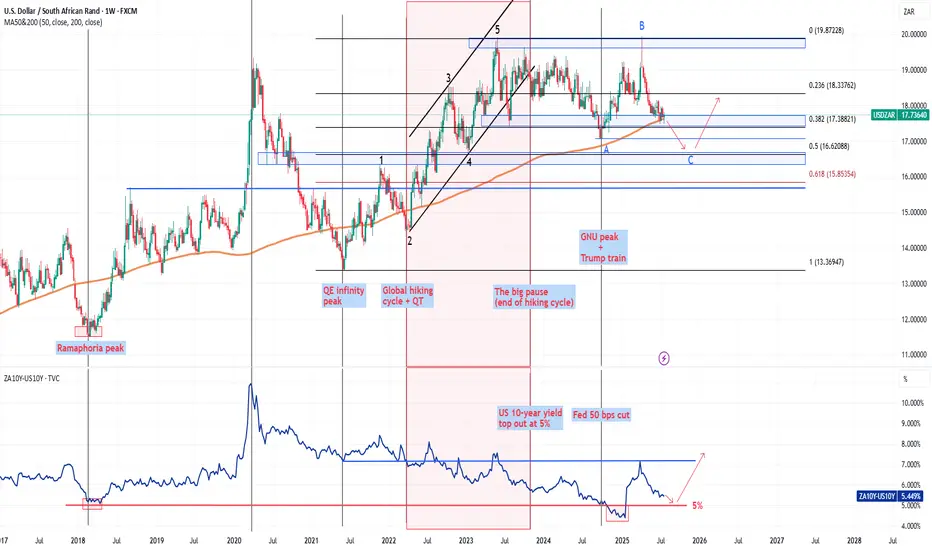
The dance between the USDZAR and (ZA10Y - US10Y)The chart shows the relationship between the USDZAR and the yield differential between the SA 10-year and the US 10-year (ZA10Y – US10Y).
2025 has been a wild ride for the rand and it has managed to put up a remarkable recovery in the 2Q2025 but where to now for the pair? The pair has not traded below the 200-week MA currently at 17.62, since the March 2022 just before the global rate hiking cycle. The only previous times the pair traded below this moving average was briefly in 2021 before the June/July riots in SA and during the “Ramaphoria” period in 2018.
The 200-week MA also coincides with the 38.2% Fibo retracement from the low in 2021. A brief break below these two support levels will allow the pair to fall onto the 50% Fibo retracement level at 16.62. The yield differential is however suggesting that the rand may not have much room to pull the pair too far below the 200-week MA. The brief break below the 5.00% during December 2024 and January 2025 was a bit of an anomaly given the volatility in the US bond market and I still believe 5.00% is a hard support for the yield differential. A bottom out of the yield differential could see it rise higher towards 7.50% which will be rand negative should the positive correlation hold.
To summarise, the yield differential is suggesting that the rand’s 2Q2025 recovery may be on its last legs but a break below the 200-week MA will allow the rand to pull the pair towards 16.50. I don't see the rand maintaining levels below 16.50 and this level seems like a long-term floor for the pair before another 5-wave impulse to the topside.
Historical trend analysis:
The SA rand is one of the most attractive emerging market currencies due to the carry trade appeal of the currency coupled with SA’s deep and liquid bond market. During periods when there is significant buying pressure on SA bonds, the SA yields will decrease meaning that the yield differential (ZA10Y-US10Y) decreases while in periods when SA bonds are selling off, yields on SA bonds will increase which increases the yield differential, citrus paribus. The USDZAR pair is thus positively correlated with this yield differential.
The chart goes back to 2018 when the USDZAR hit a low of 11.50 following the period dubbed the “Ramaphoria” period. Investor sentiment swinged aggressively positive in this period and the flow of international funds into the SA bond market saw the yield differential drop to a low around 5.00%. The yeld differential has never dropped below this level until early 2025 as indicated on the chart.
The yield differential and the USDZAR pair moved in tandem all the way through to the 1Q2022, maintaining its strong positive correlation. The next period marked the start of the global hiking cycle which saw the US 10-year yield rise from a low of 1.65% in March 2022 to a high of 5.00% in October 2023. This aggressive rise in US 10-year yields marked a period of extensive risk off sentiment and even caused a US banking crises in March 2023. The Fed stepped in and briefly paused their QT to add liquidity to system and provided the US banking system with the bank term funding program to patch up the cracks. The rand sold off due to risk off investor sentiment while the US 10-year yield rose due to the start of the rate hiking cycle which reduced the yield differential. The USDZAR climbed to a high of 19.90 in May 2023 while the yield differential dropped to a low of 7.50%. The yield differential continued to fall until the US 10-year yield topped out at 5.00% in October 2023, after which the positive correlation between the USDZAR and the yield differential was restored.
The next period marked positive sentiment towards SA following the election results and the formation on the government on national unity (GNU). Coupled with the end to the rate hiking cycle, the rand had the wind and risk on investor sentiment in its sails which allowed the rand to pull the pair to a low of 17.03. The optimism of the GNU and the realisation on another Trump presidency however saw the pair bottom out in September 2024. During the last quarter of 2024 the rand experienced sustained selling pressure while the yield differential continued to fall. The break in correlation was largely due to the US10-year yield climbing from 3.60% in September 2024 to a high of 4.80% in January 2025.
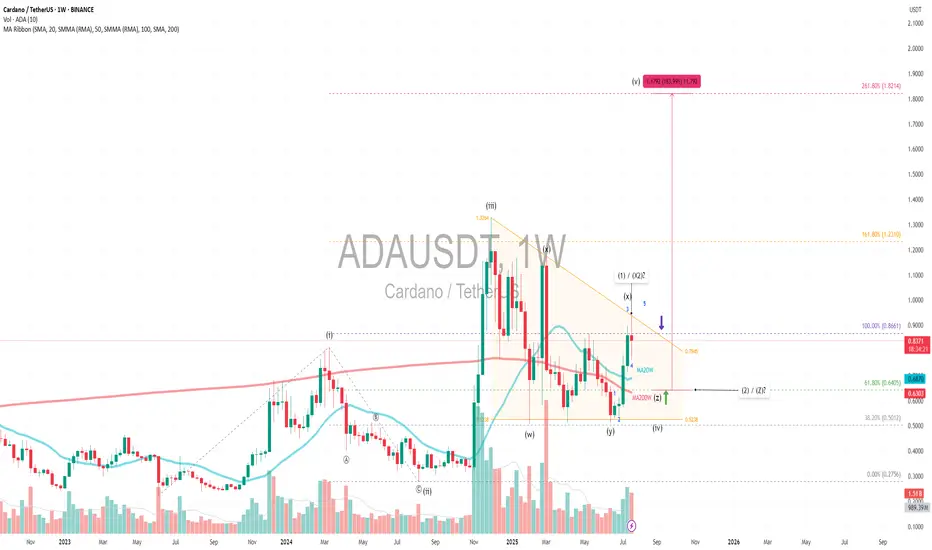
ADAUSDT|Triangle Setup WXYX2Z (1-2) +180% - Revisit $1.82 TargetPrimary Pattern: A contracting triangle within a larger corrective structure, likely wave 4.
Wave Count: A diagonal 5-wave impulse (i–v), followed by a WXY (X2) Z complex correction, suggesting wave 4 is still unfolding, possibly nearing completion.
Current Price: $0.83 with volume and SMA ribbon golden crosses showing bullish signal and near completion of accumulation phase.
Fibonacci Extension:
Targeting diagonal wave 5 at 261.8% extension from the base of wave 1 aligns with the projected target of $1.82, which matches the height of the triangle target. This also coincides with a +180% move from the possible upcoming wave Z or wave 2 —technically ambitious, but plausible if wave 5 kicks off with momentum.
Wave 4 Triangle Context:
The WXY(X2)Z structure implies a complex sideways correction which is typical of wave 4 behavior 1.6x - 2x wave 2 time extension
Key Support:
Entry: If X or 1 is nearing completion, and triangle support holds at key support MA20W Fibonacci 61.8%, the breakout into wave 5 could be explosive—especially with diagonal structure suggesting a leading diagonal pattern.
SL: Triangle Support is the last liquidity / smart money entry
Always trade with affordable risk and respect your stoploss!
BTC(based on NEo wave)This range price is shown as a bow-tie diametrical.
I think G wave will end at one of those prices, 113 or 116
after this it will start a good bullish wave.
stop loss is 110K and the first target is 138K.
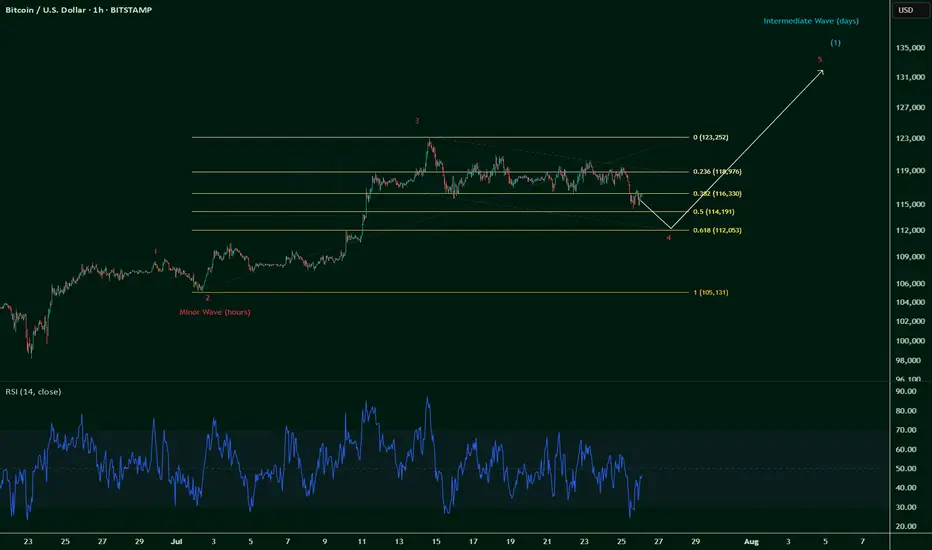
$BTC Wave 4 correction completed -- alternate count.This is not financial advice.
In my previous post, I suggested that Minor Wave 4 could go all the way down to 0.618 fib:
However, after doing a deeper dive into the long squeeze in the last day and looking at its recovery, I think CRYPTOCAP:BTC has completed its corrective Minor Wave 4.
This means that we're looking up towards an impulsive Minor Wave 5.
If Minor Wave 5 completes, in my bullish main Elliot Wave count, we would get a full picture for Intermediate Wave 1.
We would then be able to expect an Intermediate Wave 2 correction.
However, while Wave 2 usually corrects 0.618 fib, this time round, CRYPTOCAP:BTC has shown inclination and strength to correct between 0.236 and 0.328 levels.
And then we will be making that Impulsive Wave 3 up.
That will be bonkers.

$BTC breaks $115k invalidates Wave 5 -- still Wave 4 correction.So it was a long squeeze after all, and one that was coming.
The initial thoughts were that we're on a Wave 5 up and counting:
But we're brought back down to earth as CRYPTOCAP:BTC breaks below $115k, invalidating a Wave 5 count.
So, it's official: we're still on a Wave 4 correction, which can go as low as 0.618 fib towards $112k.
Now painting a likely scenario given that Wave 2 correction only moved 0.236 fib ~ 0.328 fib (Wave 2 & Wave 4 often contrast):
This could play out till end July or even all the way into early August, which if comes to fruition, could signal for a bullish August.
And August has historically almost always been a bearish month (8 red historical months out of 12).
Pinch me.