Airbnb: Downtrend Set to Resume SoonSince our last update, Airbnb has experienced a rebound, which diverted the stock from the anticipated sell-off. However, the price is expected to soon resume its downward trajectory and, as the next key step, break through support at $108.60. This move should complete turquoise wave 3, with all subsequent waves of this downward impulse likely to unfold below this level. Ultimately, the stock is expected to finish the broader correction of the beige wave II.
📈 Over 190 precise analyses, clear entry points, and defined Target Zones - that's what we do.
Elliotwaveanalysis

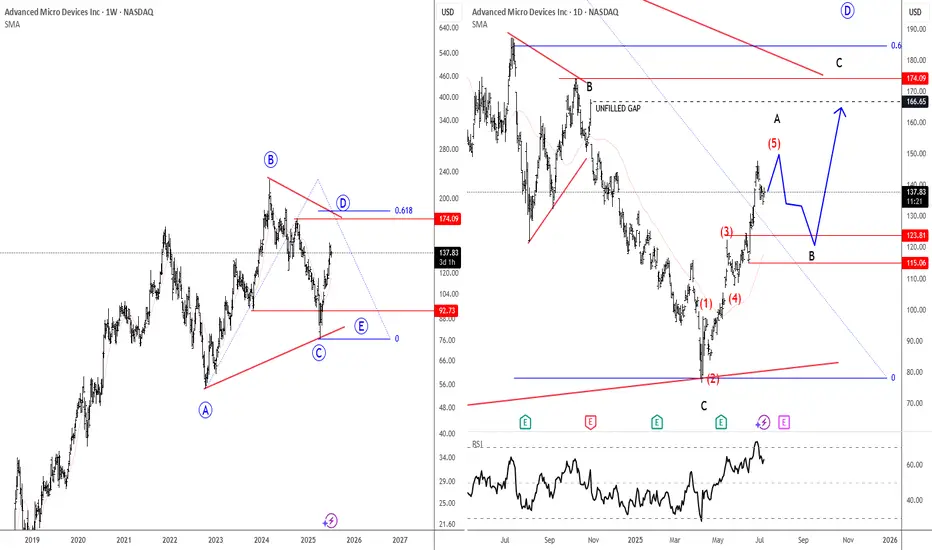
AMD: Elliott Wave Cycle Shows Impulsive RecoveryAMD has seen a deep retracement from its 2024 highs, but it now looks like the stock is trying to stabilize. However, a straight push to new highs may not be likely just yet, as we’re still tracking an ongoing running triangle—an A-B-C-D-E pattern.
Looking at the daily chart, things do look promising for more upside into wave D as we’re seeing a clean five-wave move up on the lower time frame, suggesting we may be in wave A of that D-leg. After a pullback, there could be some very interesting opportunities on the long side.
Support levels on dips to watch are around 115 and 123, while upward projections for this three-wave D-leg rally could be toward the 166 gap area and potentially 185.
Highlights:
Direction: Up after pullback
Support: 115–123
Upside projection: 166 (gap), 185
Grega
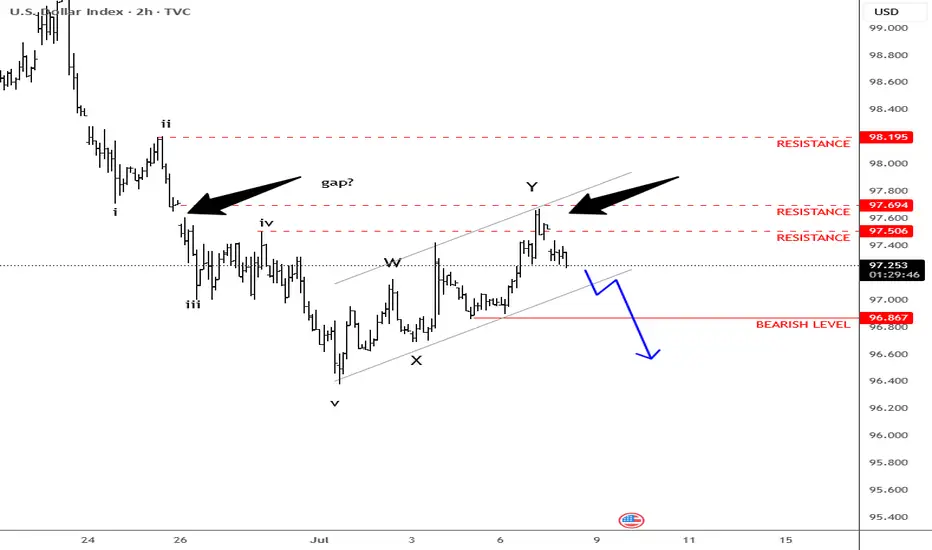
Dollar Index-Stops At Gap ResistanceAfter just a temporary setback in stocks and a brief move higher in the dollar earlier this week, we’re once again seeing a strong reversal across the board. This comes after Donald Trump extended the July 9th tariff deadline to August 1st, giving more time for trade negotiations with various countries. That brought some optimism back into the markets, and if stocks continue to gain, the dollar index is likely to remain in its downtrend.
In fact, the dollar index stopped right at the June 26th gap near the 97.70 resistance level. We believe that the corrective price action from July 1st could now be coming to an end, and the market may resume lower—especially if we get a breakout below the corrective channel support near 97.
GH
Technical Analysis: Price Breakout and BeyondHello Friends,
Welcome to RK_Chaarts,
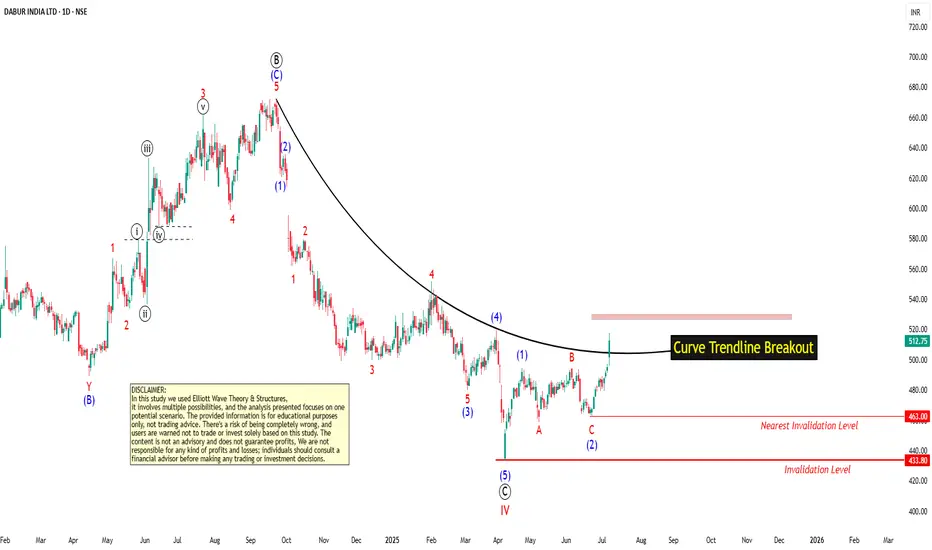
Let's try to analyze a stock from the FMCG sector, "Dabur India Limited".
Elliott Wave perspective.
We can see that the correction is completed, which is the IVth wave of the monthly time frame of cycle degree in Red. Now, possibly the impulse wave Vth had start unfolding. If we go inside that, we'll see its five sub-divisions in black, labeled ((1))-((2))-((3))-((4))-((5)) of primary degree.
Possibly, wave ((1)) has started unfolding, and within wave ((1)), we'll see five sub-divisions in blue, which is the intermediate degree. Within this, waves (1) and (2) looks complete, and wave (3) has started, which has also broken out of the curve line.
Invalidation level
If our wave counts are correct, the bottom level of wave IV, which is 433, will be our main invalidation level. If the price goes below this level, it will trigger the invalidation level. If that happens, we'll need to re-analyze the chart from a wave count perspective.
But if the price stays above this invalidation level, then our view, which is based on the analysis, will remain bullish, and the chart will remain bullish.
Projected Target
As per Elliott wave theory, it can show new ATH in Long Term, only if Invalidation level is not breached.
Breakout with good Intensity of Volumes
The breakout has a good intensity of volume. The volume in the breakout candle is looking very good, which is 3-4 times higher than the average. This means that market participation is very good during this breakout. So, Conviction is high on this breakout.
We can clearly see that the price has closed above the 50 Exponential Moving Average (EMA), 100 EMA, and 200 EMA, which is a very good sign that the price has overcome all these hurdles along with Breakout.
Now, if there are any hurdles above, they could be the 200 EMA on the weekly time frame, which is coming near the level of 529, and the 50 EMA on the monthly time frame, which is coming near the price of 527. Currently, the price is trading around 513.
Once it crosses 529 or 530, it may show even more strength after that.
Dow Theory Trend confirmation
Based on Dow Theory, if we observe, the price which was falling and making lower highs and lower lows, has now started forming a Higher High and Higher Low pattern on the daily time frame, which is again a sign of bullishness.
Standard Deviation crossed
Price is trading above the mid-Bollinger Band on the weekly time frame, i.e., in the bullish territory. On the daily time frame, Prince has also crossed the upper Bollinger Band, meaning it has broken out and is expanding above the upper Bollinger Band, which is a bullish sign
Supporting Indicators
On the daily time frame, a very good breakout is visible inside RSI, and is also moving above 72. Additionally, on both the daily and weekly time frames, the MACD has given a positive crossover.
Before making any trading decisions, please conduct your own analysis or consult with a technical expert or financial consultant.
I am not Sebi registered analyst.
My studies are for educational purpose only.
Please Consult your financial advisor before trading or investing.
I am not responsible for any kinds of your profits and your losses.
Most investors treat trading as a hobby because they have a full-time job doing something else.
However, If you treat trading like a business, it will pay you like a business.
If you treat like a hobby, hobbies don't pay, they cost you...!
Hope this post is helpful to community
Thanks
RK💕
Disclaimer and Risk Warning.
The analysis and discussion provided on in.tradingview.com/u/RK_Chaarts/ is intended for educational purposes only and should not be relied upon for trading decisions. RK_Chaarts is not an investment adviser and the information provided here should not be taken as professional investment advice. Before buying or selling any investments, securities, or precious metals, it is recommended that you conduct your own due diligence. RK_Chaarts does not share in your profits and will not take responsibility for any losses you may incur. So Please Consult your financial advisor before trading or investing.
Hellena | EUR/USD (4H): LONG to the resistance area 1.20000.Colleagues, I believe that the upward impulse is not over yet. Wave “3” of the higher order and wave “3” of the lower order are just completing their movement, and I think that at the moment it is worth looking at the resistance area of 1.20000.
This is a very attractive psychological level where wave “3” could complete its upward movement.
Manage your capital correctly and competently! Only enter trades based on reliable patterns!
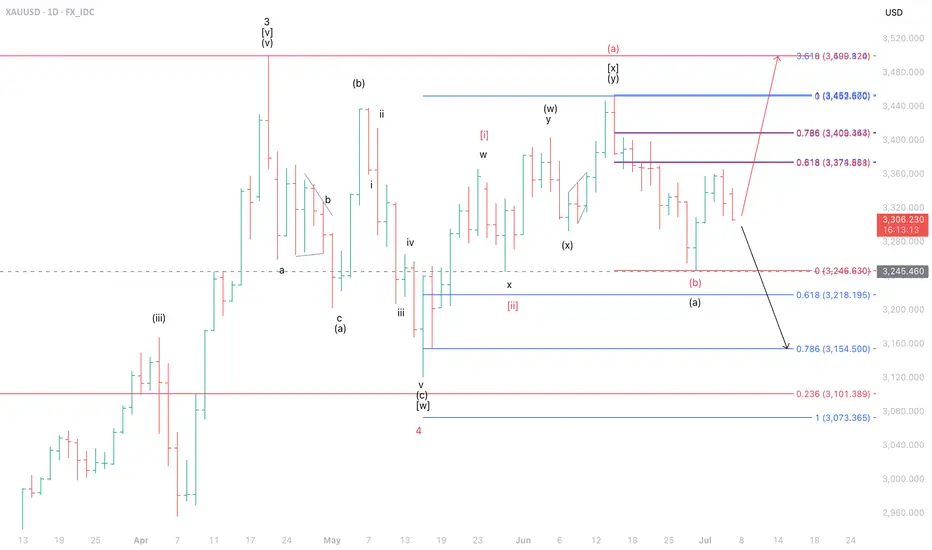
XAUUSD at a CrossroadsOn the daily timeframe, we identify two possible scenarios for XAUUSD. Under the red label, as long as XAUUSD remains above the 3,245 level—serving as a stop-loss—there is potential for further upside to test the 3,378–3,500 area.
However, in the worst-case scenario illustrated by the black label, if XAUUSD breaks below its key support, the next downside target would be in the 3,154–3,218.
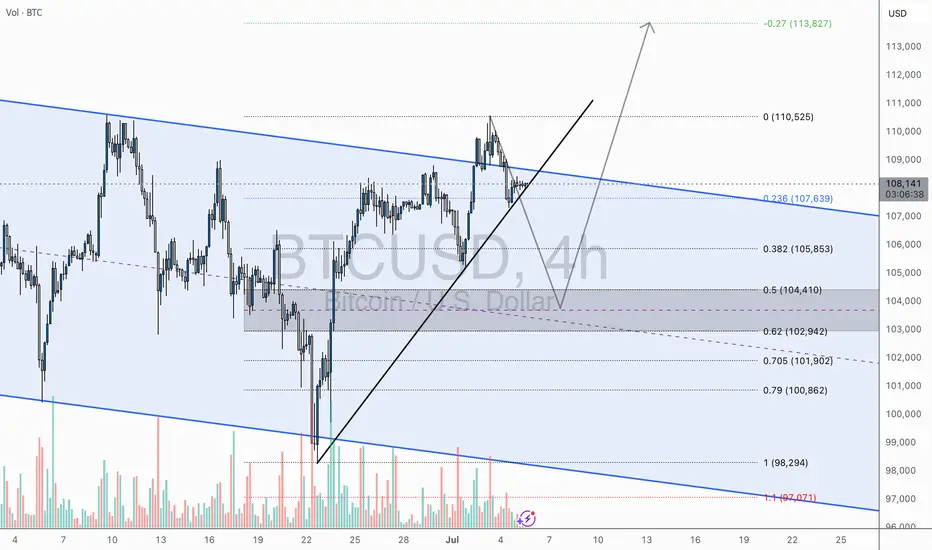
BTC/USD – Pullback Before Moonshot?4H Outlook by WrightWayInvestments
Bitcoin just delivered a textbook breakout from the descending channel and is currently consolidating above the breakout trendline. This is a critical zone where market participants are deciding between continuation or a retest.
🧠 Technical Breakdown:
🔹 Breakout Confirmation – Clean bullish breakout above channel resistance
🔹 Ascending Trendline Support – Currently being tested
🔹 Fibonacci Reload Zone – Between 0.382–0.618 (🟦 $105,853–$102,942)
🔹 Bullish Scenario – Potential higher low before aiming for major fib extension
🔹 Target Zones:
• TP1: $110,525
• TP2: $113,827
🧭 Game Plan:
A retracement into the fib support zone ($104K–$102.9K) offers the highest RR for long entries, ideally on bullish candlestick confirmation + volume spike. A break and close above $108.5K could negate pullback expectations and signal direct continuation.
🔔 Final Note:
Volume expansion on breakout + controlled retrace = power setup.
Let the market come to you — high-probability zones don’t chase.
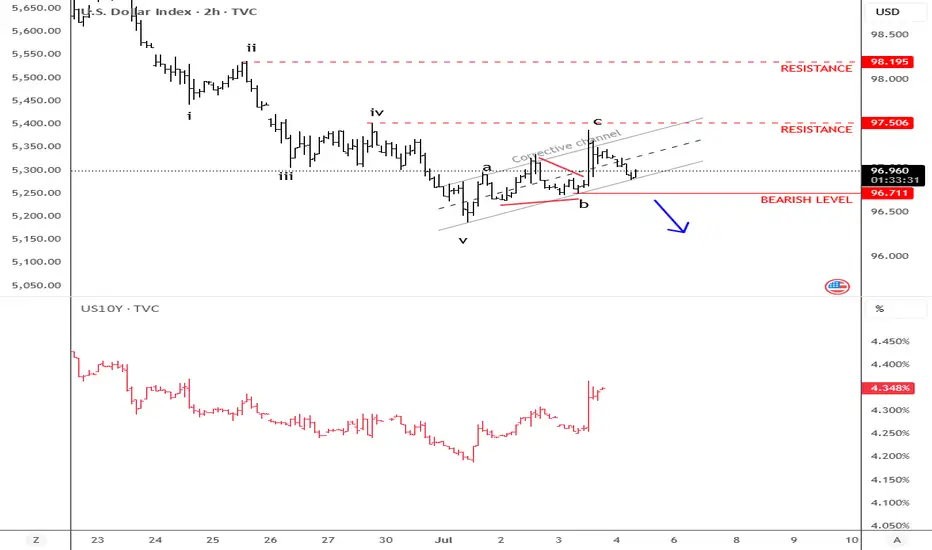
Dollar Testing The Channel Support It’s already Friday and the 4th of July, so US holidays are here, which means we could see thinner trading conditions later today. Still, the overall tone remains risk-on since yesterday, supported by better-than-expected Non-Farm Payrolls data and an ISM services reading at 50.8—still in expansion territory. So, there’s some optimism in the market, and this could continue if we get a positive outcome on the tariff front ahead of the July 9th deadline.
On the back of strong economic data, US yields are moving higher, but the Dollar Index is trying to come lower. It’s currently retesting the lower trendline of a corrective channel—likely due to the strong rally in US stock indexes, which are keeping the dollar under pressure.
On the daily chart, the Dollar Index still looks like it could head to new lows, but that move may not come today if holiday conditions slow down the market. We might have to wait until next week for a clearer breakout.
GH
Ethereum: Eyeing New Highs?Ethereum has surged recently and continues rising in turquoise wave B. The next target is a break above the June high, with potential upside to resistance at $4,107. A direct breakout above this level (27% probability) would suggest green wave alt. ended in April. However, our main scenario expects a reversal below $4,107, with turquoise wave C likely dragging ETH into the Long Target Zone between $935.82 and $494.15 to complete wave .
📈 Over 190 precise analyses, clear entry points, and defined Target Zones - that's what we do.

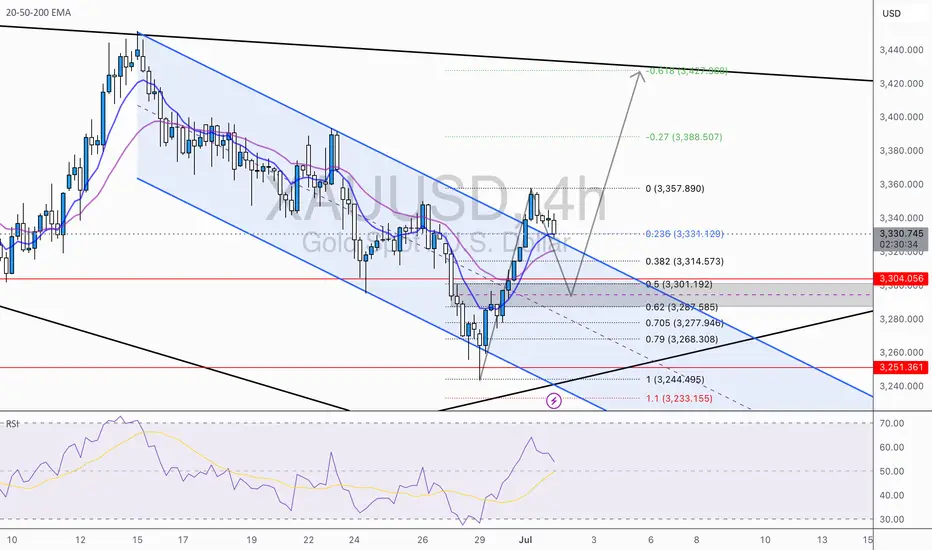
XAU/USD 4H – Retracement or Rejection? Key Levels to WatchGold bulls made a strong push out of the descending channel, but now the real test begins. The market is currently in retracement mode after a sharp impulse, and the next move will be decisive.
🔹 Channel Breakout & Retest in Play:
Price broke out of the descending channel with momentum and hit the $3,357 region before pulling back. We're now hovering around the 0.236 Fib at $3,331 — with the 0.382 and 0.618 Fib zones below offering potential long entry confluence.
🔹 Fibonacci Cluster Support Zone:
Between $3,314 – $3,287 lies a high-probability demand zone, where multiple Fibonacci levels converge with the broken channel top. This area also aligns with the 50 EMA, creating a pocket for bullish continuation — if held.
🔹 RSI Divergence to Watch:
RSI shows signs of slowing bullish momentum after peaking, which suggests this retracement could deepen toward the 0.5–0.618 levels before any meaningful bounce. A bullish RSI reversal in this zone would confirm re-entry.
📌 Scenario 1 – Bullish Continuation:
Price finds support between $3,314–$3,287
Momentum kicks in for a leg up toward $3,388
Final TP at $3,427 (Fib -0.618 extension)
📌 Scenario 2 – Rejection and Deeper Drop:
Failure to hold the 0.5 zone flips the bias bearish
Watch for re-entry back into the previous channel
Next downside target: $3,251 and potentially $3,233–$3,221 (Fib + extension)
💡 Elite Insight:
The pullback is not the risk — entering without a plan is. This is the zone where patience meets precision. Let the levels do the work.
NVIDIA: More Room in Wave BNvidia’s strong rally over recent weeks lifted the stock above resistance at $153.13. Despite a brief pullback on Tuesday, we still expect beige wave B to extend toward $178.39. Afterward, beige wave C should initiate a substantial correction, likely finding its low above $81.98 to complete blue wave (IV). If Nvidia rallies directly through $178.39, that would support our alternative view that blue wave alt.(IV) has already bottomed (37% probability).
📈 Over 190 precise analyses, clear entry points, and defined Target Zones - that's what we do.

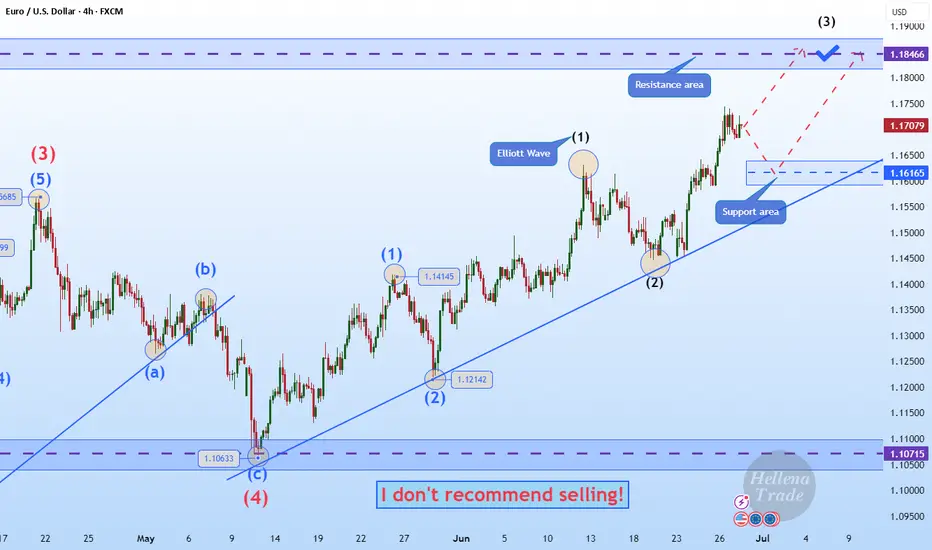
Hellena | EUR/USD (4H): LONG to the resistance area 1.18466.Dear colleagues, I believe that the upward movement continues. The five-wave impulse is not over yet, and I see that the price is now in the upward wave “3” of the higher order and in the upward wave “3” of the lower order.
Therefore, I expect a small correction to the 1.16165 area, after which I expect the price to reach at least the 1.18466 resistance area.
Manage your capital correctly and competently! Only enter trades based on reliable patterns!
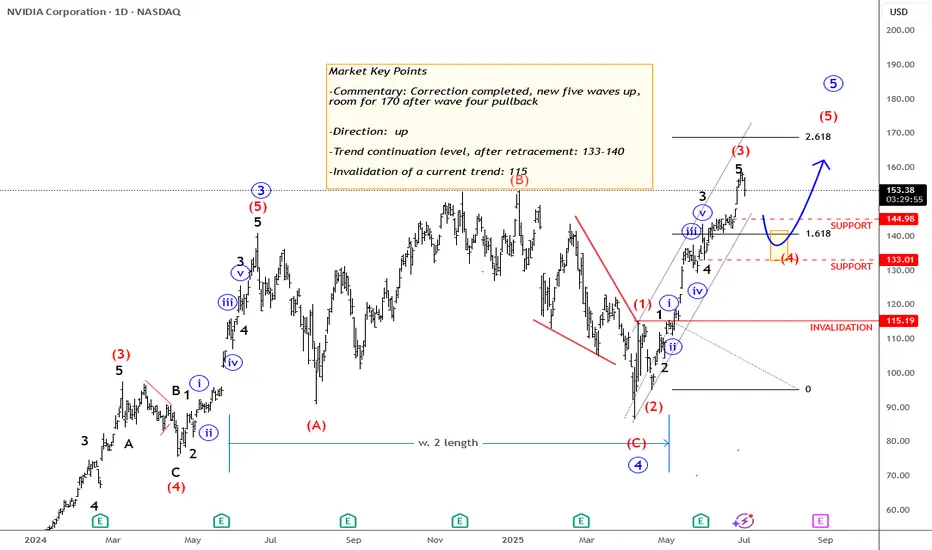
Nvidia - More Upside After Correction NVIDIA completed an irregular flat correction back in April. Since then, the price action has been strong and steady, forming higher highs and higher swing lows —a clear sign of bullish con-
continuation.
From an Elliott Wave perspective, the current move appears incomplete, as we cannot yet identify a full five five-wave advance from the April lows. This suggests that more upside may still be ahead.
However, we could see a wave four pullback develop sometime during the summer. If that occurs, the key support zone to watch would be around $140 down to $130, which could provide
an opportunity within the ongoing uptrend.
- Resistance: 170
- Support: 143 / 132
- Invalidation: 115
GH
NASDAQ: Minor Pullback, Still on TrackOn Friday, the Nasdaq experienced a slight pullback, which was quickly absorbed at the start of the week. Currently, the index is still developing the turquoise wave B, which should top out just below resistance at 23,780 points, signaling the start of the bearish wave C. This move should lead to the low of the magenta wave (4) within our turquoise Target Zone between 17,074 and 15,867 points. Alternatively, there is a 42% probability that wave alt.(4) is already complete. In this scenario, the magenta wave alt.(5) could carry the index immediately above the mentioned resistance.
📈 Over 190 precise analyses, clear entry points, and defined Target Zones - that's what we do.

GOLD - next wave up soon...Updated Wave Count... still holding long...
Wave (ii) in yellow is possibly nearing completion.
3200 should limit any move to the downside.
previous wave count...

S&P500: Target Zone DeactivatedThe S&P 500 extended its bullish trend yesterday, moving beyond our now-deactivated (formerly magenta) Target Zone. Existing positions remain intact, as the stop set 1% above the upper boundary has not been triggered. In our updated primary scenario, we anticipate continued upward movement within magenta wave (B), potentially reaching the resistance at 6675 points. Once this peak is established, we expect a corrective decline to begin in the form of wave (C), which should guide the index into the green Long Target Zone between 4988 and 4763 points. There, the larger green wave is expected to complete. A sustained breakout above the 6675-point level would shift the outlook in favor of the alternative scenario. In that case, green wave alt. would be considered complete—a trajectory we currently assign a probability of 40%.
📈 Over 190 precise analyses, clear entry points, and defined Target Zones - that's what we do.

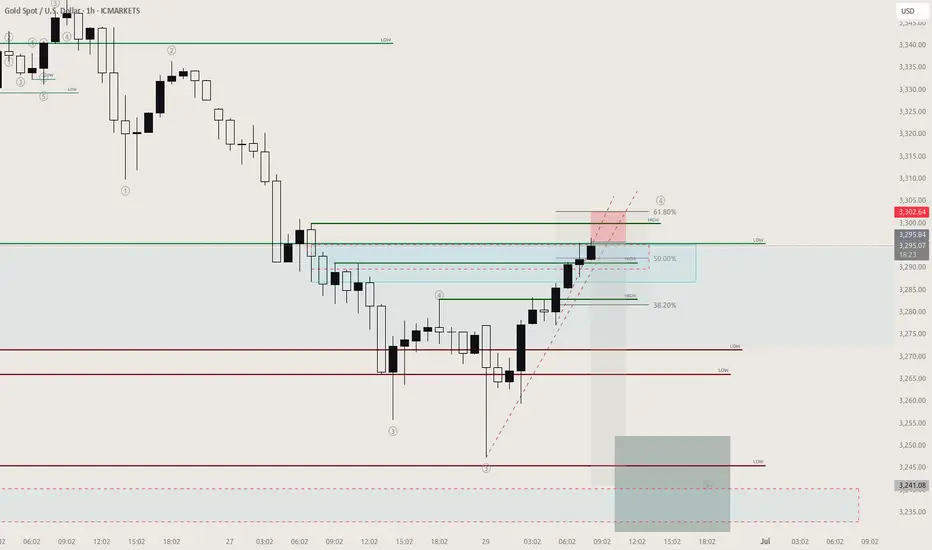
XAU/USD – Bullish Reversal in Motion? Watch the Breakout ZoneGold just gave us a critical reaction off a key confluence zone — and bulls might finally be waking up. Here's the breakdown:
🔹 Falling Wedge Breakout:
Price respected the wedge support beautifully around the 0.382-0.5 Fib retracement and has now closed above the upper descending trendline. The falling wedge is a bullish reversal pattern, and we may be witnessing the early stages of a trend shift.
🔹 EMAs Realignment Pending:
Price is now testing the 20 and 50 EMAs — a clean break and close above them would likely trigger algorithmic momentum back into bullish continuation, especially if we see a flip of the 0.382 Fib at $3,324 as support.
🔹 Upside Targets:
* TP1: $3,372 (0.236 Fib)
* TP2: $3,450 (previous structure high)
* TP3: $3,539 (full range expansion)
🔹 Invalidation Below:
A break back inside the wedge and below $3,285 would invalidate the bullish bias and likely open the path to deeper correction toward $3,251 or even $3,217.
📌 Key Insight:
The best trades aren’t about prediction — they’re about preparation. This setup is all about reacting to price as it confirms. Let the market tell you when it’s ready to move, then strike with confidence and precision.
💡 Watching for bullish retest + volume confirmation before entering long.

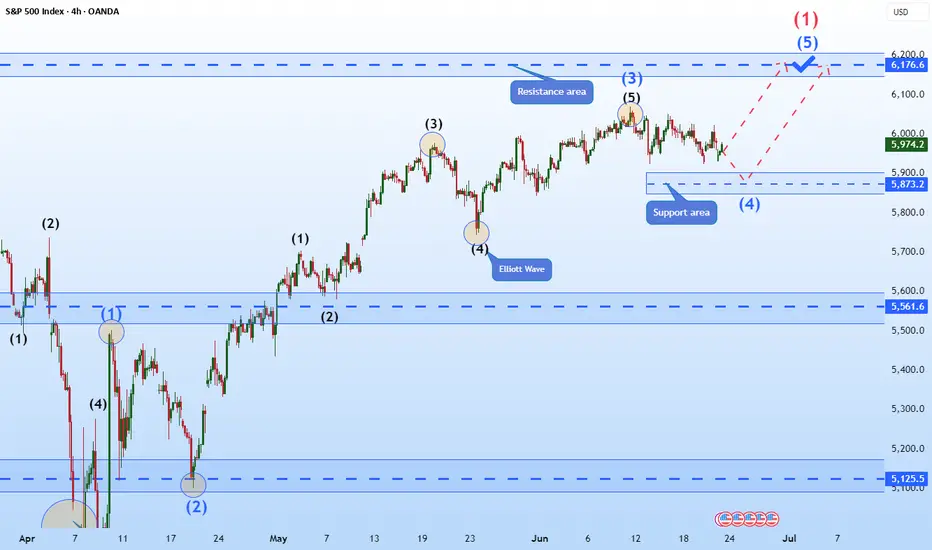
Hellena | SPX500 (4H): LONG resistance area of 6176 (Wave 1).Colleagues, the previous forecast remains essentially unchanged, and the target is still 6176, but I think the forecast can be updated because the price has been flat for quite some time.
I still expect the upward movement to continue in the large wave “1” and in the medium-order wave “5”.
A small correction to the support area of 5873 is possible.
Manage your capital correctly and competently! Only enter trades based on reliable patterns!
Nasdaq: At the Upper EdgeYesterday, the Nasdaq climbed above resistance at 22,475 points. Currently, the index is positioned outside our turquoise Target Zone (coordinates: 21,751 – 22,425 points), which remains active. Stops for short positions 1% above the zone have not yet been triggered. Our primary scenario remains intact for now: technically, there is room for wave B to reach the next resistance at 23,229 points. Following the B-wave peak, a downtrend is expected with the corrective wave C. With a 42% probability, we anticipate that wave alt.(4) is already complete, and the index may break directly higher within the magenta-colored wave alt.(5), surpassing the 23,229-point mark.
📈 Over 190 precise analyses, clear entry points, and defined Target Zones - that's what we do.

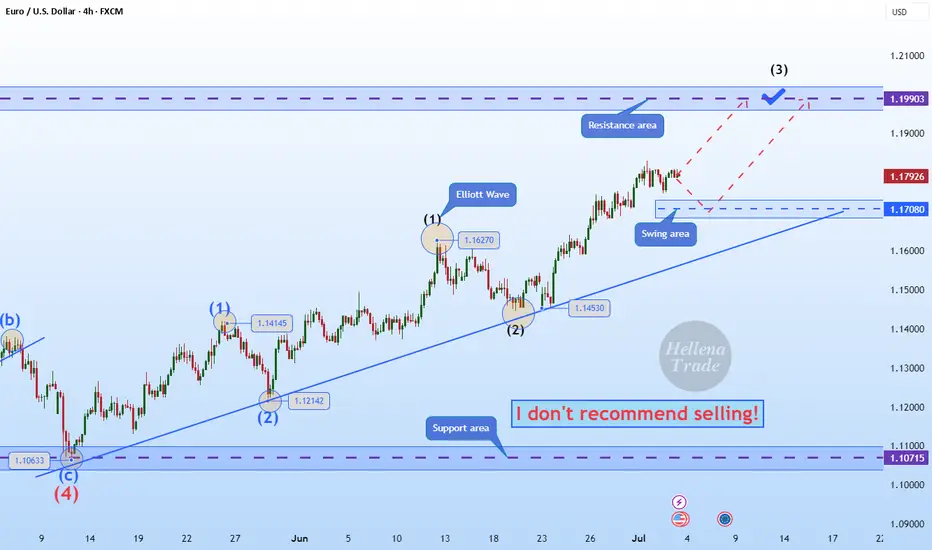
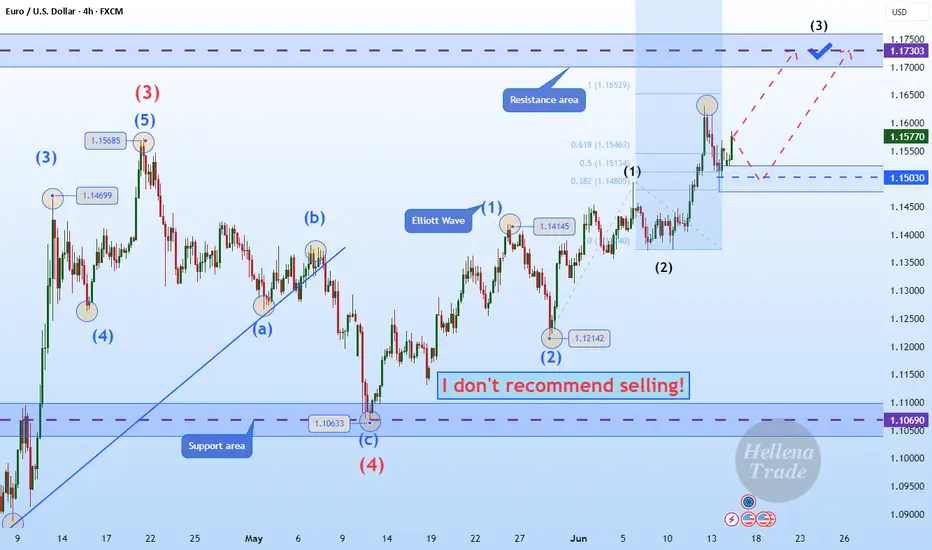
Hellena | EUR/USD (4H): LONG to the resistance area 1.17300.Colleagues, I believe that the upward five-wave impulse is not over yet. At the moment, I see the formation of wave “3” of the lower order and wave “3” of the middle order, which means that the upward movement will continue at least to the resistance area of 1.17300. This area is located between two levels (1.16529-1.18252) of Fibonacci extension.
A correction is possible — be careful.
Manage your capital correctly and competently! Only enter trades based on reliable patterns!
₿itcoin: Grinding higherBitcoin has extended its recent rally, reclaiming the $106,000 level in the last few hours. While short-term setbacks remain possible, our primary scenario continues to point higher: prices should aim for the upper blue Target Zone between $117,553 and $130,891. Within this zone, BTC should complete green wave B before initiating a corrective decline in wave C, which should extend into the lower blue Target Zone between $62,395 and $51,323. At the low of major wave a, a temporary recovery in wave b is likely, preceding the final downward push that should mark the end of the broader wave (ii) correction. Our alternative scenario (30% probability) suggests that Bitcoin remains within blue wave alt.(i). If true, a breakout beyond the upper blue Target Zone could occur.
📈 Over 190 precise analyses, clear entry points, and defined Target Zones - that's what we do.

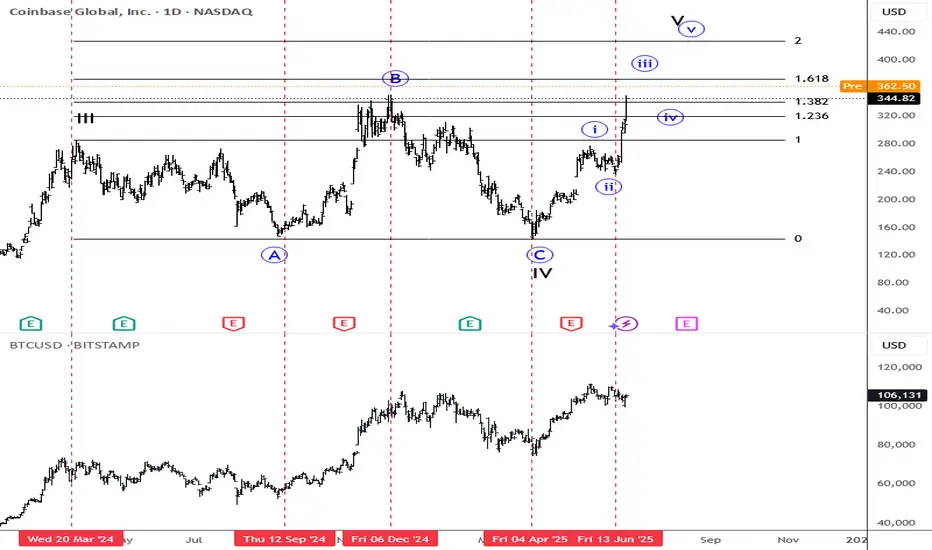
Coinbase Breaking Higher, Bitcoin To Follow Soon? Coinbase has been trading very nicely to the upside over the last two weeks, and it's now even breaking the previous highs from December in pre-market. This suggests we’re in a fifth wave, but even this leg should be structured by five waves, so there’s room for more upside—even above the 400 level. If we respect the past cycles and compare it with Bitcoin, then clearly Bitcoin is lagging here. Still, while Coinbase is in this bull run, sooner or later, Bitcoin should also join the strength.