USD/CHF – Rejection at Key Fib Confluence, Bearish Continuation We’re seeing a beautiful textbook rejection off the 0.79Fib zone (0.8200), precisely where price tapped into a previous structure break and minor supply block. Price surged into the red zone, wicked just above the 200 EMA, and was instantly met with heavy sell-side pressure — a strong signal of institutional distribution.
📌 Technical Confluences at Play:
Price failed to break the 200 EMA cleanly — acting as dynamic resistance.
0.79 Fib levels aligning with prior supply.
Rising wedge structure broken to the downside.
Entry candle printing a solid engulfing rejection — institutional footprint.
📉 Target Zone:
Primary TP sits at the 0.236 Fib level (0.8101), but the full measured move of this wedge gives us a final downside target near 0.8038, with intermediate stops at key Fibs. Invalidation above 0.82294
🧠 Trader’s Insight:
“Patience is power. You don’t chase moves, you position for moments.”
Let the market come to your zone of interest, validate your thesis, and then strike with precision. The best trades come from areas where multiple confirmations stack in your favor.
📉 Trade Plan:
Entry: 0.81933 rejection zone
TP1: 0.8130
TP2: 0.8101
Final TP: 0.8038
SL: Above 0.82294 (tight invalidation)
@WrightWayInvestments
@WrightWayInvestments
@WrightWayInvestments
Elliotwaveanalysis

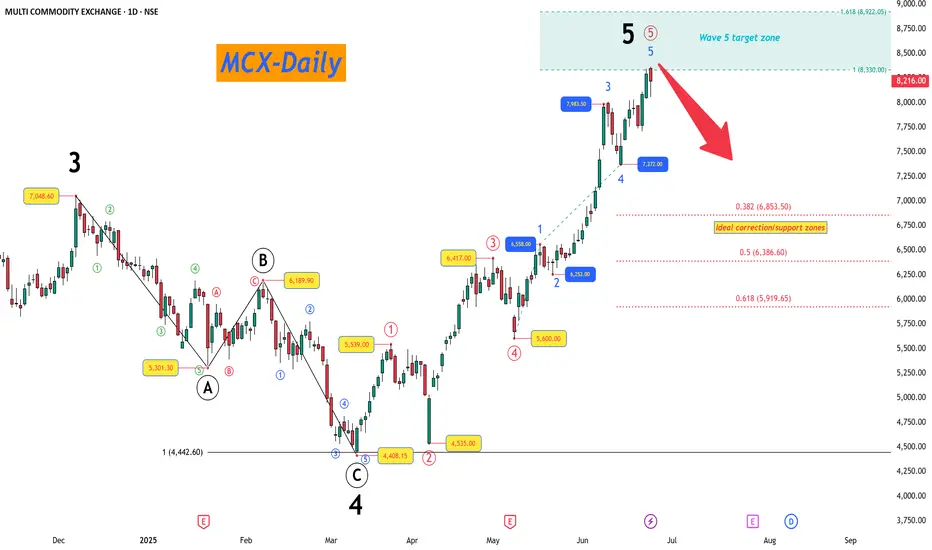
MCX - 5-Wave Impulse Complete, Correction Ahead?The recent price action in MCX has completed a 5-wave impulsive sequence, giving us valuable insights into potential upcoming moves.
The Larger Picture (Daily Timeframe) :
Starting from the prior major low, we have witnessed a clean impulse structure unfolding.
Wave 3 topped at 7,048.60, completing its previous impulse sequence.
Following this, a textbook ABC corrective structure unfolded into Wave 4, completing near 4,408.15. The internal symmetry within this ABC correction was near perfect, with Wave C nearly matching Wave A (100% projection).
Post Wave 4, the price resumed higher into Wave 5, where we now observe signs of completion.
Wave 5 Extension and Target Zone
Wave 5 extended strongly and has already entered its projected target zone:
100% projection of Wave 1 placed near 8,330.
1.618 extension projection reached near 8,922.
Ideal Correction Zones
Now that Wave 5 may have completed or is very close to doing so, we shift focus to probable retracement areas where price may find support in case of a corrective phase:
0.382 retracement at 6,853.50
0.5 retracement at 6,386.60
0.618 retracement at 5,919.65
Dynamic Update Note
The correction zones have been plotted based on the current observed Wave 5 high. Should Wave 5 extend further, these support levels will be recalculated accordingly. Traders are advised to keep monitoring for further price action confirmation before positioning.
The overall Elliott Wave structure here reflects the market may now enter a corrective phase as per standard wave behavior after a completed 5-wave advance.
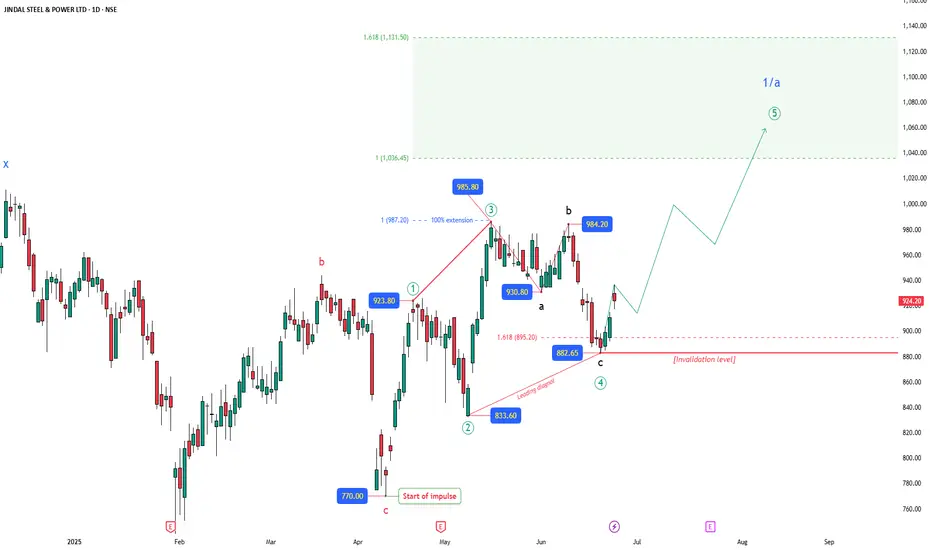
JINDAL STEEL: Leading Diagonal Starting?JINDAL STEEL & POWER appears to be constructing an initial impulsive advance that may very well be taking the form of a Leading Diagonal. The advance from the 770 lows has so far developed into a structure where Wave 4 has overlapped with Wave 1 territory, suggesting that a classical impulse structure may not be applicable here. Instead, the price action fits neatly within the characteristics of a leading diagonal pattern, which allows such overlaps.
Wave 1 terminated at 923.80 followed by a corrective pullback into Wave 2 at 833.60. The subsequent rise into Wave 3 reached 985.80, which completed near the 100% extension of Wave 1, supporting the diagonal scenario where extensions are often limited. This was followed by a clear a-b-c correction into Wave 4, which found support at 882.65. Notably, the c-leg of Wave 4 reached close to 1.618 times the length of Wave a, adding further symmetry to this structure.
The current advance may therefore represent Wave 5 of this diagonal, projecting towards the 1036 to 1131 region of Fibonacci extensions. However, since leading diagonals typically signal the start of a larger structure, this entire formation could well be unfolding as either the first leg of a higher degree impulse (Wave 1) or as an initial Wave A of a larger correction. The labeling is thus kept open as "1/a" to reflect both possibilities at this stage.
The invalidation level for the current bullish scenario remains at 882.65, below which this entire leading diagonal interpretation would require reassessment. Until then, the bias remains upwards as the final leg of this structure seeks completion.
Disclaimer: This analysis is for educational purposes only and does not constitute investment advice. Please do your own research (DYOR) before making any trading decisions.
A Step-by-step Guide to One of the Chart Analysis MethodHello Friends,
Welcome to RK_Chaarts,
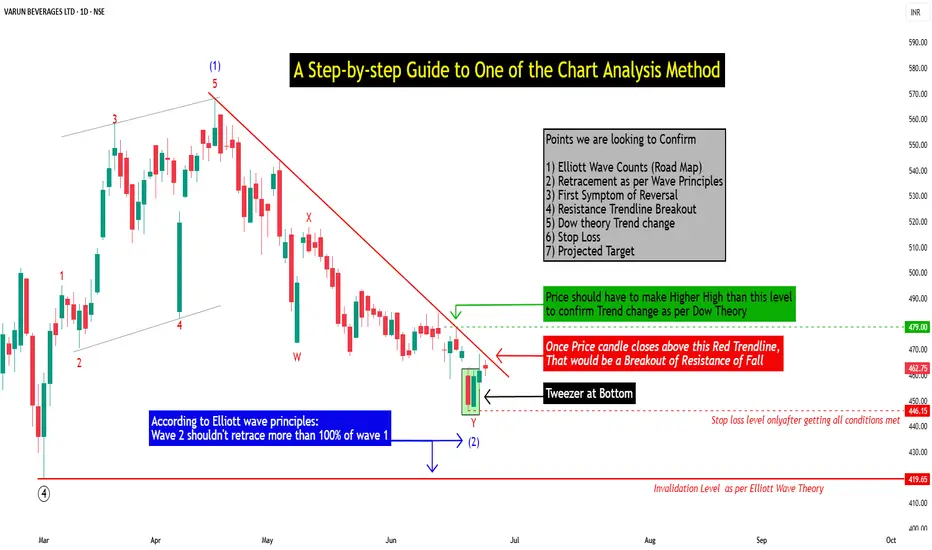
Today we're going to learn step-by-step guide to one of the chart analysis Method by analyzing a chart of " Varun Beverages Ltd. (VBL) " to identify a trend change opportunity.(Educational Post).
Let's get started!
Applying Elliott Wave Theory
First, we can see that the bottom formed in March 2025 is likely a Wave ((4)) in Black as a bottom, marked as such on the chart. From there, Wave 5 should move upwards. Looking at the daily timeframe, we can see that price gone up in five sub-divisions of Wave (1) in Blue of Wave ((5)) in Black have completed, marked as Red 1-2-3-4-5, that means blue intermediate Wave (1) has ended, and Wave (2) has begun, which is unfolded in corrective nature marked as WXY in Red of Wave (2) in Blue.
According to the wave principle, Wave (2) should not retrace more than 100% of Wave (1), which started from the 419.65 bottom. Therefore, 419.65 becomes our invalidation level. If the price moves below this level, it would invalidate our Wave (2) principle.
Assuming our wave counts are correct, the upward movement is in the five sub-divisions, and the downward movement is in the three sub-divisions. Definitely, the conviction is increasing that we have correctly identified Waves (1) and (2). Shown in chart image below
Tweezers at Bottom
Now, we can see that Wave 2 has retraced more than 70% and has formed a Tweezer candlestick pattern at the bottom. A bearish candle was followed by a bullish candle, both with a Tweezer-like shape, with the second candle being green. This could indicate a potential reversal. Moreover, the latest candle has also taken out the high of the previous two candles, showing follow-through. The price has also shown follow-through on the upside after that. So, this can be considered as the first sign that Wave 2 might be ending, marked by a significant Tweezer pattern at the bottom with a follow-through candle. Shown in chart image below
Significant Breakout Pending Yet
Secondly, from the top where Wave 1 ended, we've been considering the decline from around 560.50 as a resistance. We drew a resistance trend line, and if the price breaks out above it, we can say that the resistance trend line has been broken, indicating a breakout above the last fall's trend line, Which is not Broken yet. Shown in chart image below
Dow Theory
The Dow Theory states that when the price moves up, it forms a Higher High, Higher Low pattern, and when it moves down, it forms a Lower High, Lower Low pattern. Somehow, the Dow Theory also needs to change, as the last swing was forming a Lower High, Lower Low pattern. The last swing high was at 479, which we marked with a green arrow. If the price crosses above it, we can say that the price is now forming a Higher High pattern. This indicates that the Dow Theory is changing from a falling trend to a rising trend. Shown in chart image below
Stop Loss
Once the Dow Theory also changes, we can use the last swing low at 446.15 as our stop loss. However, this stop loss will only be valid after the Dow Theory changes; otherwise, the invalidation level will remain at 419. Shown in chart image below
Projected Target of Wave (3)
So, friends, we've applied the Elliott Wave principle, and there's been a significant retracement, all within the valid range, without violating any rules or triggering invalidation. There's limited room left on the downside, and then we have the Tweezer candlestick pattern, which is a significant sign. We're expecting a reversal from there, and the price has followed up with an upward move.
What's left now is the breakout above the resistance trend line and a change in the Dow Theory. Once these two conditions are confirmed, all parameters will match, and we can add a position to our portfolio using the last swing low as our stop loss, instead of the invalidation level.
This is how chart analysis is done for investment purposes. We've seen many signs in our favor, and yet we still use a stop loss to prevent significant losses in case the stock or market moves unexpectedly. This is what stop loss is all about - minimizing potential losses.
We've also discussed the target projection based on Wave theory, 161.8% level, which we explained through an image. So, friends, I hope you've understood the entire conclusion and learned how to analyze charts using different methods, one of which we shared with you today.
I am not Sebi registered analyst.
My studies are for educational purpose only.
Please Consult your financial advisor before trading or investing.
I am not responsible for any kinds of your profits and your losses.
Most investors treat trading as a hobby because they have a full-time job doing something else.
However, If you treat trading like a business, it will pay you like a business.
If you treat like a hobby, hobbies don't pay, they cost you...!
Hope this post is helpful to community
Thanks
RK💕
Disclaimer and Risk Warning.
The analysis and discussion provided on in.tradingview.com is intended for educational purposes only and should not be relied upon for trading decisions. RK_Chaarts is not an investment adviser and the information provided here should not be taken as professional investment advice. Before buying or selling any investments, securities, or precious metals, it is recommended that you conduct your own due diligence. RK_Chaarts does not share in your profits and will not take responsibility for any losses you may incur. So Please Consult your financial advisor before trading or investing.
₿itcoin: PullbackBitcoin has experienced significant selling since Friday, briefly slipping below the $100,000 mark. We previously mentioned that a sharper pullback wouldn't surprise us. Whether prices will drop a bit further remains to be seen for the moment. Ultimately, we still expect Bitcoin to climb into the upper blue Target Zone (coordinates: $117,553 – $130,891) before a broader C-wave sell-off occurs, pushing the price down to the lower blue Target Zone (coordinates: $62,395 – $51,323). There, we anticipate the low of the larger orange wave a, which should mark the start of another corrective upward move. Afterward, we're preparing for the last downward leg of blue wave (ii). However, if Bitcoin directly surpasses the resistance at $130,891 – and thus our upper blue Target Zone – we'll locate it still in blue wave alt.(i) (30% probability).
📈 Over 190 precise analyses, clear entry points, and defined Target Zones - that's what we do.

ETH: Hardly Any Volatility Not much has happened for Ethereum since yesterday. According to our primary scenario, wave B in turquoise should imminently push higher, theoretically up to resistance at $4,107. Once these corrective rises conclude, wave C should take over, driving ETH down to complete the large green wave in the Target Zone below ($935.82 – $494.15). The low of this multi-year correction should lay the foundation for subsequent wave increases, likely causing new record highs above the $10,000 mark, as the weekly chart suggests. In our alternative scenario, ETH would embark on this bullish journey earlier. Currently at 27% probability, this alternative assumes the corrective low was already established at $1,385, which would imply a direct breakout above $4,107.
📈 Over 190 precise analyses, clear entry points, and defined Target Zones - that's what we do.

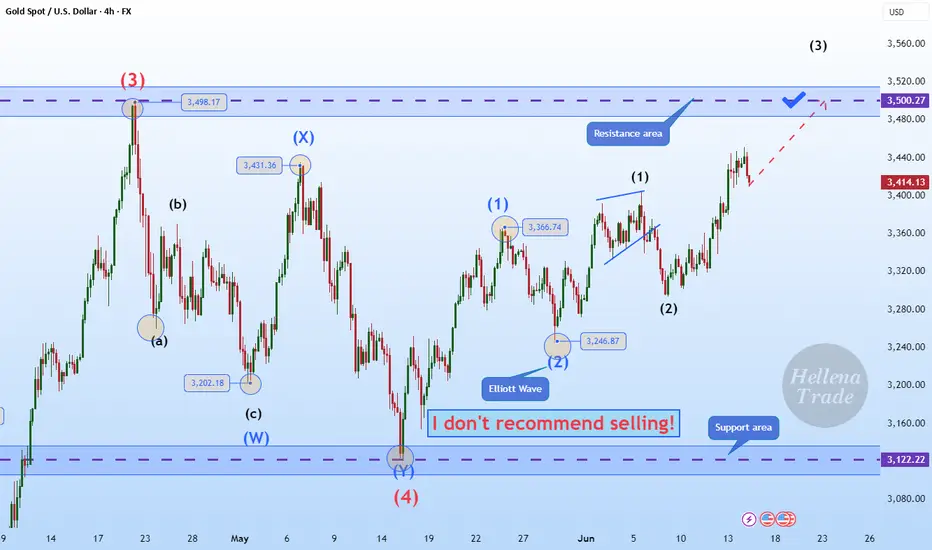
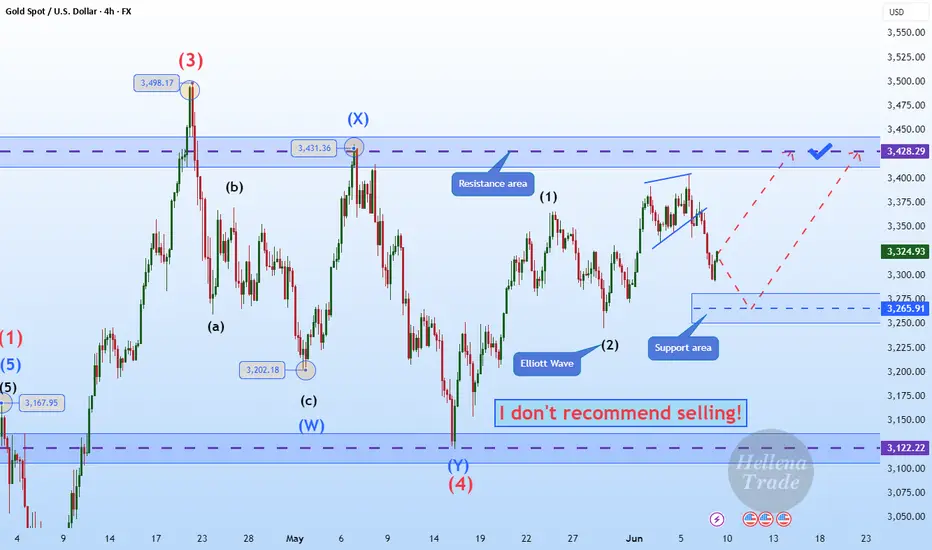
Hellena | GOLD (4H): LONG to resistance area of 3500 (Wave 3).Colleagues, the correction did take place and was quite deep, as I wrote earlier.
However, I am leaving my target unchanged—the resistance area and the maximum of wave “3” of the higher order at 3500.
The waves remain in their previous places, because none of the rules of wave analysis have been violated.
Manage your capital correctly and competently! Only enter trades based on reliable patterns!

₿itcoin: Holding steadySince our last update, Bitcoin has traded in a relatively stable range. As expected, there's still a strong case for the crypto leader to climb into the upper blue Target Zone between $117,553 and $130,891. However, a deeper pullback below the $100,000 mark remains a real possibility before that move unfolds. Regardless of the path it takes, we continue to expect Bitcoin to reach this upper zone, completing green wave B. From there, a corrective wave C—also in green—is likely to follow, driving the price down toward the lower blue Target Zone between $62,395 and $51,323. This move would mark the end of the broader orange wave a. For now, we’re watching for a potential b-wave recovery before the final leg lower toward the bottom of blue wave (ii) takes shape. That said, there's still a 30% chance that blue wave (i) isn’t done yet and could extend significantly above $130,891 before any meaningful correction begins.
📈 Over 190 precise analyses, clear entry points, and defined Target Zones - that's what we do.

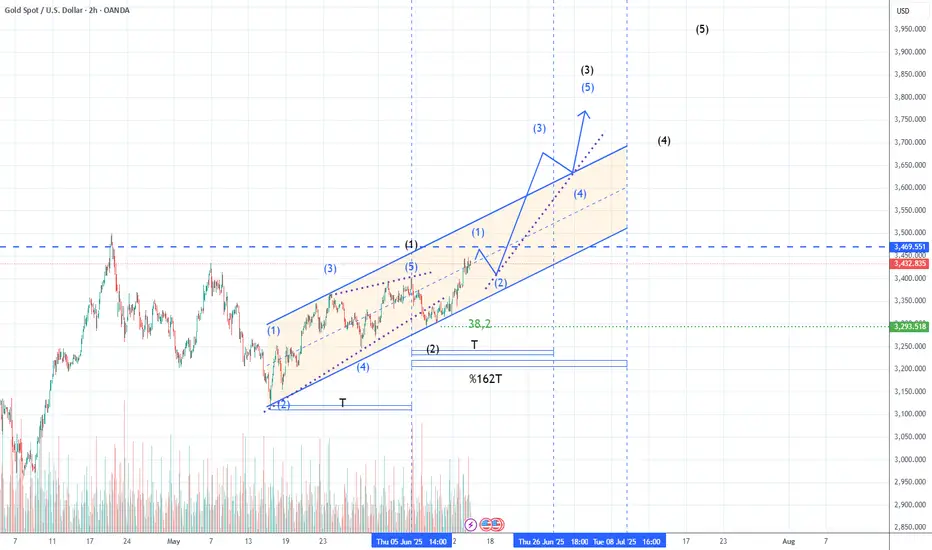
XAUUSD İmpulsive wave continuationWe have started our next impulsive wave. Elliot Wave is not some magic tells us future but eliminating all the possibilities while market pricing fundementals and clear patterns. so when we have left with only very limitided posibilities we know how to position ourselves.
here is one of thoose handful of options left in the hand. short term targets : 3469-3531
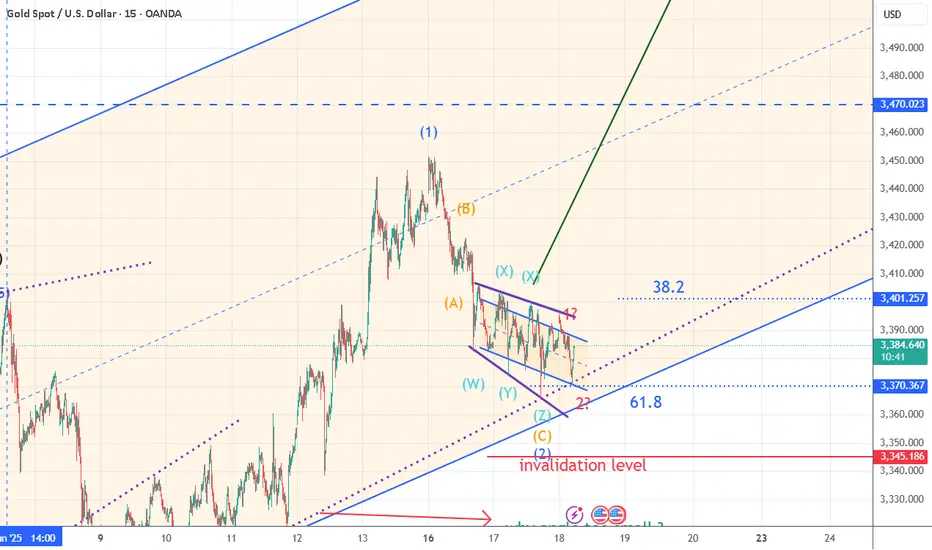
XAUUSDHolding buy side. it s been staying in the range of 38.2 and 61.8 fibo levels. it will need to h1 candle body brake 3401.
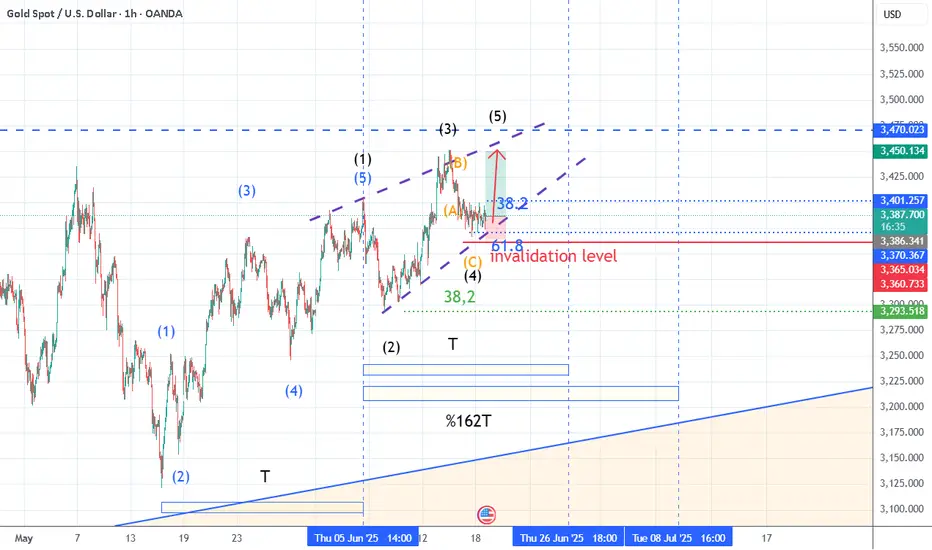
XAUUSD Next Move up and wait for another setupSince this last correction from 3460 to 3368 i was considering upwards double zigzag or an impulse wave and small posibilty of ending diagonal. when i looked into smaller time frame counts and also this delaying correction moves with interesting fibonacci levels i am convinced to that maybe we are in an ending diagonal. so what i am going to do is i will full tp all my positions at 3445-3450 area and watch for another setup. if this is an ending diagonal we might see another big impulse correction wave towards 3100-2950, and if this is a double zigzag or an impulse we can buy after clear upbrake candles. so it s better to take tp and watch until it becomes more clear for safety.
target 3445.
USD/JPY – Bearish Symmetrical Triangle Break Incoming?USD/JPY is currently consolidating within a well-defined symmetrical triangle, respecting both the ascending and descending trendlines with clean touches. This structure typically precedes a volatile breakout, and the technical confluence here favors a bearish resolution.
🔍 Technical Breakdown:
Price failed to hold above the 0.5 Fib level of the recent swing high at 145.377, getting rejected by both the 200 EMA and the triangle resistance zone.
Currently testing the 0.382 retracement (144.607) — a break here opens the door for a drop to the 0.236 level (143.653) and potentially deeper into previous demand.
Volume compression and EMA clustering further support an imminent breakout move.
📐 Bearish Confluences:
Rising wedge/symmetrical triangle pattern showing exhaustion.
Strong rejection at the equilibrium of the range.
EMAs acting as dynamic resistance.
Major fib cluster from previous bearish leg aligning with triangle apex.
🎯 Targets:
TP1: 143.653 (0.236 Fib)
TP2: 142.111 (local low)
TP3: 140.347 (-0.27 Fib extension, full measured move of triangle)
❌ Invalidation:
Clean break above 145.526 (mid-structure + fib zone) would neutralize the setup.
💬 Market Context: Watch closely for a breakout confirmation. Smart money may sweep short-term liquidity before a decisive drop. Stay nimble, and remember — structure always tells the story.

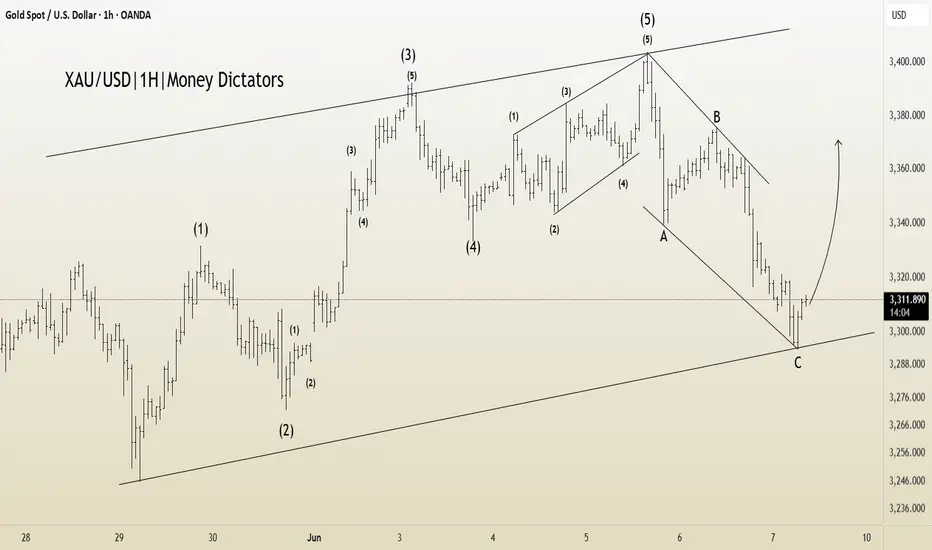
XAU/USD Bullish Setup Confirmed After Wave C CompletionXAU/USD has completed a classic five-wave impulsive structure to the upside, followed by a clear ABC corrective phase. The price action shows that wave (5) has topped, and the market has since retraced through a three-wave ABC correction inside a well-defined descending channel.
Currently, wave C appears to have found support right at the lower trendline of the broader ascending structure, signaling a potential completion of the correction and the beginning of a new bullish impulse.
The reaction from this level is strong, suggesting that buyers are stepping in to drive the next leg higher
Wave Count: 5-wave impulse up, followed by ABC correction
Structure: Wave C completed at key channel support
Momentum: Bullish recovery expected if price holds above recent swing low
T1: 3332.268
T2: 3354.078
SL: 3289.400
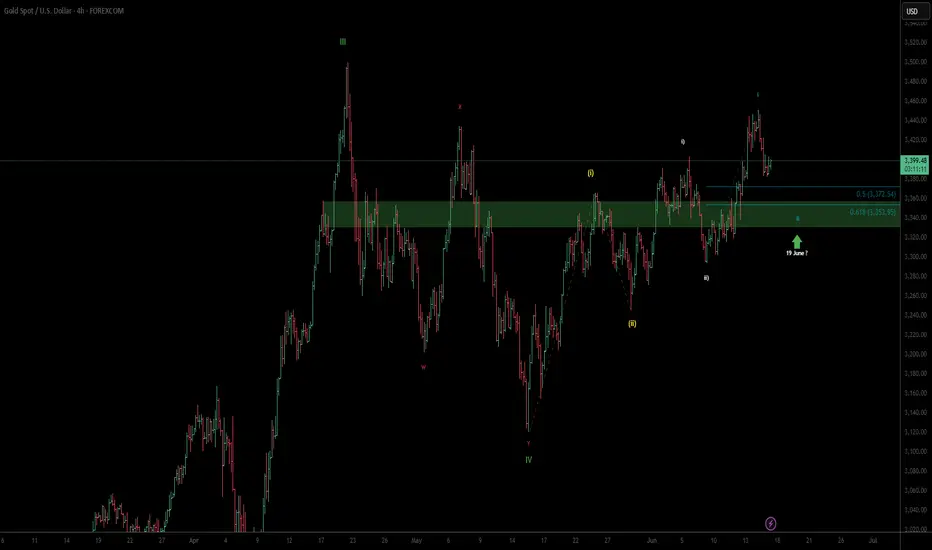
Gold is Nesting... Have updated the counts since my last post.
I believe we have a series of ones and twos since the 15th May low...
Once we start moving into the third of the third of the third, US Indices will commence either a correction or another bearish leg.
Have been long Gold and will be holding my positions.
Hellena | GOLD (4H): LONG to resistance area of 3500.Colleagues, I believe that, as with the euro, the upward five-wave impulse is not yet over. At the moment, I see the formation of wave “3” of the lower order and wave ‘3’ of the middle order, which means that the upward movement will continue at least to the resistance area of 3500 — this is the maximum of wave “3” of the higher order, which means that a correction is possible at this level.
Manage your capital correctly and competently! Only enter trades based on reliable patterns!
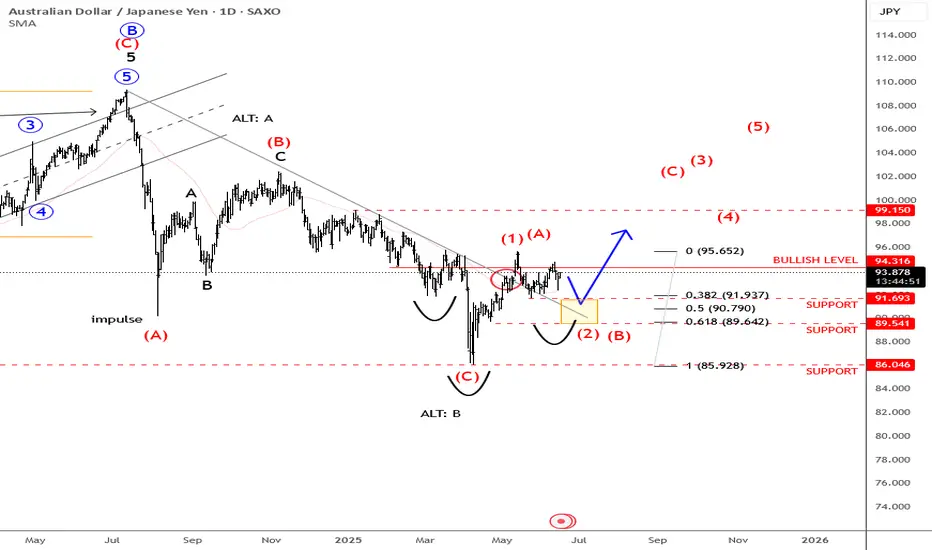
AUDJPY Forming A Bullish Set-upAUDJPY is recovering very nicely after touching the 86 support level, which goes back to the 2023 low. That was clearly an important zone from there we’ve seen a sharp and impulsive bounce in the last two months, even breaking above the trendline resistance connected down from the 2024 highs. This breakout suggests that bulls may be back in control and could still drive the pair toward the 98–100 area later this year. If we get a retracement in the near term, keep an eye on the 91.70 - 90.00 zone as potential support.
GH
BABA Stock: A Detailed Analysis using Elliott Wave Theory RulesHello Friends,
Welcome to RK_Chaarts,
Let's analyze Ali Baba Group Holdings Limited, also known as BABA, listed on the NYSE. We'll be using the Elliott Waves theory.
Friends, as we can clearly see, after hitting a low of around $95.75 on 9th April 2025, it started an impulse wave. Within this wave, we've completed intermediate degree blue bracketed (1), (2), (3), (4), (5), and primary degree ((1)) in Black. Currently, we're completing primary degree ((2)), with a low around $111.
If it breaks the level of $111, we'll assume we're still in primary degree ((2)), as marked in scenario 2 on the chart. This means wave ((2)) is unfolding, and wave ((3)) might start after wave ((2)) is complete.
If it doesn't break the $111 level, it's likely that wave ((2)) has completed, and we've started a subdivision of wave ((3)) or its further subdivisions. If it moves further up, following scenario 1 (the black line on the chart), this is a possibility.
According to Elliott Wave theory, wave ((2)) cannot retrace more than 100% of wave ((1)). So, our main invalidation level for this count is $95.75. Yes, BABA is turning up against the 95.75 low, and in the near term, we expect the stock to trade higher.
Somewhere, this stock might move towards $150 or $160 if it doesn't break down below $ 95.75.
I am not Sebi registered analyst.
My studies are for educational purpose only.
Please Consult your financial advisor before trading or investing.
I am not responsible for any kinds of your profits and your losses.
Most investors treat trading as a hobby because they have a full-time job doing something else.
However, If you treat trading like a business, it will pay you like a business.
If you treat like a hobby, hobbies don't pay, they cost you...!
Hope this post is helpful to community
Thanks
RK💕
Disclaimer and Risk Warning.
The analysis and discussion provided on in.tradingview.com is intended for educational purposes only and should not be relied upon for trading decisions. RK_Chaarts is not an investment adviser and the information provided here should not be taken as professional investment advice. Before buying or selling any investments, securities, or precious metals, it is recommended that you conduct your own due diligence. RK_Chaarts does not share in your profits and will not take responsibility for any losses you may incur. So Please Consult your financial advisor before trading or investing.

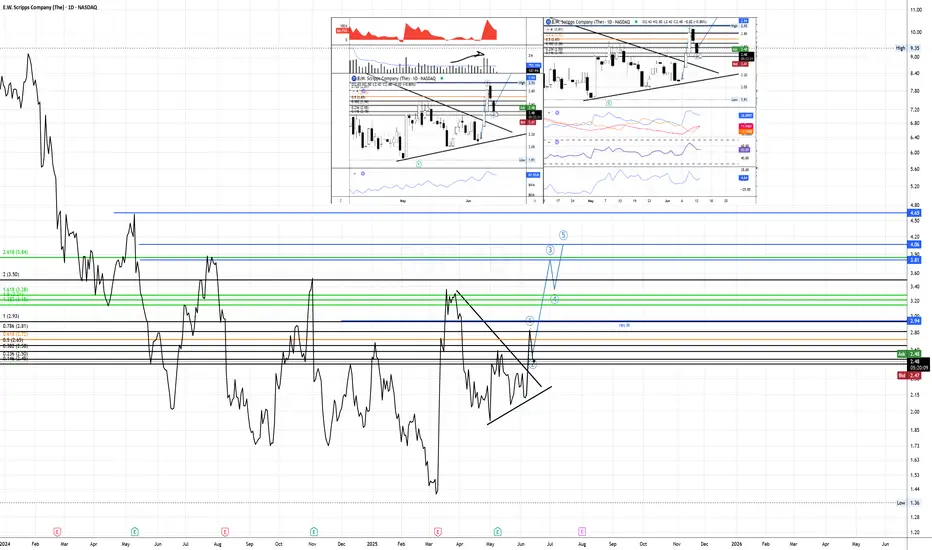
$SSP Low volume on Wave 2, momentum risingFirstly, on the line chart is possible to watch the possible targets - blue lines - which one of it is almost as the same level as 2,618.
Fibonacci measured from the breakout to monthly resistance.
res M = monthly resistance
During the Wave 2, the two candles from last two days showed low volume as usual to happen during formation of W2, and it is possible to see that price at the breakout and after it was above average which can be read as high interest from buyers.
Confirming the volume, the EFI even though is decreasing still show strength,OBV follow the price trend but looks like buyers are entering again.
When it comes to momentum is possible to see that RSI did not crossed the equilibrium even after two bearish days, as ROC being a leading indicator which already changed direction . ADX is showing some strength for the trend direction confirmed by as DMI+ is still above DMI-
DTC = 1,36
₿ Bitcoin: SlippedAfter holding steady for two days, Bitcoin broke lower yesterday, confirming a setback within green wave B. This countertrend move delays the anticipated climb, which we still expect to reach its peak in the upper blue Target Zone (coordinates: $117,553 – $130,891). From there, bearish wave C should take over. The upper blue zone remains a tactical area for partial profit-taking or hedging long positions with shorts. Wave C is expected to drive the price sharply lower into the blue Target Zone (coordinates: $62,395 – $51,323), where we anticipate the completion of orange wave a. Orange wave b may trigger a corrective bounce, but ultimately, renewed downside should wrap up the intermediate correction of blue wave (ii). Still, there’s a 30% chance that Bitcoin forms a higher high as part of blue wave alt.(i)—temporarily breaching the upper blue zone.
📈 Over 190 precise analyses, clear entry points, and defined Target Zones - that's what we do.

Hellena | GOLD (4H): LONG to resistance area of 3428.Colleagues, in the last forecast I wrote that I expect to reach the target in the area of 3439.37 and I am not giving up on it. At the moment, the price has made a strong correction and so I will make a new forecast, in which the targets will remain almost unchanged, but I see that the wave pattern has changed a bit.
Now wave “1” lower wave is located higher and at the moment I believe that the price is in wave “5”.
A correction to the support area of 3265 is possible, but in general I expect to reach the resistance area of 3428.
Manage your capital correctly and competently! Only enter trades based on reliable patterns!
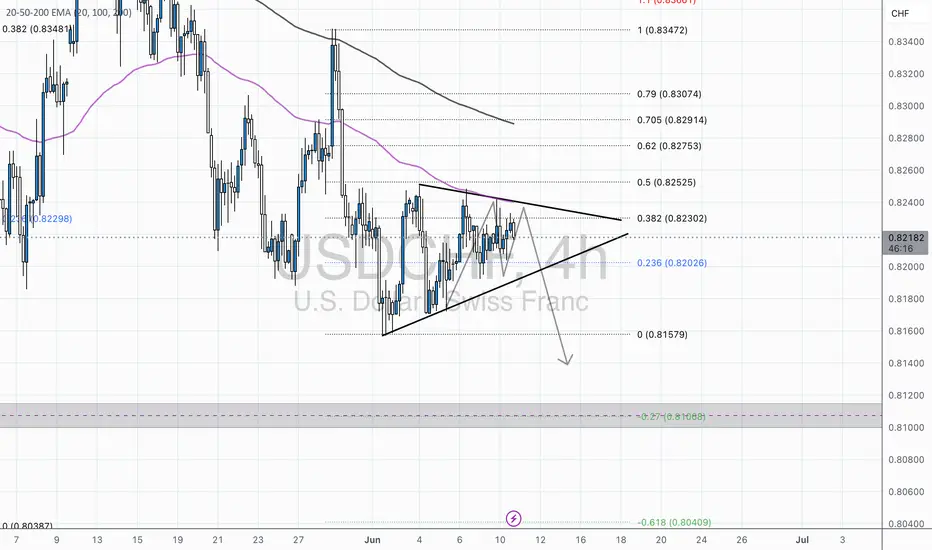
USD/CHF 4H Analysis – Bearish Continuation Setting Up?USD/CHF is currently forming a textbook symmetrical triangle consolidation pattern just below key EMAs (20, 50, and 200), signaling potential exhaustion in bullish momentum. Price is compressing against the upper boundary of the triangle, failing to sustain above the 0.382 Fib retracement level (0.82302), which is aligned with the 50 EMA – a known area of dynamic resistance.
This consolidation follows a clear bearish leg from the swing high at 0.83472, which suggests this triangle is likely a continuation pattern. A clean break below the ascending trendline support would confirm bearish continuation, with a measured move target near the 0.81068 level, which aligns with the -0.27 Fib extension.
🔍 Key Technical Levels:
Resistance: 0.82302 (0.382 Fib), 0.82525 (0.5 Fib), 0.82753 (0.618 Fib)
Support: 0.82026 (0.236 Fib), 0.81579 (Swing Low), 0.81068 (Bearish Extension Target)
📌 Watch for:
A decisive break and close below triangle support
Volume spike or bearish engulfing candle for confirmation
RSI is neutral but leaning slightly bearish; room for downside
🎯 Bearish Bias
📍 Tag: #USDCHF #ForexAnalysis #WrightWayInvestments
XAU/USD 1H – Clean Impulsive Setup UnfoldingGold has completed a clean Wave (2) correction, bottoming at $3,292.30, respecting both structural demand and fib confluence. Price is now showing early signs of Wave (3) development to the upside.
📌 Key Structure:
Wave (1) High: $3,403.30
Wave (2) Low: $3,292.30 (confirmed higher low structure)
Market is now consolidating slightly above the 0.5 fib level ($3,324.45), with bullish structure still intact.
📈 Technical Confluence:
Price is holding the internal bullish trendline
RSI is neutral but building potential upside momentum
Price action is forming higher lows, indicating strength post-correction
🎯 Next Bullish Targets:
$3,366.08 (0.236 fib level of Wave (2) correction)
$3,403.30 (Wave (1) high retest)
Final Wave (3) extension zone: $3,445 – $3,500
📉 Invalidation Level:
A break and close below $3,292.30 would invalidate this Wave (2) bottom and open the door for a deeper correction.
✅ Bias:
Bullish, as long as price holds above the 0.618 – 0.705 fib zone. A strong push from this area could confirm the next leg of Wave (3).
@WrightWayInvestments
@wrightwayinvestments
@wrightwayinvestments

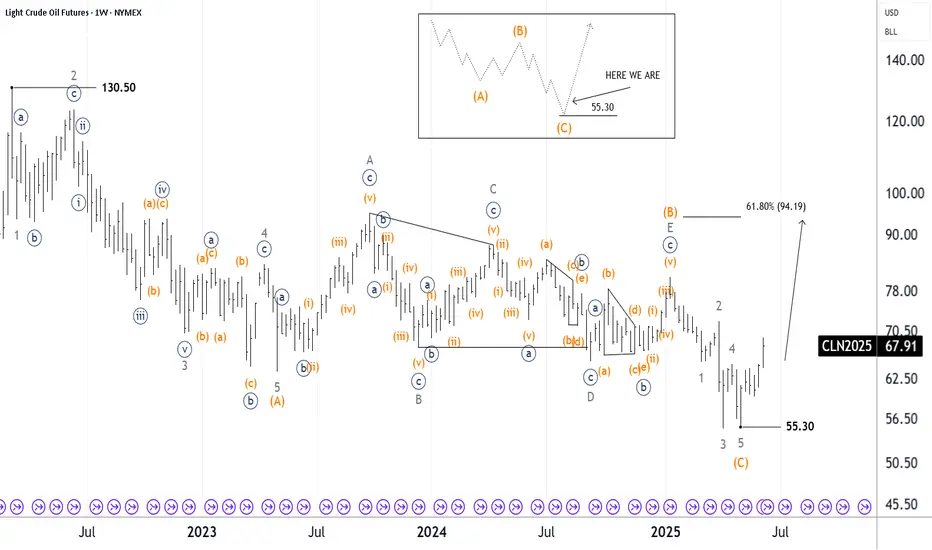
CRUDE OIL: 12 JUNE, 2025 - BOTTOM AND TAKE OFF!?Conclusion: The ABC)-orange correction may have just completed, and a five-wave is pushing much higher, targeting the nearest target at the high around 94.19 or 130.50.
Details: Since the high of 130.50, a decline with A,B,C)-orange has unfolded as a Zigzag. I counted a five-wave within the A)-orange, and a triangle within the B)-orange, and finally the C)-orange has completed as a five-wave. So, perhaps that ABC has ended with convincing evidence.
So crude oil is likely to rise in the medium term, even though the alternative scenarios with relatively high probability in another development also show increasing bullish weight. And it is aiming for the nearest target at 94.19. While price must always remain above 55.30 to keep the Bullish market view valid.