LT going LongLT can go up in wave 5, has correction wave ABC looks completed, but there can also be a further possibility complex correction WXY, but still stock looks good to buy in cash for short term, proper risk management is also imp. Which plays any crucial role while trading/investing.
Elliotwaveanalysis

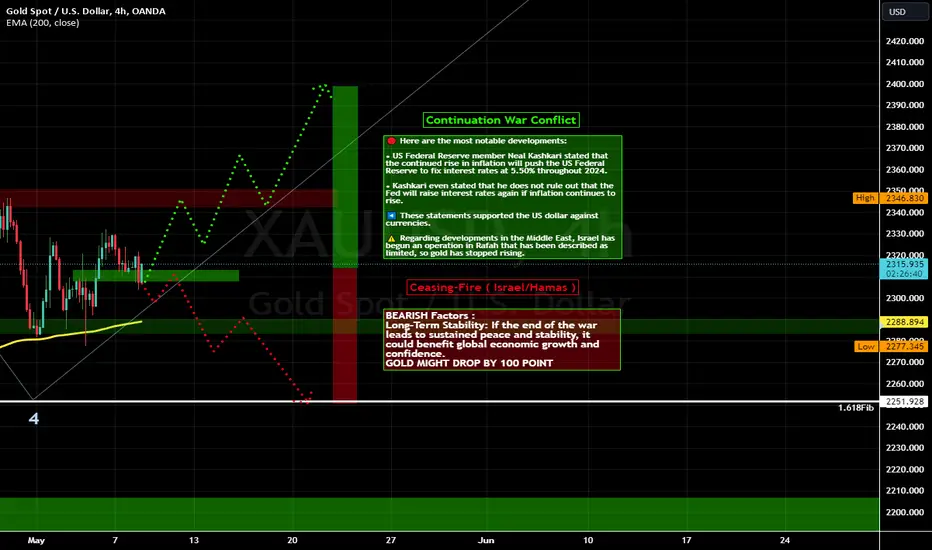
Gold analyse 08/05/2024
OANDA:XAUUSD
1/ US Fed's Interest Rate Stance: Neal Kashkari's remarks on maintaining a high interest rate amidst rising inflation could bolster the US dollar
2/ Middle East Tensions: Israel's limited operation in Rafah has stalled the upward momentum of gold prices, indicating a temporary halt in geopolitical concerns
3/ Impact of Interest Rate Uncertainty: Gold prices decline amid uncertainty about central banks' plans to reduce interest rates, with the rise of the dollar further contributing to gold's fall
4/ Global Debt Levels: Record-high global debt levels reaching $315 trillion could potentially raise concerns about economic stability, prompting investors to seek safe-haven assets like gold
5/ Central Banks' Gold Purchases: The substantial increase in gold purchases by global central banks, exceeding 1,000 tons in a year, suggests a hedging strategy amid economic uncertainties, potentially reflecting concerns about currency stability
6/ Perception of Central Banks' Confidence: The significant gold acquisitions by central banks could indicate a loss of confidence in traditional currencies, prompting investors to reevaluate their portfolios
Honestly, I don't feel like explaining, the chart says it all !Hi.
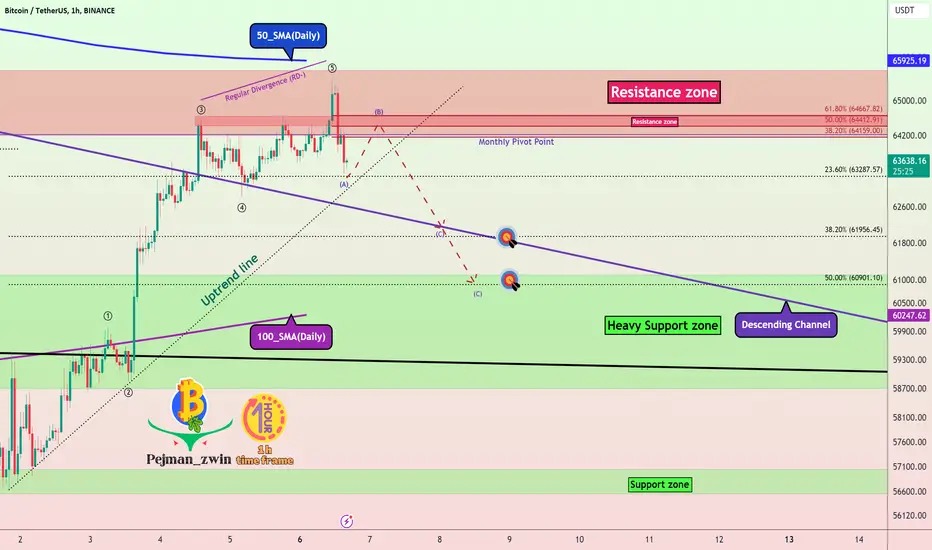
BINANCE:BTCUSDT
✅Today, I want to analyze BTC for you in a 9h time frame so that we can have a short-term view of BTC regarding the technical analysis. (Please ✌️respectfully✌️share if you have a different opinion from me or other analysts).
✨After the fifth bullish wave, BITCOIN has completed his corrective waves (ABC) and now he has reached the Bottom of the wedge, now it is time to start the five bullish waves, and BTC is in the Megaphone,and now finished first wave.
✅ Due to the Ascending structure of the chart...
🟢 High potential areas are clear in the chart.
🟢 Bullish Wedge.
🟢 Ascending Triangle
🟢 Starting 5th waves.and now finished first wave.
❗ Note that if the WEDGE is broken down with the power of descending candles, our analysis will fail.
Stay awesome my friends.
_ _ _ _ _ _ _ _ _ _ _ _ _ _ _ _ _ _ _ _ _ _ _ _ _ _ _ _ _ _ _ _ _
✅Thank you, and for more ideas, hit ❤️Like❤️ and 🌟Follow🌟!
⚠️Things can change...
The markets are always changing and even with all these signals, the market changes tend to be strong and fast!!

🚧Bitcoin Needs Correction🚧✅ Bitcoin moved as I expected in the previous post .
💡Currently, Bitcoin has reacted well to the 🔴 Resistance zone($65,650-$64,200) 🔴.
🌊According to the theory of Elliott waves , it seems that Bitcoin has succeeded in completing 5 impulse waves and now we have to wait for corrective waves .
💡Also, we can see Regular Divergence(RD-) between two Consecutive Peaks .
📈According to Classical Technical Analysis , Bitcoin can also form the Head and Shoulders Pattern .
🔔I expect Bitcoin to fall after breaking the Uptrend line , at least to the first 🎯 Target 🎯 I specified on the chart.
❗️⚠️Note⚠️❗️: If Bitcoin can break the 🔴 Resistance zone($65,650-$64,200) 🔴, the scenario will be changed.
❗️⚠️Note⚠️❗️: An important point you should always remember is capital management and lack of greed.
Bitcoin Analyze ( BTCUSDT ), 1-hour time frame ⏰.
Do not forget to put Stop loss for your positions (For every position you want to open).
Please follow your strategy; this is just my Idea, and I will gladly see your ideas in this post.
Please do not forget the ✅' like '✅ button 🙏😊 & Share it with your friends; thanks, and Trade safe.
CRWD Elliot Wave AnalysisCRWD Crowdstrike Elliot Wave.
It's somewhat unorthodox as this stock is bullish with a lot of buying pressure. Less choppy than the broader market.
This has large upside as Wave 3 has just broken out and can swing to the upside.
Disclaimer: Do not invest money you can not afford to lose, not investment advise. I do not have a position.

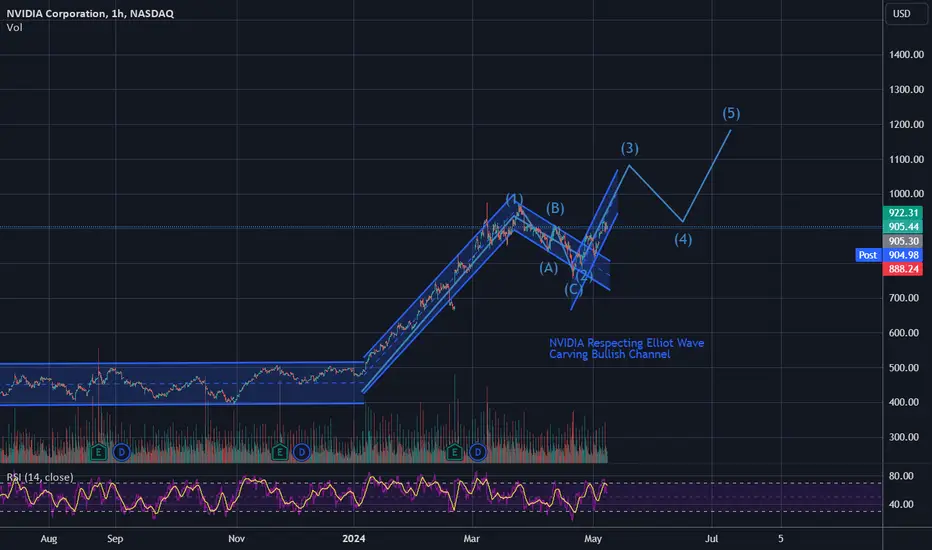
Nvidia Elliot Wave AnalysisNvidia on hourly candles respecting elliot impulse wave pattern for year 2024. Wave 2 was a classic 3 wave elliot correction wave pattern. This then breaks into wave 3 and is respecting a very tight channel upwards. Expecting 1000+, back to 900s, then price target of 1100+ post July.
Heavy chop in wave 3 due to broader market uncertainties and pressures. This stock trades with higher volatilities than others with its market cap. Trade weeklies with caution.
Good long if you're 1yr+ long or 6M+ long option calls.
My personal take: Nvidia will be the world's first 10T dollar company by 2027 and will be the world's most powerful and sought after company. Their technologies will ensure continued world peace (including in taiwan) and will be an industry leader for the next quarter century.
Only invest money you can afford to lose, not investment advice. Goodluck everyone.
*disclaimer: I have a May 17 955C position.
Long term NIFTY wave counts - potential downside ahead!I was reviewing long term EW counts of NSE:NIFTY and here is what I think. Overall, I can see potential 2 alternatives and have highlighted them in blue and red respectively. This is a monthly chart.
Blue Alternative
Let's start with blue counts first. Larger degree wave 1 (marked by square blue box) which started from Covid lows of March 2020, ended in October 2021. Wave 1 is the same for both blue and red alternatives since there is no confusion till that point. But from that point onward, things change. I have marked the correction in larger degree wave 2 (marked by square blue box) as a W-X-Y correction which ended in March 2023. From there, I am assuming a larger degree wave 3 started.
Within the larger degree wave 3, we seem to be near completion of the minor degree wave (i) of larger degree wave 3. This is marked in black since wave (i) of 3 in the red alternative also ends at the same point even though counts for the red alternative are different.
We can see the red bar forming for this month but this is too early to say if we'll get a negative close for this month. However, wave v of (i) has an ending diagonal look (more clearly visible in lower timeframes). Plus, we can see massive negative divergences in RSI and momentum oscillator which suggests that a correction is due. Make no mistake - correction will occur soon. If not this month, then maybe next month.
For the uninitiated, ending diagonal (ED) is typically the last leg of a move. In this case, it should be signaling the ending of wave (i) of 3.
Now, before we come to the size of the correction, let's take a look at the red alternative.
Red Alternative
Larger degree wave 1 remains the same in red alternative as mentioned earlier. However, in this alternative, larger degree wave 2 (marked by square red box) ended in June 2023 followed by immediate start of larger degree wave 3. In this alternative, we are taking all follow-up moves as i-ii-i-ii-iii-iv-iii-iv-v.
Don't worry about this count, just understand that this move (first leg (i) of larger degree wave 3 ) also seems to be ending exactly where blue wave count suggests, i.e. possibly this month end or next. I can't confirm now since this month's candle is still forming.
Conclusion
Both wave counts suggest that minor degree wave " (ii) of 3 " (marked in black on the right most part of the chart) should begin soon, if not already started.
Finally, coming to the size of this move, if we go by blue alternative, 38.2% retracement level is around 20500 and 50% is around 19800.
And if we go by the red alternative then 50% retracement is around 19000, 61.8% is around 18100. At the minimum, I would expect 19200-19500 levels (38.2% retracement) if the red alternative is in play.
So which one is going to happen? To be honest, I have no idea but we can go with the least of both alternatives at a tentative level and refine as the move evolves. That gives us 19800 which is still more than 2000 points correction from current levels.
20 month moving average is currently at 19675, and rising. This potentially makes 19800 a viable target in a month or two.
Happy (wave) counting ;-)

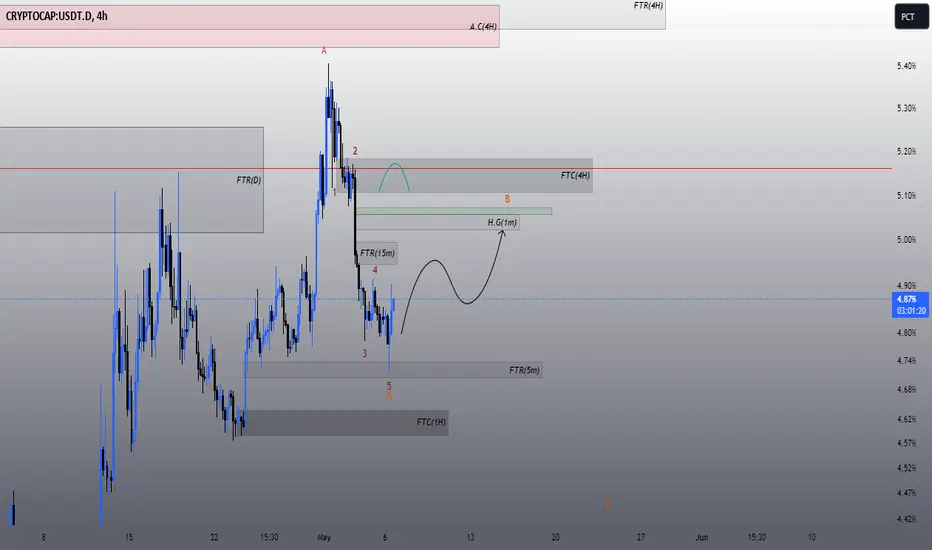
USDT.DUSDT Dominance has apparently completed its downward movement in the 4-hour time frame.. which has been completed in the form of an impulse that can be considered wave A or 1.. which of course we have named wave A for now..
In the following, an upward phase can be completed in the form of wave B. Based on this, we can expect growth up to 5% and even higher levels. Time 4 hours..
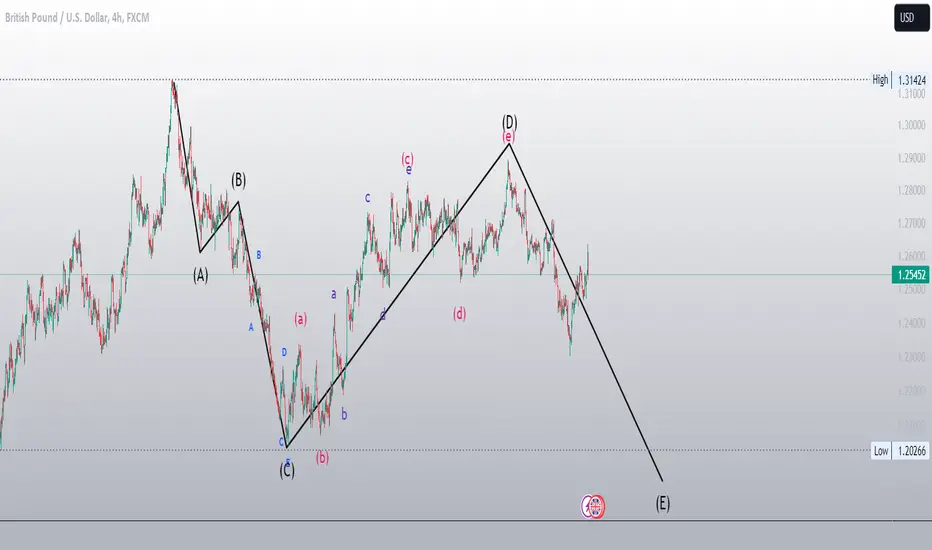
GBPUSD has the possibility of price correctionBased on the wave counter that has been done, you can see that in the 4-hour time frame, there is a lot of possibility and potential to reduce the price to at least 1.1955.
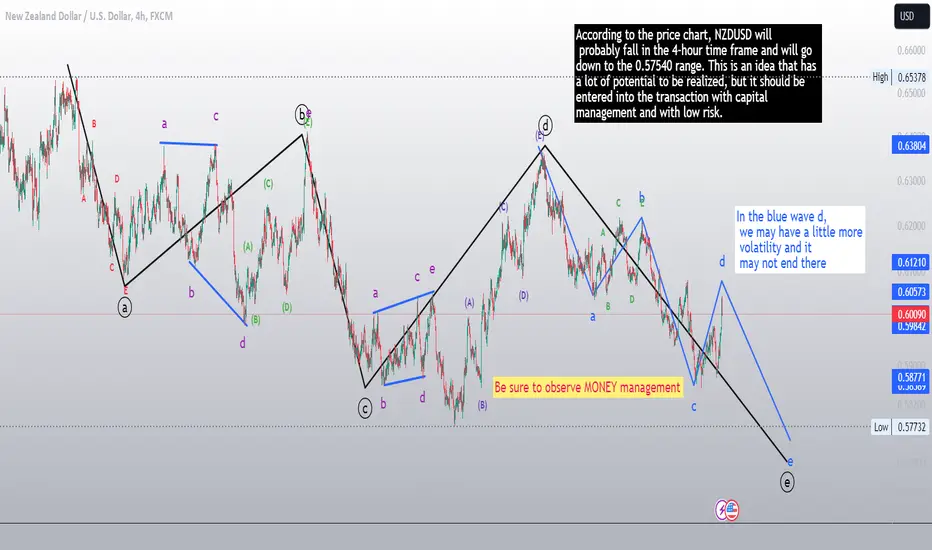
NZDUSD will fall in 4 hoursAccording to the price chart, NZDUSD will
probably fall in the 4-hour time frame and will go
down to the 0.57540 range. This is an idea that has
a lot of potential to be realized, but it should be
entered into the transaction with capital
management and with low risk.
ELLIOT WAVE ANALYSISGood evening to all, after a wave A is followed by B which is developing, and can reach the reverse of A measured as AND 88.6% fibonatsi, that is 5200 to 5230 then we have a wave C which can reach from 4913 to 4765 and maybe even lower.

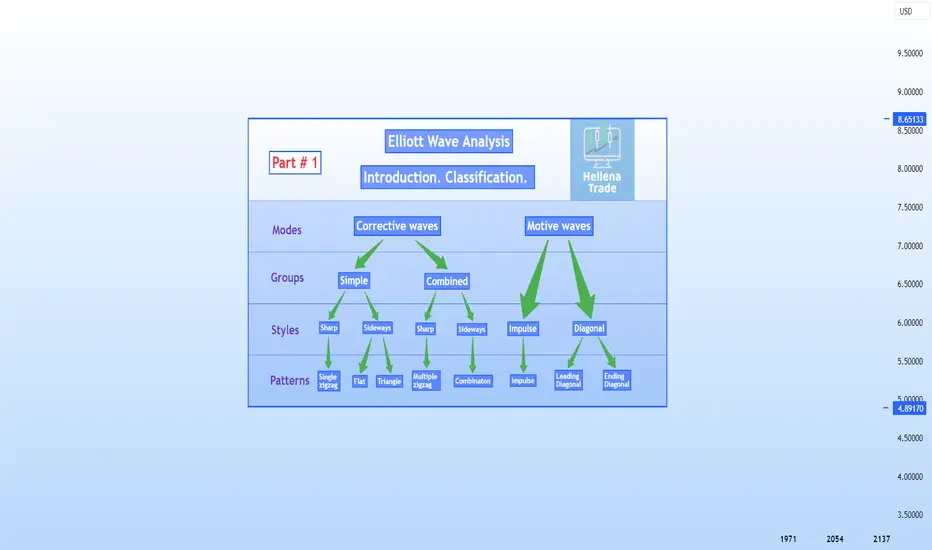
📍Part #1, Elliott Waves: "Introduction. Classification".Hello!
Dear colleagues, because I am constantly analyzing the markets with the help of wave analysis. Many colleagues ask me about it and I decided to make some tutorial posts to help you in this difficult task.
I want to present this information to you in a simple and straightforward manner.
Well, enough unnecessary text, let's get started!
A bit of history from Wikipedia.
Ralph Nelson Elliott (1871-1948), an American accountant, developed a model for the underlying social principles of financial markets by studying their price movements, and developed a set of analytical tools in the 1930s. He proposed that market prices unfold in specific patterns, which practitioners today call Elliott waves, or simply waves.
Elliott stated that "because man is subject to rhythmical procedure, calculations having to do with his activities can be projected far into the future with a justification and certainty heretofore unattainable."
In simple words, human behavior is quite predictable. And since it is mostly people who trade on the markets, we can predict its movement with some probability.
Well. Let's explore what these waves are.
Let's start by categorizing them.
The movements are mostly carried out by a five-wave structure.
📍 Modes: Motive & Corrective
Waves unfold in two distinct forms: motive and corrective. Motive waves exhibit a five-wave structure, featuring both a five-wave model and its co-directional components—waves 1, 3, and 5. The term "motive" is attributed to this structure due to its inherent ability to energize and set the market in motion. On the other hand, corrective waves, prevalent in countertrend movements, follow a three-wave structure or its variations. The name "corrective" stems from their nature as responses to preceding motive waves, executing partial retracements or "corrections" of the prior progress. Hence, these two wave types stand apart not only in their roles but also in their fundamental construction.
Motive
📍 Styles: Impulse & Diagonal.
There are two types of motive waves: impulse and diagonal. As a rule, they alternate in the position of waves 1-5 impulses and waves A-C of the zigzag.
📍 Patterns: Impulse, Leading Diagonal & Ending Diagonal
Five-wave action model. Creates forward progress.Motive waves are limited to three patterns: Impulse, Leading and Ending Diagonals.
Corrective
📍 Groups: Simple & Combined
The corrective mode has two groups, simple and combined. Combined corrections are subdivided into simple corrective structures.
The group of simple corrections includes: flat, triangle and single zigzag. Combined group — multiple zigzag and combination.
📍 Styles: Sharp & Sideways
There are two styles of corrective processes: sharp and sideways. If wave two of an impulse is a sharp correction, expect wave four to be a sideways correction, and vice versa.
📍 Patterns: Flat, Triangle, Single Zigzag, Multiple Zigzag and Combination 📍
Three-wave or five-wave (which have characteristics of both fives and threes) or their combination model of counteraction. Always produces a net retracement from the previous wave.
Corrective patterns include: single and multiple zigzags, triangle, flat, combination.
Variations
📍Divergences in Elliott Wave patterns manifest in two conditional categories: variations in form and variations in the quantity of simple structures. Impulses, diagonals, flats, triangles, and single zigzags are distinguished by the proportional length of their sub-waves, shaping the model uniquely. On the other hand, combined corrections, incorporating multiple zigzags and combinations, maintain a consistent shape, and their identification is based on the count of simple corrective structures they encompass.
This was an introductory lesson on Elliott waves. Further we will examine each type and subspecies of waves in detail in a separate lesson!
🔔 Click on the links below this lesson! 🔔
📍Part # 8, Combination - Corrective Waves.👩🏻💻 Hello !
This time we're going to look at combinations.
It may seem too complicated, but don't worry. In fact, any combination simply consists of two corrective patterns that you and I already know, only between these two patterns there is a connecting wave.
Let's go straight to the rules and everything will become clear to you at once!
✅ Rules ✅
📍A “double three” combination comprises two corrective patterns separated by one corrective pattern in the opposite direction, labeled 'X'. The first corrective pattern is labeled 'W', the second 'Y'.
📍A "double three" combination comprises (in order) a zigzag and a flat, a flat and a zigzag, a flat and a flat, a zigzag and a triangle or a flat and a triangle.
📍Wave 'X' appears as a zigzag or flat.
📍Wave 'X' always retraces at least 90 percent of wave 'W'.
📍Combinations have a sideways look. With respect to waves 'W' and 'Y' in a double three, only one of those waves in each type of combination appears as a single zigzag.
📍Combinations can occur in the same wave positions as flats and triangles (except for the triangle subwave) but cannot occur in waves 'W' and 'Y'.
✅ Guidelines ✅
📍Wave 'X' is often 123.6-138.2% the 'W' wavelength, less often wave 'X' retraces 161.8% or more. Don't expect wave 'X' to be more than 261.8% of wave 'W'.
📍Wave 'X' is usually a single or multiple zigzag.
📍When a zigzag or flat appears too small to be the entire wave with respect to the preceding wave (or, if it is to be wave '4', the preceding wave '2'), a combination is likely.
Thank you for your attention! There will be another lecture next week! Don't miss it!
🔔 Links to other lessons in related ideas. 🔔

BTC minor reaction to Intermediate degree correctionBitcoin is oversold on time-frames below 6W and overbought on 1D. This means the current move up is a minor reaction on Intermediate correction. I think the price will spike the ATH once again, but the probability price go significantly higher ATH is lower than vice-versa. Maybe around 85k.
The price action usually is moving in a channel boundaries. You can see the Primary trend lines on the chart. If to use Fib extension tool & apply it from 4 of April 2021 till the 12 of March 2024 top, the Intermediary correction target is matching with the channel boundaries it is between - 42075 - 29435. (0.382-0.618)
I guess the bottom might be near 34k.
Plus, we could use TVC, as an additional indicator: on a lower time frames - it was overbought and is not oversold on a higher TF.
So in a short term, the probability TVC will continue decline, whiting a couple of next weeks is high.
Good luck in your trading and have a massive profit !

BTC simple trading strategy for scalpers using H4Finished bullish Elliot Wave. Sideways should take half of bullishtrend, top of recent bearishtrend, create weak bullish candles or pass resistance and crash down.
Can form a triangle pattern. If not, it can do a cup pattern.
tip: use a to e waves to know sideways structure end. You can start it from lowest peak and set two more for structure understanding.
sideways should take around 25 candles but can reach lower if waves are small and shadows are big. Nothing changes if reaches more.

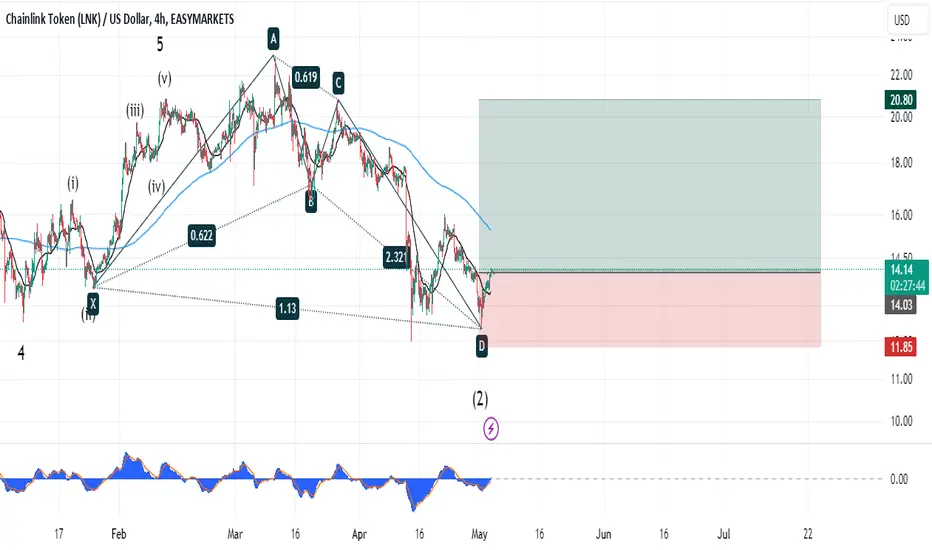
LNK/USDTGood Zone for buy.
we are in a second wave of big Elliott wave pattern and we have a anti-shark harmonic pattern.