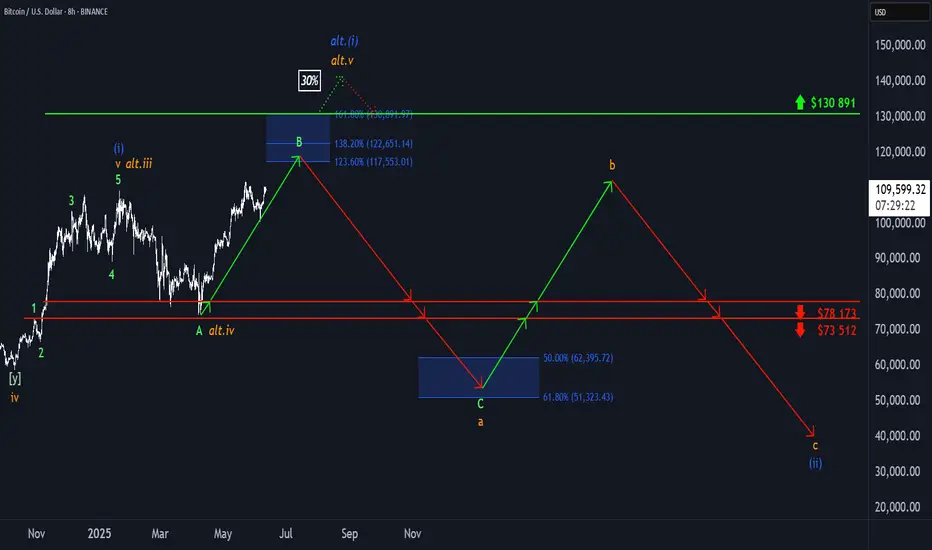
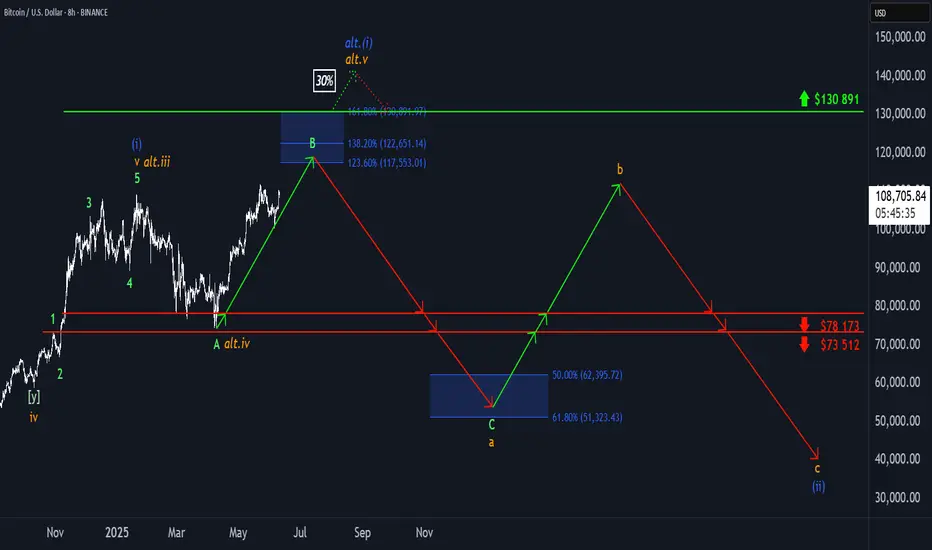
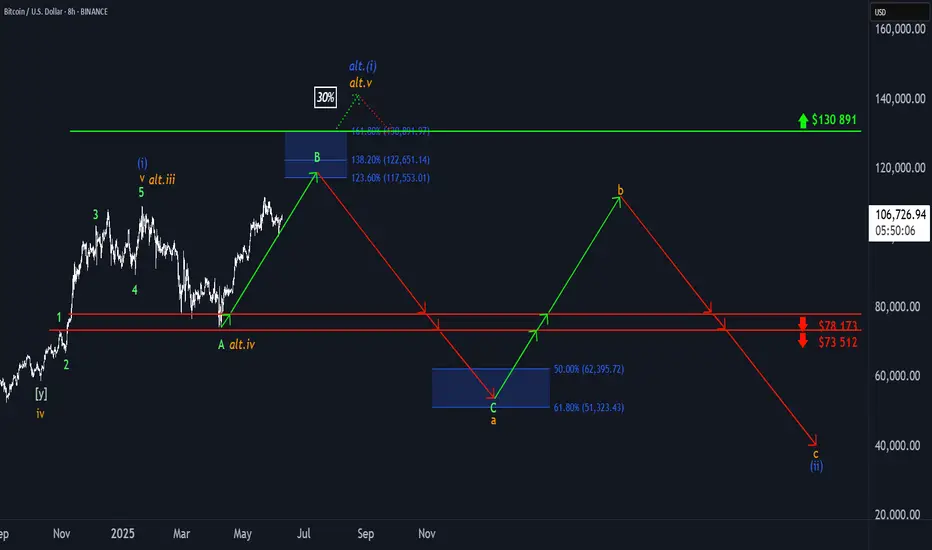
₿ Bitcoin: Further Upside ExpectedBitcoin (BTC) pulled back slightly in yesterday’s session but remains on track to continue its corrective rally within green wave B. In line with our primary scenario, this advance is expected to reach the blue Target Zone between $117,553 and $130,891. Afterward, we anticipate the onset of wave C, which should initiate a substantial decline—driving the price down into the lower blue zone between $62,395 and $51,323. This is also where we expect orange wave a to conclude. From there, wave b should provide a temporary rebound before wave c resumes the broader downtrend, ultimately completing blue wave (ii). That said, there’s still a 30% probability that blue wave alt.(i) has not yet topped. In this alternative scenario, BTC would extend higher, potentially breaking above resistance at $130,891 before the corrective phase resumes. The daily chart illustrates the entire five-wave blue sequence and shows our expected low for wave (ii) within the blue zone between $37,623 and $26,082.
📈 Over 190 precise analyses, clear entry points, and defined Target Zones - that's what we do.
Elliotwaveanalysis
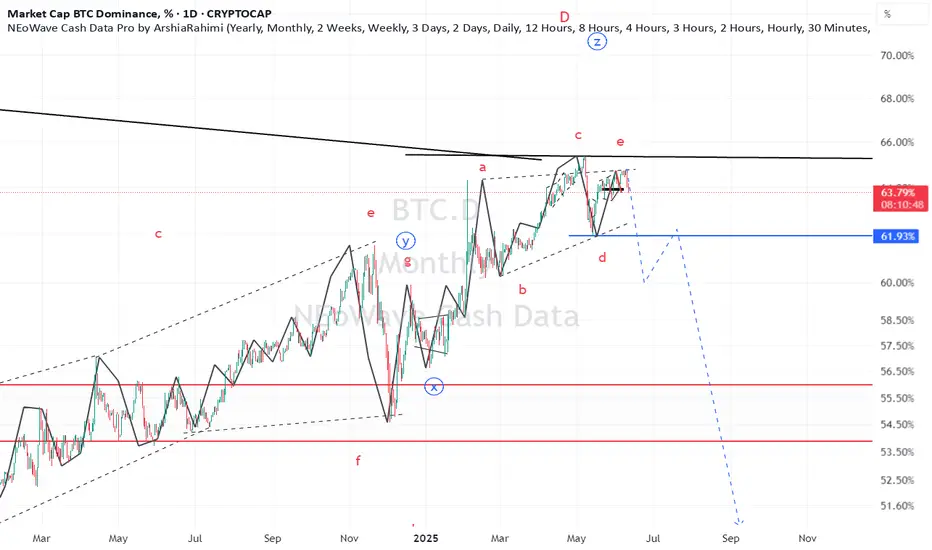
BTC.D(based one NEowave)the Z wave of this branch shown as a triangle and I think its finished but for confirmation breaking the 61.9 is important.
its a green light of Altseason.
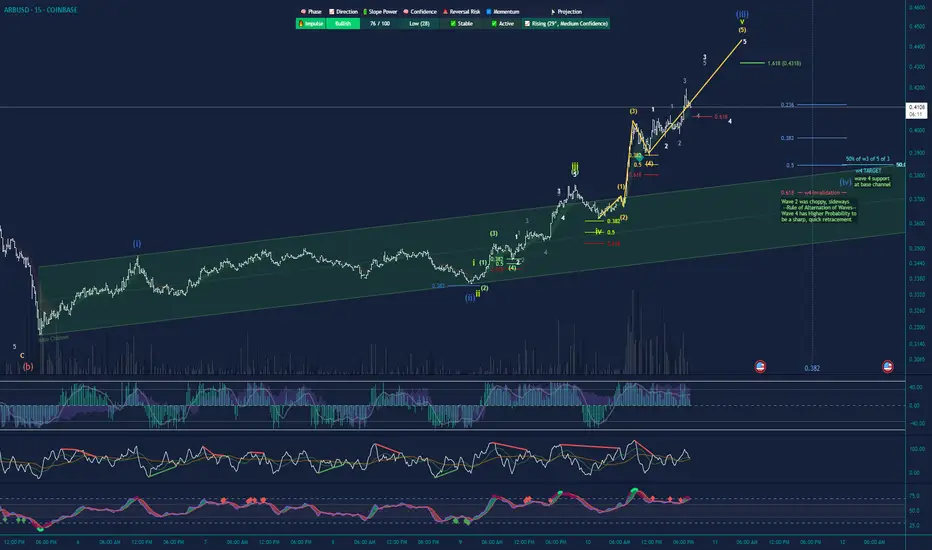
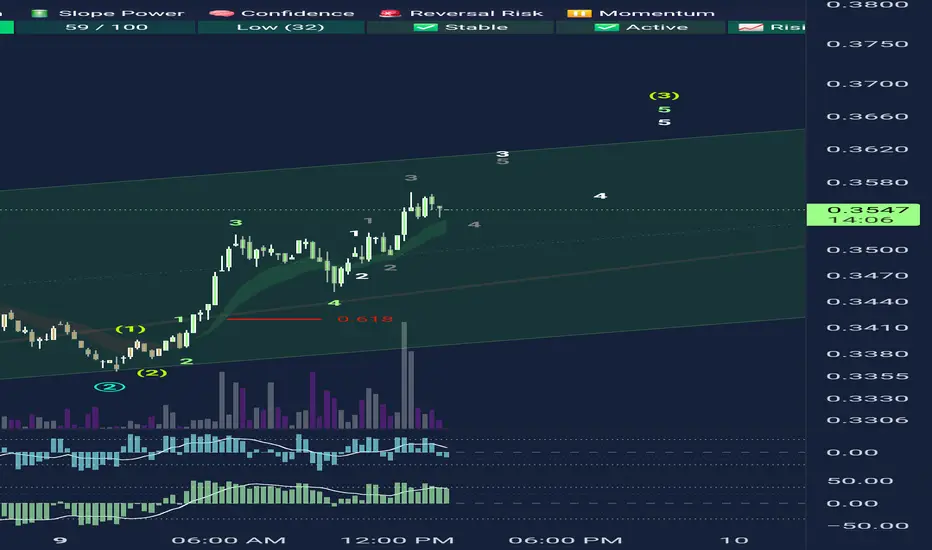
ALTS Bullish! Lots of wave 3 Bullish Impulsive patterns forming!This is an update to my past 3 Arbitrum posts. Clear impulsive price action, highest volume, indicative of wave 3s/extended waves. Lots of extensions of subwaves going on in the middle of the sandwich ( 3rd wave of blue wave 3 ), Happy Trading. NOT FINANCIAL ADVICE
"Markets can remain irrational longer than you can remain solvent"
COINBASE:ARBUSD
₿ Bitcoin: Push to the Upside! Bitcoin has made a significant push to the upside, which brought it closer to the upper blue Target Zone between $117,553 and $130,891, where we primarily expect the corrective rise of green wave B to conclude. We consider this price range an opportunity to take partial profits or to open short hedges for tactical protection of existing long positions — thus, we don't plan to sell all our Bitcoin holdings there. Potential short hedges could be secured with a stop 1% above the upper edge of the zone since there's a 30% chance that price could exceed this zone to develop a new high for blue wave alt.(i) before reversing later. Primarily, however, green wave C should commence in the upper blue zone and drive BTC down into the lower blue zone between $62,395 and $51,323—and thus to the low of orange wave a.
📈 Over 190 precise analyses, clear entry points, and defined Target Zones - that's what we do.
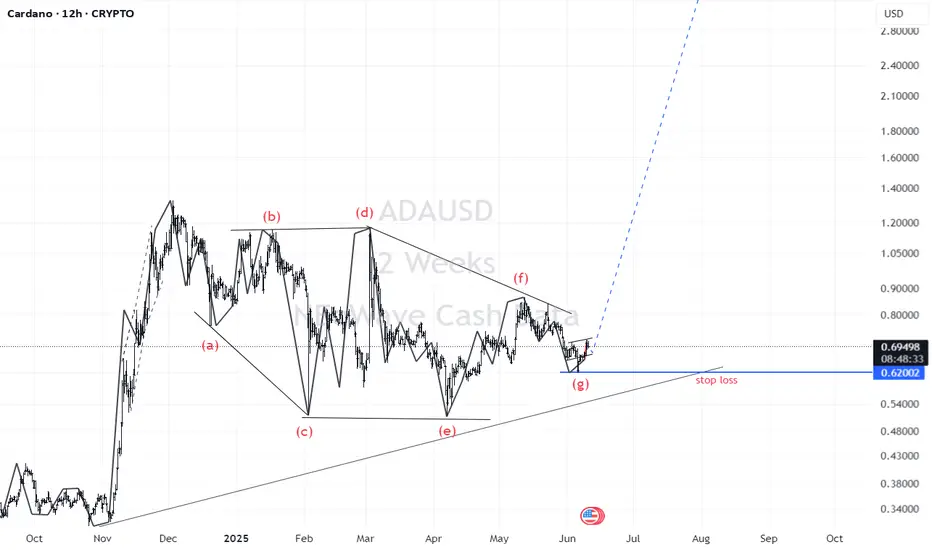
ADA(based on NEowave)this branch of Cardano is diamond diametrical but I didnt count the other branches and the larger degrees but based on ETH and other Altcoins I think it will pump soon.
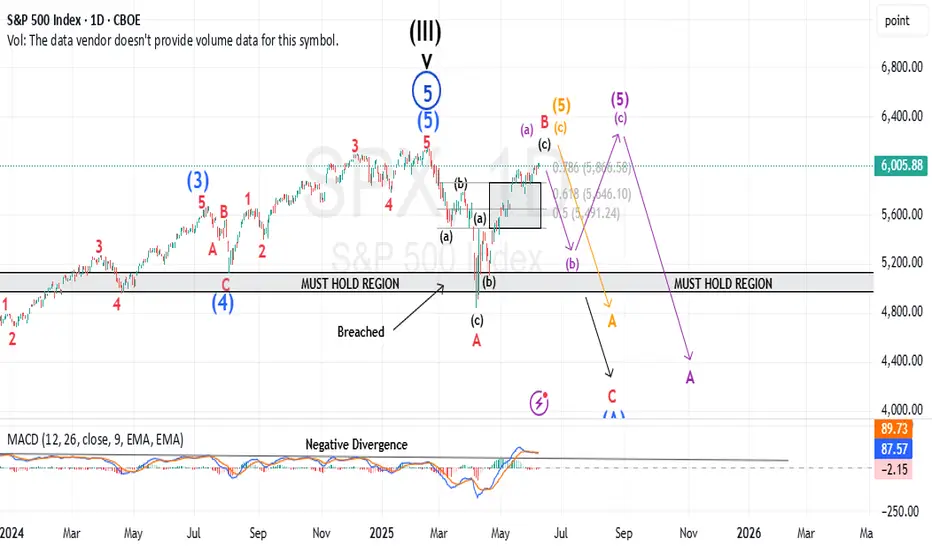
A Potentially Dangerous Pattern Takes ShapeWhile the futures market has yet to break into new all-time high territory, the previously discussed bearish micro setup has now been invalidated. In its place, we’re witnessing a complex, overlapping advance—creeping steadily toward the prior highs in the S&P 500 (ES).
At the micro level, I currently see no compelling bearish setup. However, this grinding upward move—lacking strong conviction from either buyers or sellers—is not necessarily bullish. In fact, it’s a hallmark of a potentially dangerous pattern: a primary degree ending diagonal.
If my interpretation is correct, both the “orange” and “purple” wave counts point to the same ominous conclusion. They suggest that what we're seeing could culminate in a sharp, possibly violent reversal—one that would ultimately retrace back to where this entire primary wave began. For reference, that’s just above 4,000, marked by the conclusion of Primary Wave 4 in October 2022.
This is the moment for caution—not after the damage is done.
Yes, we may push into new all-time highs. But within this fragile and overlapping structure, that outcome is far from guaranteed. Even if we get there, the looming question remains:
At what cost?
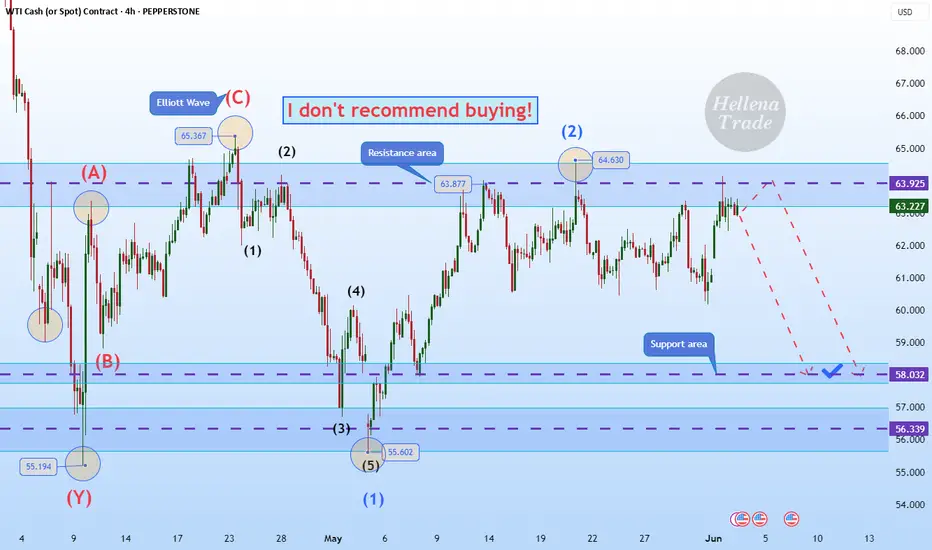
Hellena | Oil (4H): SHORT to support area of 58.00.Colleagues, the previous forecast did not meet expectations for too long, and the price has been in a prolonged sideways movement.
In this regard, I decided to slightly revise the waves and make a new forecast.
At the moment, I believe that the price will resume its downward movement in the medium-term wave “3.” The complex configuration of the correction makes it difficult to fully understand whether it is a combined correction or a five-wave movement.
In either case, I expect the price to reach the support area of 58.00.
Manage your capital correctly and competently! Only enter trades based on reliable patterns!
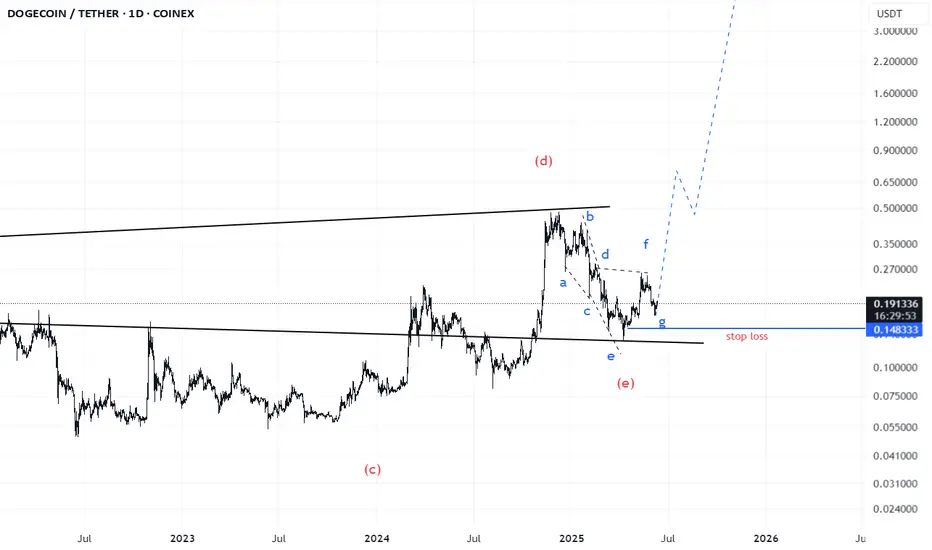
Doge(based on NEowave)like ETH wave E is ending and soon it will start a huge bullish wave.
wave E look likes a bow-tie diametrical and wave g is at the end which is the last chance to buy.
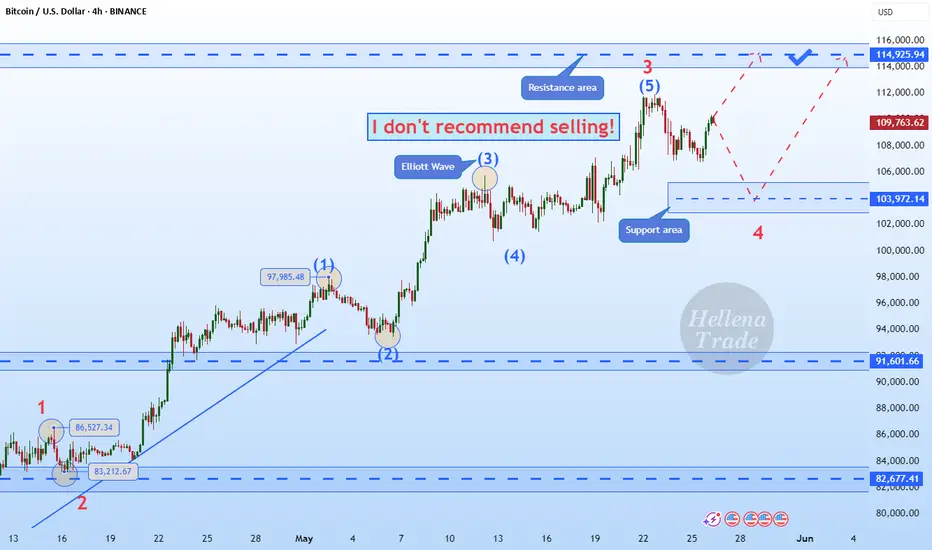
Hellena | BITCOIN (4H): LONG to resistance area of 115,000.I see that price has shown a violent rise in a five-wave move and I have redrawn the waves a bit to make it clear where to expect a correction. I think we are currently seeing a correction in wave “4” (104,000).
But most importantly, I expect an update of the high. Therefore, I believe that the level of 115,000 will be reached and it may be a wave “5”, after which we can expect a deeper correction.
Manage your capital correctly and competently! Only enter trades based on reliable patterns!
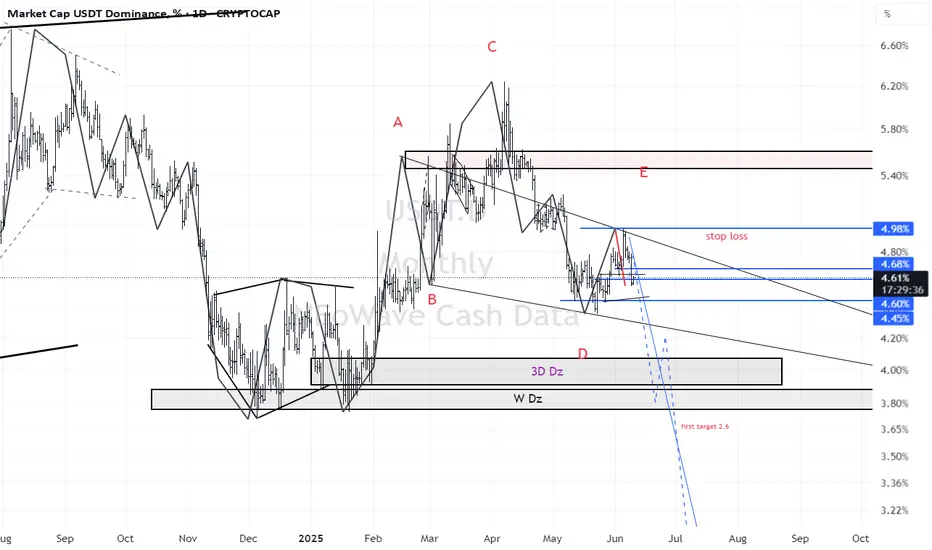
USDT.D(based on NEowave)I think wave E of triangle touched the necessary high and crypto is ready for a big pump.
pay attention to the targets and stop loss!
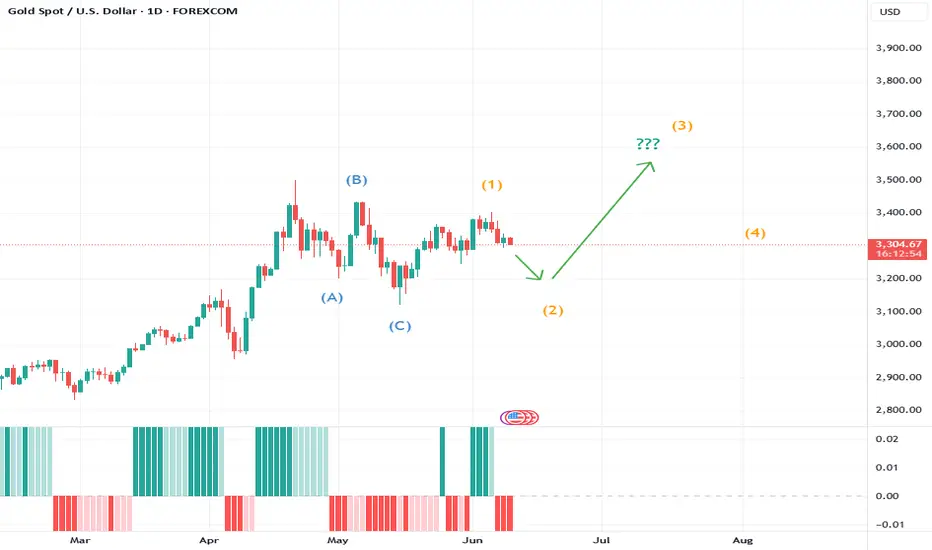
Gold’s Week Ahead: Structure, Scenarios, and What to WatchChart Overview:
Gold (XAU/USD) is at a critical juncture. The recent action shows a completed three-wave correction, and price is now setting up for what could be a powerful motive wave. My primary scenario is a bullish move once the current structure matures, but I’m also tracking alternate counts—flat, triangle, and double zigzag—all of which still point to at least one more push higher.
Why This Count?
The leading diagonal (5-3-5-3-5 or 3-3-3-3-3) for wave 1 fits the textbook, with wave 4 overlapping wave 1—a classic Elliott Wave signature.
The three-wave correction appears complete, which often signals the start of a new impulsive sequence.
I’m watching for confirmation: a completed corrective pattern and a strong move off the lows.
What’s Next?
If the correction finishes and price holds above the wave 1 low, I’ll be looking for a long setup targeting the 100% or 1.618 extension of wave 1.
Invalidation is simple: if the wave 1 low breaks, the count is off and I’ll reassess.
I’ll wait for structure to complete before entering—patience is key.
Update on Arbitrum wave 3 Extension! Bullish!
Update! Subwave 3-3-3 confirmed. Expected continues grinding up as we complete the remaining wave 4,5-4,5 structures. Elliott Waves are so cool 😎

Update on ARB! Bullish Impulse confirmed!ARB according to my Elliott Wave Theory knowledge, is currently grinding up in a bullish impulse. Wave 4 retraced around 38%-50% .618 invalidation looking lonely, just how I like it 👌. Subwave 3 of 3 maybe complete as we seem to be building a triangle structure, indicative of a wave 4. Not financial advice!
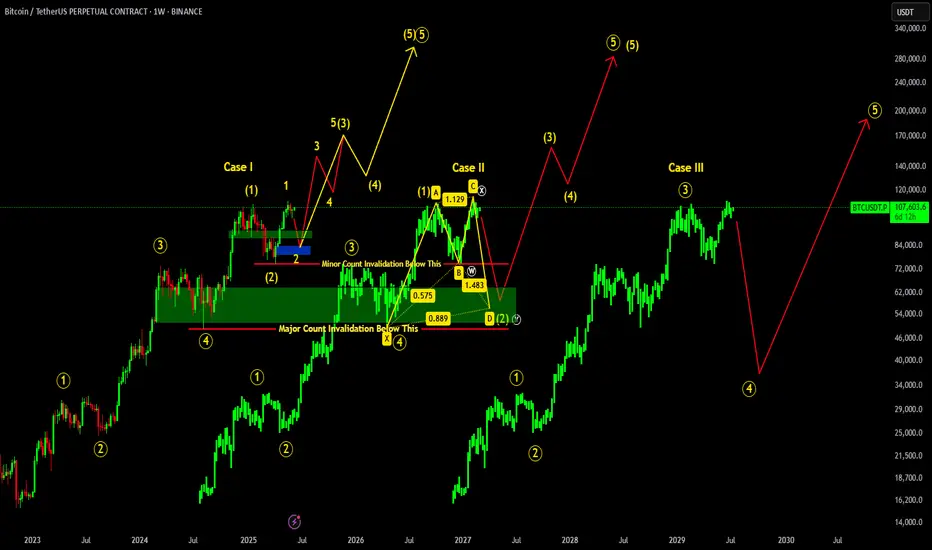
BITCOIN ROAD TO 300K !!! ELLIOTT WAVE CASE STUDYThere are three possible cases for Bitcoin which we can now consider according to Elliot wave count on big picture:
Case I: According to this count if we hold above 74.5k , recent low, we may see major shift in BTC. Retracement Up to 92-79k is good which will form inverse head & shoulders, potentially breaking ATH up to 170K, if things goes well & 74.5K region remains on hold.
Case II: If in case 74.5K region breaks, then it will invalidate minor count causing BTC to retrace more up to 64-52K major reversal zone region. If such thing happens, bullish shark pattern will be formed causing major reversal from that region BUT 49K region should remained hold!!!
Case III: Worst case scenario if 49K region breaks, then it will cause major count invalidation dropping BTC further up to 45-33K region.
₿ BTC: Upside Potential Remains IntactBTC posted modest gains over the weekend, but more upside is expected in our primary scenario. We continue to track a corrective advance in green wave B, with the potential to extend into the upper blue Target Zone between $117,553 and $130,891. From that top, wave C should initiate a downward move into the lower blue zone between $62,395 and $51,323—completing orange wave a. Subsequently, we anticipate a bounce in wave b, followed by another decline in wave c, which should conclude the larger correction of blue wave (ii). There is still a 30% chance that blue wave alt.(i) could make a new high, extending beyond the Target Zone and delaying the broader corrective sequence.
📈 Over 190 precise analyses, clear entry points, and defined Target Zones - that's what we do.
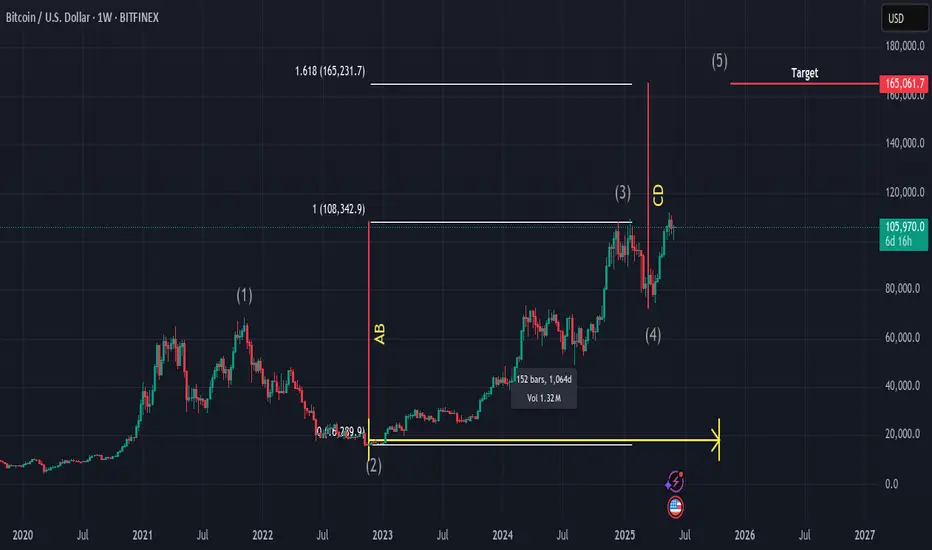
BTCUSD analysis for this cycle TopBTCUSD analysis for this cycle Top
1. According to the Elliot wave it is the 5th wave of elliot theory
2. As per the time cycles Btc should define the top in the last quarter of this year possibility in (oct or nov)
3. And for the projection as always the Btc favourite patthen AB=CB is also in play.
4. Fib extension tool level 1.618
So as we can see if btc will play according to this analysis. As its always follows this same things again & again in all cycle. So we can expect the top somewhere around (165,000).
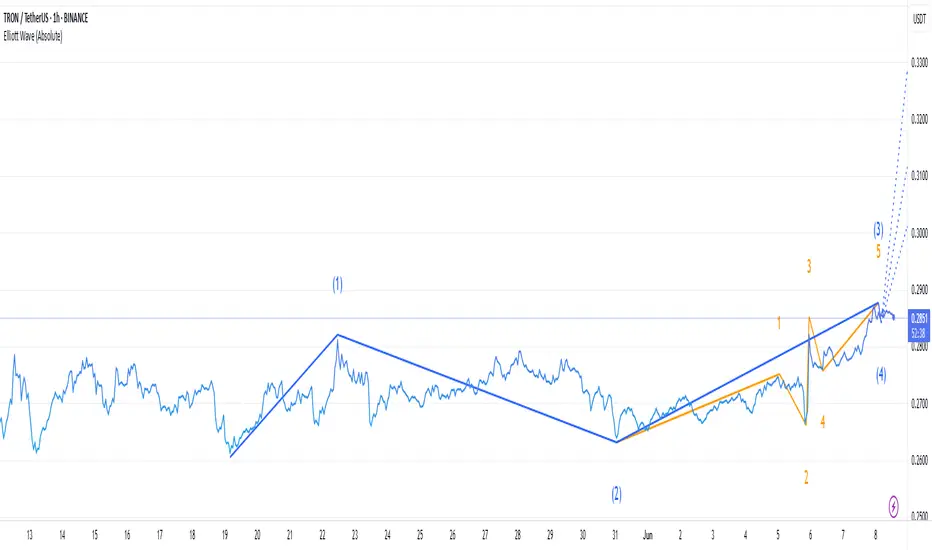
TRXUSDT at the Crossroads: Breakout or Stall?TRX is currently in the multi-leg Wave 4 consolidation, a classic corrective phase before the anticipated final Wave 5 impulsive.
This consolidation phase is healthy within the larger trend, allowing for overbought to fade before the next move higher.
A clear breakout above the $0.28–$0.30 range would affirm the Elliott Wave forecast, targeting $0.30 → $0.31 → $0.33. A confirmed close above $0.30 would unequivocally solidify the Wave 5 scenario, paving the way for these upside objectives.
The 81.77 monthly RSI suggests an overbought market, supporting the anticipation of continuous consolidation within Wave 4, potentially retracing back to the $0.25–$0.27 support zone before resuming higher.
Long-term trend indicators are firmly bullish, with the Monthly EMA (20) at $0.1911 and SMA (20) at $0.1769, both considerably below current price action, confirming unbroken upward momentum within the greater timeframes.
So while short-term price action suggests consolidation, technical stance favors continuation to the higher side, and a breakout above $0.30 would signal Wave 5's beginning and continued momentum towards $0.33.
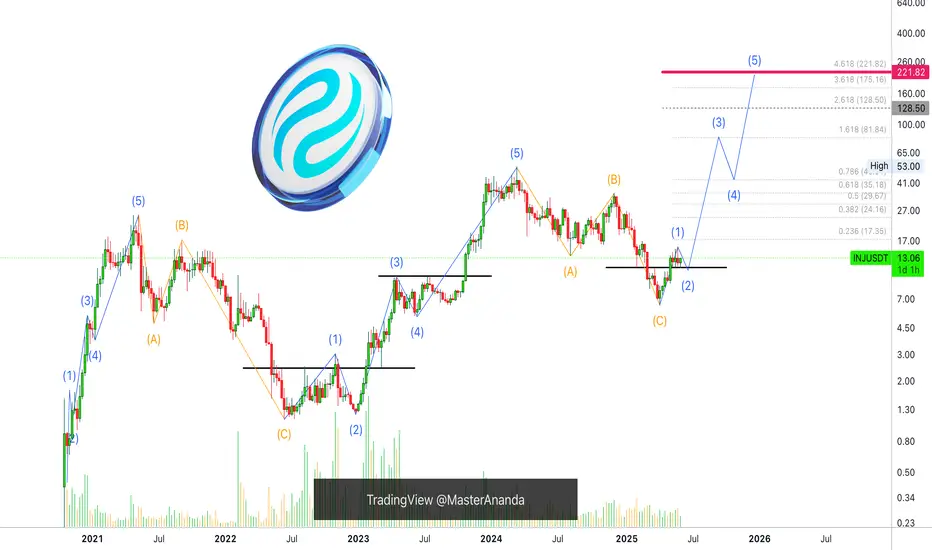
Injective & Elliott WavesAn impulse leads to a correction. A correction leads to an impulse.
The chart here starts with a bullish impulse. 1,2,3,4,5—blue-left. This impulse leads to a correction. ABC—orange.
The first ABC correction, the bear market, ends June 2022.
A correction leads to an impulse so a new bullish impulse starts right after and we have a new 5-up waves. 1,2,3,4,5—blue-center.
The bullish impulse ends March 2024 and this leads to a new ABC correction. Orange-right. The correction hits bottom 7-April 2025. The end of the correction signals the start of a new bullish impulse, 1,2,3,4,5 blue-right. The 2025 bull market.
This is Elliott Wave Theory simplified.
Namaste.
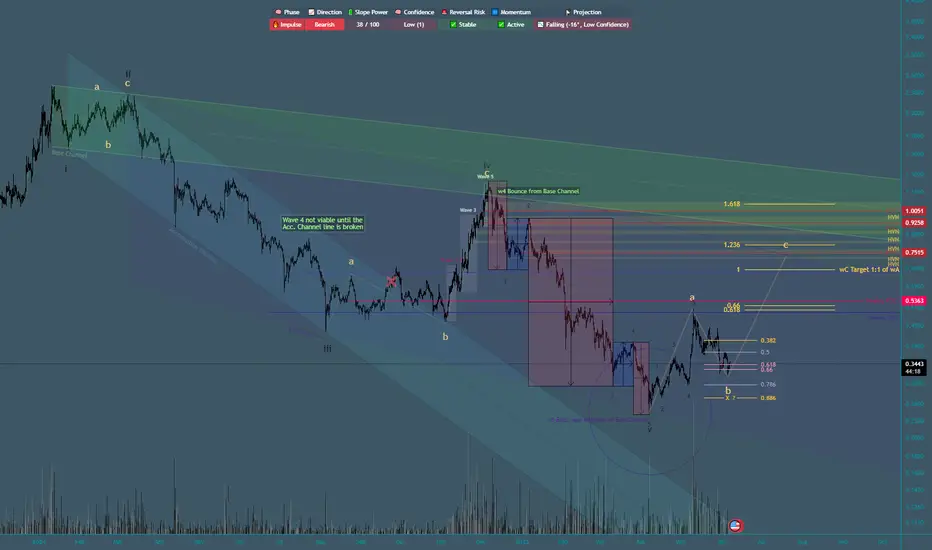
Bearish Impulse Complete! Possible zigzag correction in play.Bearish wave 5 of impulse completed the Bearish Trend, now correcting to the upside in a zig zag structure, leg A & B complete, now for wave C im targeting the 1:1 of wave A. We will see if this remains a 3 wave structure, or if it runs into 5 waves it could be an A/W wave of a larger correction. I am still studying Elliott Waves so ahem, this is not financial advice!
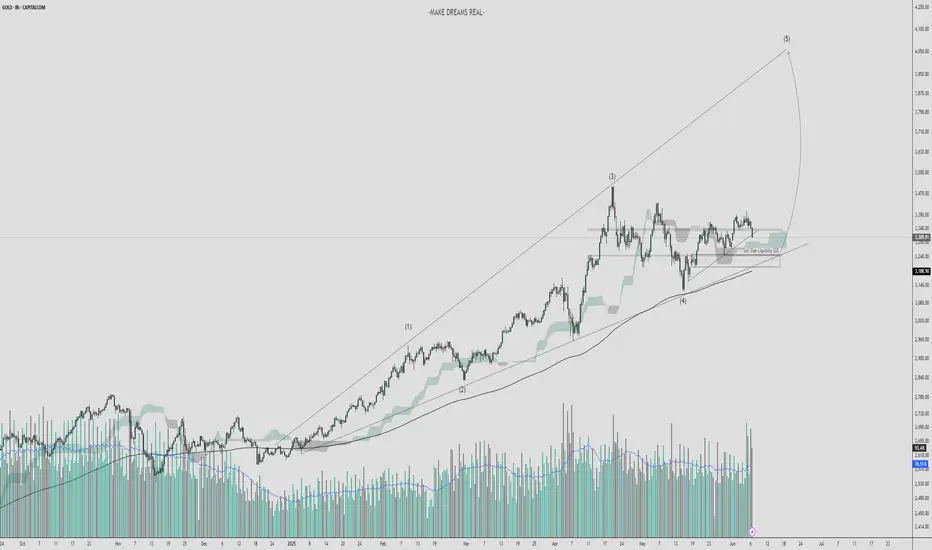
Gold (XAU/USD) - 8H Time Frame Analysis - High Probability setup🔍 Bias: Strong Bullish Reversal from Demand (Wave 5 expected)
📌 Key Confluences:
Wave (4) retracement tapped into major demand zone and sell-side liquidity pocket.
Held support above the 200 EMA and dynamic cloud zone.
Volume spike near support shows accumulation by strong hands.
Wave (3) had strong momentum – wave (5) could extend to 4,000+ levels.
🎯 Trade Idea:
Buy Gold (XAU/USD) at 3,180 – 3,220
Stop Loss: Below 3,100 (invalidation of structure + trendline)
Take Profit: 3,950 – 4,050 (based on wave (5) projection)
⚠️ Risk Note: Wait for a bullish engulfing candle or volume confirmation above 3,250 if conservative.
This setup is a textbook bullish continuation off a major correction, supported by clean structure, liquidity sweep, and wave alignment — making it a prime high-probability buy for the next leg up.
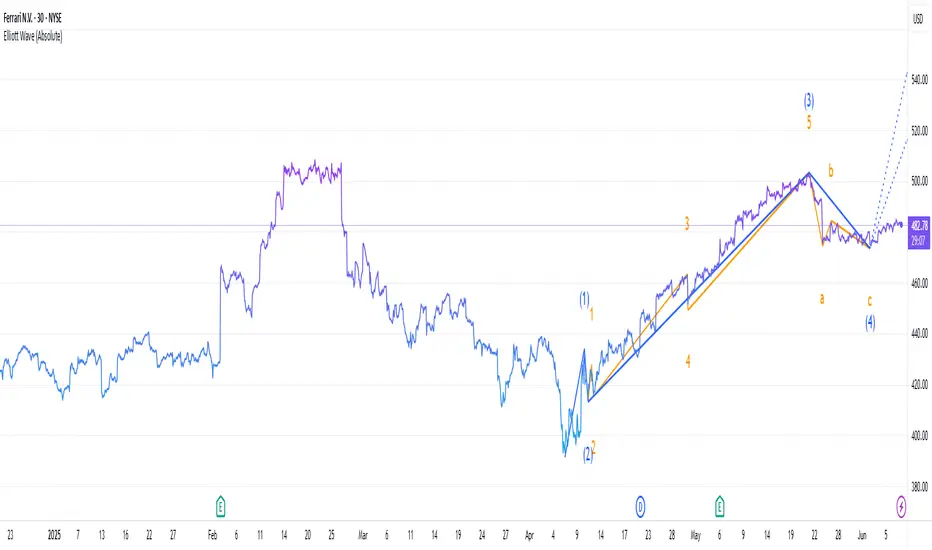
Is Ferrari's stock still bullish?Is Ferrari's stock still bullish?
Technical Outlook
Elliot Wave theory suggests a cautious bullish stance. The present correction seems to be a temporary setback, likely driven by guidance and tariff fears, but sets the stage for a potential rally to $520-$540 if support is not broken. However, risks of a deeper correction (i.e., to $420-$440) persist if pressures from the outside intensify.
The stock is currently trading above all three of its major EMA levels — daily, weekly, and monthly — that is a good technical signal. The rising daily EMA at 479.98 suggests that short-run momentum remains healthy. The weekly EMA at 461.77 provides medium-term support, while the monthly EMA at 421.08 supports the longer-term trend solidly.
Positive Sentiment Factors
Ferrari reported robust Q1 2025 results, with net revenues of €1.79 billion (up 13% YoY), an operating profit of €542 million (up 22.7%), and a net profit of €412 million (up 17%). Adjusted earnings per share were €2.30, surpassing analyst expectations of €2.28. This shows Ferrari’s strong pricing power and demand for personalized vehicles.
Analyst Sentiment: Optimism remains for Ferrari among some analysts. UBS raised its price target to $560 from $520, maintaining a Buy rating, with the new Ferrari Elettrica a major catalyst, the company said. Bernstein and RBC Capital maintained Outperform ratings on the stock at $575 and €500, respectively. Barclays upgraded Ferrari to Overweight, calling it a "safe haven" in a shaky European automotive environment.
Brand Strength and Strategic Positioning: Ferrari’s luxury brand and high demand for models like the Roma Spider, 296 GTS, SF90 XX, and Purosangue bolster its market position.
Neutral Sentiment Factors
Market and Industry Context: The broader market has been volatile due to trade developments and tariff relief rallies. Ferrari’s stock has been influenced by these macroeconomic factors, but its luxury positioning makes it less sensitive than mass-market automakers.
Formula 1 Performance: Ferrari’s underwhelming Formula 1 season, with McLaren significantly outscoring Ferrari in points poses some concern among investors. While this does not directly impact stock performance, it may indirectly affect brand sentiment among enthusiasts.
Negative Sentiment Factors
Tariff Concerns: Ferrari shares have been sensitive to Trump's U.S. tariff policies. A tariff increase would add up to $50,000 to the price of an average Ferrari, potentially cutting sales volumes in the U.S., which accounts for 28.8% of net sales. JPMorgan warned that tariff impacts might be "worse" for Ferrari, lowering the price target to $460 from $525
Conclusion
Ferrari stock has a bullish but cautious bias, supported by solid fundamentals, favorable technical momentum, and positive analyst sentiment on upcoming product releases such as the Ferrari Elettrica. Macro risks, however, including U.S. trade policy and market volatility, are still major overhangs.
₿ BTC: Delay Tactics in Wave B Bitcoin dropped hard yesterday, throwing a wrench into the expected climb toward the top of green wave B. This bounce was supposed to stretch into the upper blue Target Zone between $117,553 and $130,891, which we flagged as a smart area to take partial profits or layer in short hedges. That zone still stands—BTC just isn’t ready to hit it yet. The current pullback suggests we’ll see more sideways-to-lower price action before green wave B wraps up. Once it does, green wave C should drag Bitcoin into the lower blue Target Zone between $62,395 and $51,323. That’s where we’re looking for orange wave a to complete. After that, a countertrend rally in wave b could pop up—before wave c wraps the entire corrective cycle and finishes blue wave (ii). We’re also watching an alt.(i) breakout scenario (30% probability). In that case, BTC would blow through the $130,891 level early, bypassing the expected dip and reaching new highs faster than projected.
📈 Over 190 precise analyses, clear entry points, and defined Target Zones - that's what we do.

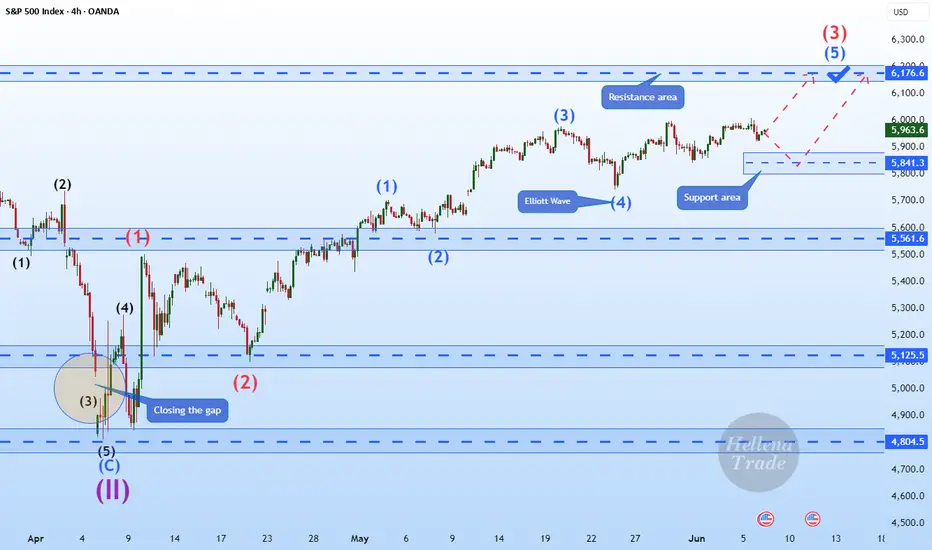
Hellena | SPX500 (4H): LONG resistance area of 6176.6.Colleagues, it appears that price has not yet completed the upward movement in a five-wave move.
At the moment I expect the continuation of wave “3” and reaching the target in the resistance area of 6176.6.
Manage your capital correctly and competently! Only enter trades based on reliable patterns!