My bitcoin/usd longterm predictionBitcoin has finished the correction from the high of 13800
on june 2019 and is ready for a new bull move.
According to my wave system the waves will form as shown
on chart.
Wave 1 is going to end between $8000 and $9000.
Wave 3 is going to end between $13.100 and $15.600.
Wave 5 is going to end between $24.500 and $30.000.
As to the corrective waves 2 and 4
i am going to give you targets after
bitcoin reaches each target first, wave1
and wave 3.
After that, bear market again as usual.
risk disclaimer
This prediction is based on my personal trading strategy and this article does not suggest you to make any trades. I am not responsible for any future losses using the information above.
Elliotwavecount

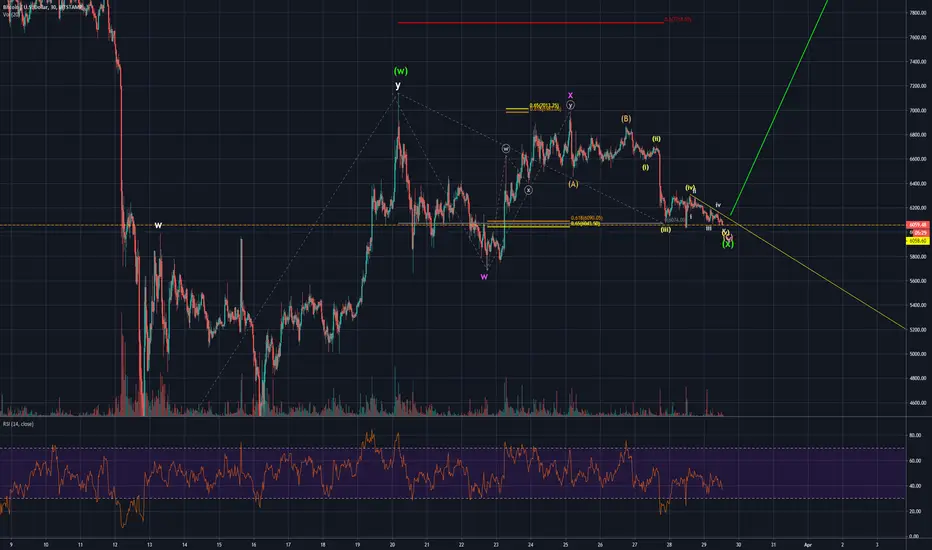
BTCUSD: Triangle Correction Suggests Long EntryHi Traders,
Price is on track to complete what we call a running triangle (wave b in the triangle has tested the beginning of wave a), which will only be confirmed once wave e holds above wave c.
The long setup will be confirmed on the bull breakout.
Regards
Wave Theorist

USDSGD Bearish Continuation SetupThe price decline in five waves "impulse" after testing a double top area. Price is making a corrective pullback which will most likely unfold as a zigzag pattern based on the rally in wave (A).
Once the correction is completed, the price is expected to resume in the direction of the impulse.
Thanks for reading!

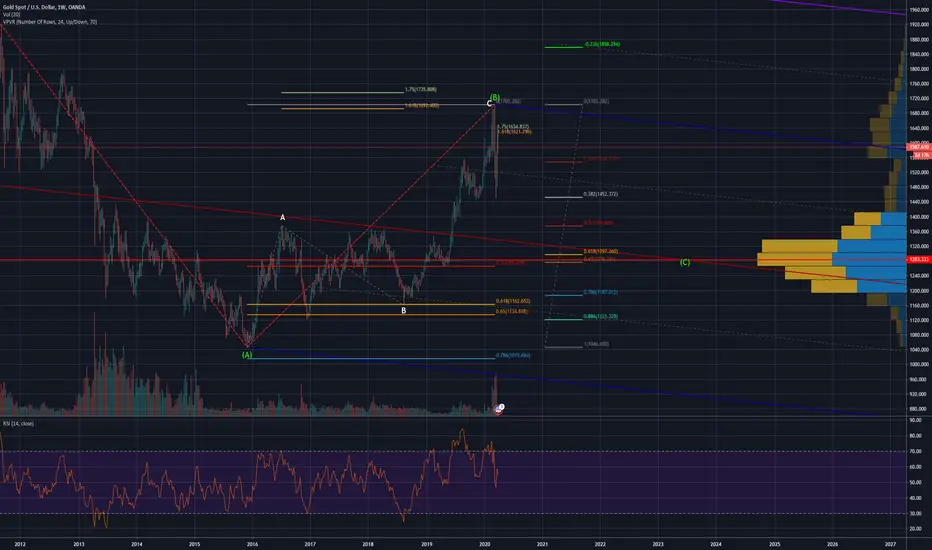
XAU/USD Gold going DOWN until June 2023B wave count simple 5-3-5 zig zag to the 1.618 extension on low volume w/ bearish divergence at the $1703 top and we're expected to come down significantly.
Its an internal retracement still correcting from all time highs so I'm looking at volume profile coming down from ATH. The point of control is around $1280 which led me to consider changing the pitchfork from original to schiff. As we know, price will at least tap the median line 80% of the time. This also coincides with a 50% fibonacci extension of A at $1265, the golden pocket 0.618-0.65 retrace of B at $1297-$1276.
I know triangles are supposed to have 3-3-3-3-3 structure, but is it possible this forms a symmetrical triangle and we don't get a breakout until the latter half of the decade? I struggle with labeling and couldn't put a count on it but to me the first leg down looks like wxyxz. It looks like the initial move down from ATH could never be considered a 3 wave structure. Can someone share their count?
This is not financial advice and please do your own research.
update/overview for BTC from long post last nightwaiting to buy the retrace on the bounce from last night

BTC/USD LONGtight stop good r/r here.. possible count? throw a pitchfork on it if this holds and bounces for precision target


Silver Is Heading to $11 After A Short-term RecoveryHere we can see Silver making a simple zigzag pattern from September 2019 high. Wave (a) unfolded as a leading diagonal with 3-3-3-3-3 internal structure.
It then followed by an a-b-c zigzag retracement in wave (b). Since the completion of wave (b), the bears have enjoyed a massive decline in wave (c) which is not completed yet.
According to Wave Theory, five-wave make an impulse. Price seems to just complete wave iii of (c) in CADJPY's case, and wave iv is in the making.
This, in turn, meant that once the recovery in wave iv ended, another selloff in wave v of (c) would be very likely to complete the five-wave impulse pattern.
Wave iv has the potential to retest the blue resistance level that lined up with a 38.2% Fibonacci level.
What's your view on Silver?

GOLD Short Trade SetupXAUUSD made a five-wave impulsive decline and price is currently retracing the sell-off.
The correction seems incomplete with regards to the impulse it's correcting. I would like to see a short-term rally to retest the double top neckline that lined up with a 50% Fib ratio.
If we get the deeper correction, it would be a great short.

Price of Silver Is Trading In a Triangle, What Does This Mean?In the market, there are no guarantees, only probabilities. That is why traders must always look and prepare for different scenarios.
If you have been following my analysis on Silver for a while you have probably seen some of my analysis suggesting Silver could rally to around $22 articles.
However, my bias has changed in the last few weeks as the price is unable to move in five-wave higher to break 2019 high. Instead, XAGUSD has been moving sideways. This behavior reminds me of more and more of a triangle correction under construction.
See the idea on the chart above.
The Elliott Wave Principle states, that triangles are sideways corrective patterns, constructed of five waves, labeled A-B-C-D-E, where each wave is smaller than the previous one unless it is an expanding triangle.
It appears that the Silver exchange rate has almost completed wave D to the downside during Friday's session. If this count is correct, we should expect another rally in the face of wave E, which would complete the whole triangle.
By any means, if my assumption of a triangle is right, wave D should not breach wave B low, and wave E should stay below wave C high. According to the Elliott Wave Principle, triangles precede the last move of the larger sequence. That is, Silver should resume its larger degree downtrend as soon as the correction is over.
What's your thought about Silver?

Last Week Price Action Is a Bad Omen For GoldIn the recent article I published on Gold "How Far Will the Prices of Gold Fall, $1000/oz", I made mention how XAUUSD is completing a major Elliot Wave pattern that could lead to a massive sell-off if the count is correct. Last week sharp decline on Gold as the coronavirus threat increased globally further confirming the setup.
In the daily chart above, we could see how the price made a double top at the upper trend channel before the plunge that breaks out of the channel support on Friday. This decline on the lower time frame can be see as a five-wave impulse , see the chart below.
According to Elliot Wave theory, five-wave impulse pattern indicates the direction of the larger trend. In Gold's case, the direction of the impulse is bearish and as long as $1703/oz high remains intact, we should be seeing a short-term corrective rally on Gold, followed by a long-term decline.
What's your thought on Gold?
Check related ideas for previous analysis on Gold.

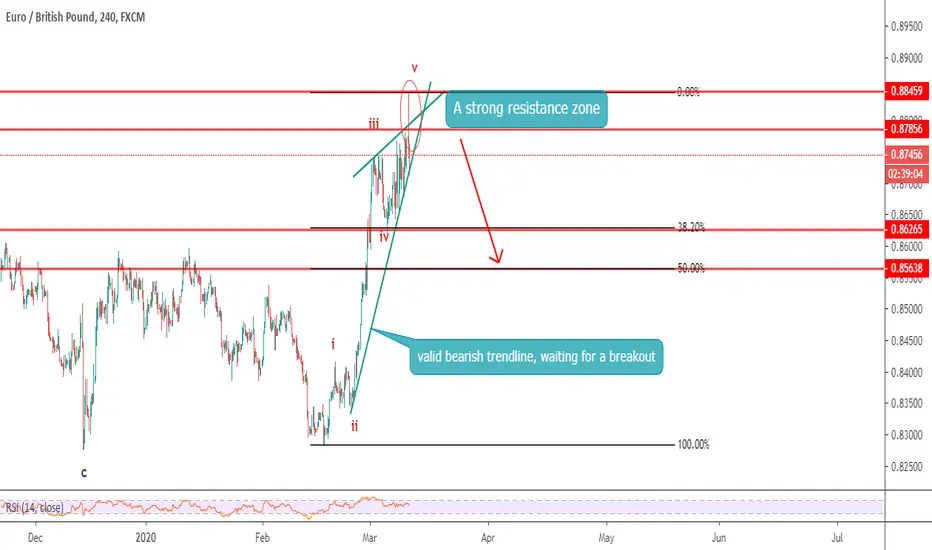
EURGBP, Ready to sell for retracement Reasons to SELL
1/ complete 5 wave impulse movw which can be wave 3 or wave c
2/ A bearish divergence
3/ waiting for a breakout of the valid bullish trend
4/ A Shooting star candlestick pattern at a strong resistance
expecting to trade the correction of the whole impulse wave
to minimum of 38,2 or 50% Fibonacci level
Therefore we are trading either wave 4 correction or we are trading anew impulse wave
Write in the comments all your questions and any instruments you want me to analyze .
Kindly push the like button if you think the idea is useful - that would be the best THANK YOU.
Thank you.
GOLD Shorter Cycle Sell SetupGold decline from the recent top can be seen as a leading diagonal pattern in wave i. Leading diagonal always point in the direction of the larger trend, so it's ideal to expect more sell-off once wave ii correction is completed.
The break of the blue line will confirm the completion of correction and the red line is the major invalidation level for this bearish bias.

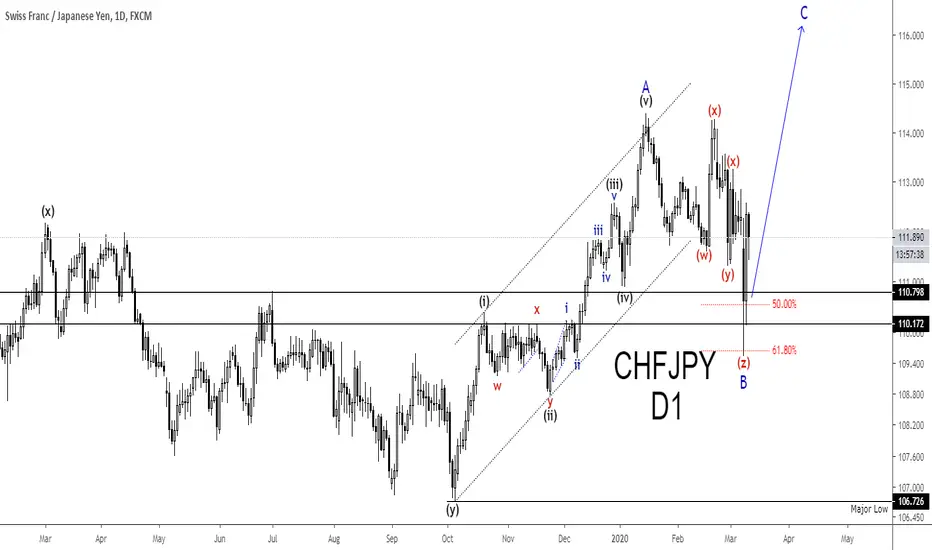
CHFJPY Sets To Resume Another RallyCHFJPY has just completed a 5-3 "impulse-correction" Elliot wave cycle.
The corrective structure was complex and erratic due to the last few weeks of volatility.
However, the price seems to make a triple zigzag pattern and rejected 61.8% Fibonacci level that lined up with the weekly support zone.
Price has the potential to move higher in five-wave and target above wave A high is plausible in the weeks ahead.
Looking for bullish price action at HL will be a good signal to position in this new bullish trend.
What's your take on CHFJPY?
NASDAQ 100 Futures UpdateOANDA:NAS100USD
TVC:NDX
NASDAQ:QQQ
My view that a rise in wave c of B of a correction is coming has not changed.
We are in the ending of a correction within a larger correction and corrections by nature are notorious beasts to predict their shapes and forms - as opposed to impulsive trend moves which are easier to predict.
I believe another minor low is needed in this c of b of B (lol !) to complete a more ideal 5 wave form. It might happen today or on Asian opening Sunday night.
This drop is at the 78.6% retracement of" a of B" rise so it is pretty much "do or die" zone so fingers crossed.
I believe the low of larger A should hold, however.
Because of the larger drop in b of B I have lowered my target of the end of wave c of B to the 61.8% retracement zone wave A drop (crash of last week) as opposed to the 78.6 retracements.
Since "a of B" rose based on hopes and rumors of Fed intervention, I am speculating that the rise in "c of b" to come will as a result of hopes/announcements of good news - either new Fed intervention and/or in combination with some kind of Trump Admin fiscal stimulus package or just plain and simple - the mythical PPT (Plunge Protection Team) :)
Let's see what news or rumors transpire over the weekend.
Cyrus

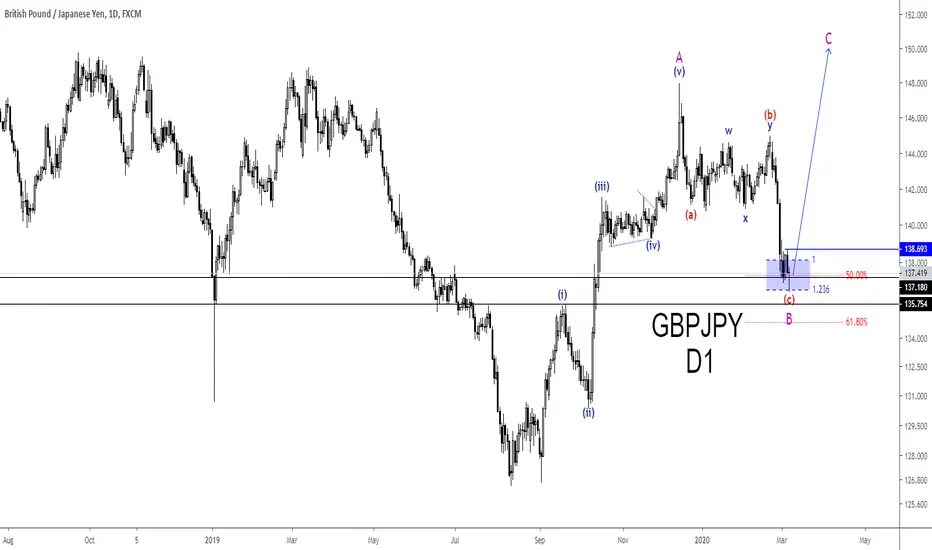
GBPJPY is Drawing a Pattern That Favor the Bulls.GBPJPY has just completed a 5-3 "impulse-corrective" Elliot Wave cycle.
The correction is retesting a weekly support level that lined up with a 50% Fib ratio.
Price has the potential to move higher in wave C to complete the zigzag. Target above wave A high is plausible.
What's your view on GBPJPY?
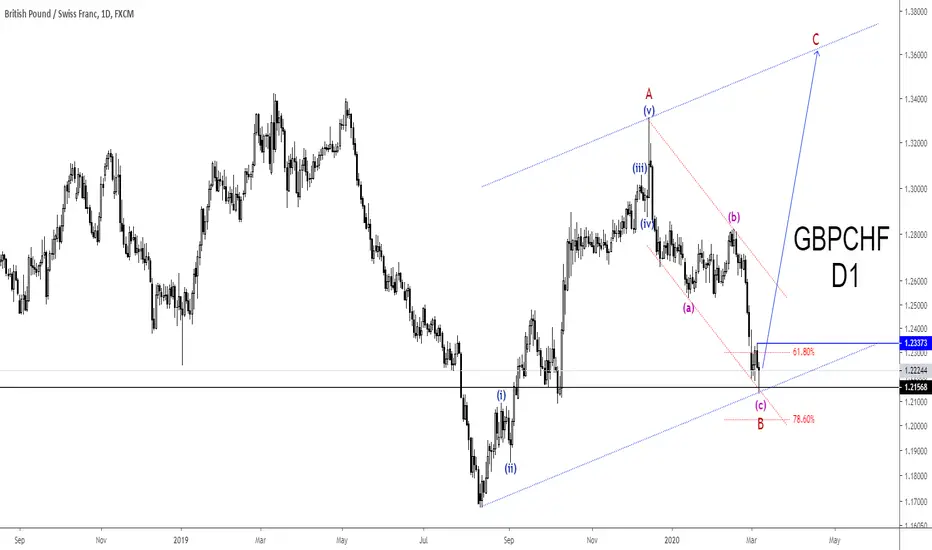
GBPCHF Set To Resumes Long-term AdvanceGBPCHF has just completed a 5-3 "impulse-correction" wave cycle.
According to the Elliot Wave principle, once a 5-3 wave cycle is completed the primary trend resumes.
In GBPCHF's case, the primary trend is bullish and target above wave A high is plausible.
The breach of the blue line will confirm the correction has bottomed.
What's your thought on GBPCHF?
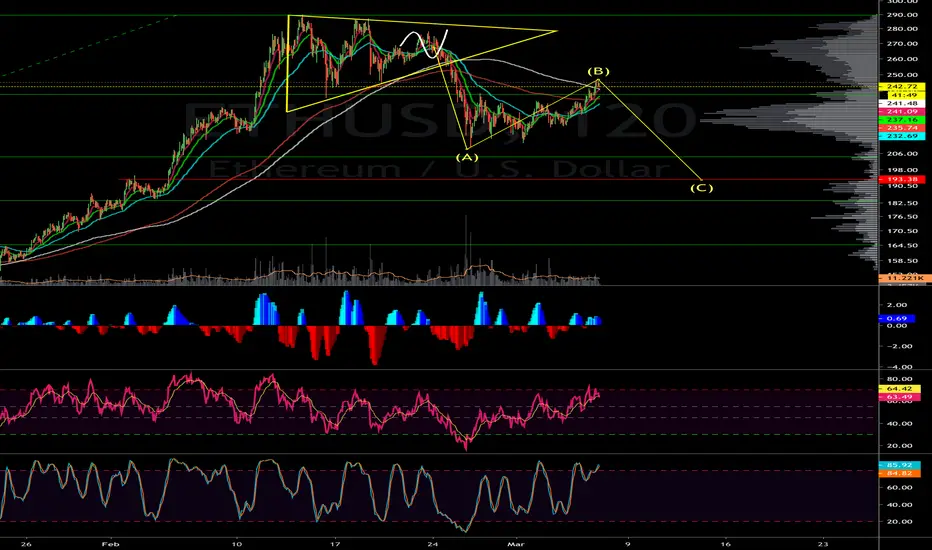
A B C CorrectivePossible end of wave B with momentum waining and looking more like a dead cat bounce with topping action IMO
NASDAQ 100 FUTURES 30 min CHART Projections for next 1-3 days!So far we have been bang on in forecasts of what is happening in NASDAQ 100 (cash and Futures) ( OANDA:NAS100USD TVC:NDX )and which should be the same for QQQ NASDAQ:QQQ
I predicted the rise today the night before.
Please refer to the last 2 posts (links below) to orient yourself where I believe we are on the longer-term charts.
Bottom line we are about to start a powerfully impulsive wave iii of 3 of b of B (a mouthful I know but stay with me and I will explain lol).
Overnight and into Thursday and Friday we should rise in a powerful short-covering rally wave to reach where c (red squared) = a (red squared) and which coincides with the top of the corrective channel in larger B (black squared) and which is also the 78.6% Fibonacci retracement. This would also close the gap in the NASDAQ 100 Cash Index from last Monday. All in all multiple confluences of powerful resistance and a very attractive and high probability target zone. Time analysis indicate the top should come at the earliest end of Thursday or more likely sometime Friday but in the worst-case scenario Monday if slower than I think.
Once we reach the target (or as we get close to it) we will reevaluate the nature of the waves and I will update if I think this count is still intact or - as looking possibly more likely that we go to new highs!
IF we punch through the upper corrective channel of black squared B in a decisive and impulsive way and go significantly above the 78.6% retracement of black squared A wave down THEN we have to re-evaluate this count and consider the very real possibility we are heading to new all-time highs which should take us between 9800 to 10,000 with 9900 being a likely new target.
What I can tell you is that TRIN, TICK and other upwards breadth measures were some of the strongest today I have seen in YEARS which means the force behind this upcoming rally will be very strong!
Shorts covering will fuel the rally quickly.
CTA Models of Nomura in the S&P shows a switch of systematic algorithmic trading models by big money institutions around 3087 in CASH S&P where they would switch to 100% LONGs from their current 94% SHORTS at the start of trading today. We closed S&P CASH today at 3130 which means tomorrow expect big money flow LONGs into US stocks which will benefit NASDAQ also. Negative gamma systems will switch to positive gamma which will push stocks powerfully upward.
The Fed's 50 basis point cut and the Joe Biden strong showing in Super Tuesday Primaries did their job.
Whether this will be enough to take us to new highs remains to be seen but my instinct right now says the rally should peter out around the targets I mentioned above but be on the watch for signs of new highs I mentioned above as I may not be able to update during market hours.
DO NOT go short at those targets without clear confirmation of an ending of red squared B wave as shown above.
On 65 and 135 min charts Mclellan Summation index has just crossed over at very oversold levels which means the rise to come has a long way to go.
Sentiment indicators (Put / Call, CNN Fear & Greed etc) all show there is still a lot of pessimism and we are still in extremes but turning up. Again - this means a lot of fuel to fuel the coming rally. Remember - stocks rise against a wall of worry.
We are also officially no longer in the 10% corrective territory which again will give confidence to smart and dumb money to push this rally higher.
One thing I will say is I ONLY post counts and recommendations and charts of instruments I myself have money in and I don't go lightly - when I am confident I go in strong when I see a high probability trade which I have seen here...first buying LONG PUT SPREADSs to ride the A (black squared down) then LONG CALL SPREADS of QQQ close to the bottom of black squared A when I counted 5 waves down complete (which I posted before here). I will be looking to exit those calls around above targets after which I will be looking for an opportunity to place a LONG BEAR Spread PUT position on the QQQ to ride the coming C wave down which will be wave ii of the ending diagonal on the Weekly charts I posted a few days ago. The C wave should end slightly below black squared A and also be in 5 waves possibly shaped as an ending diagonal C.
Trade sensibly and with proper risk management folks. We are in a high volatility environment and high risk but also high rewards and heaven for traders like us. Up or down we can make profits. Don't get emotionally locked into a philosophical position about what markets SHOULD do based on fundamentals. Trade based on what price patterns are showing markets WANT to do. The less emotionally invested you are and the less you care about Up or Down the better your trading will be.
Good luck everyone :)

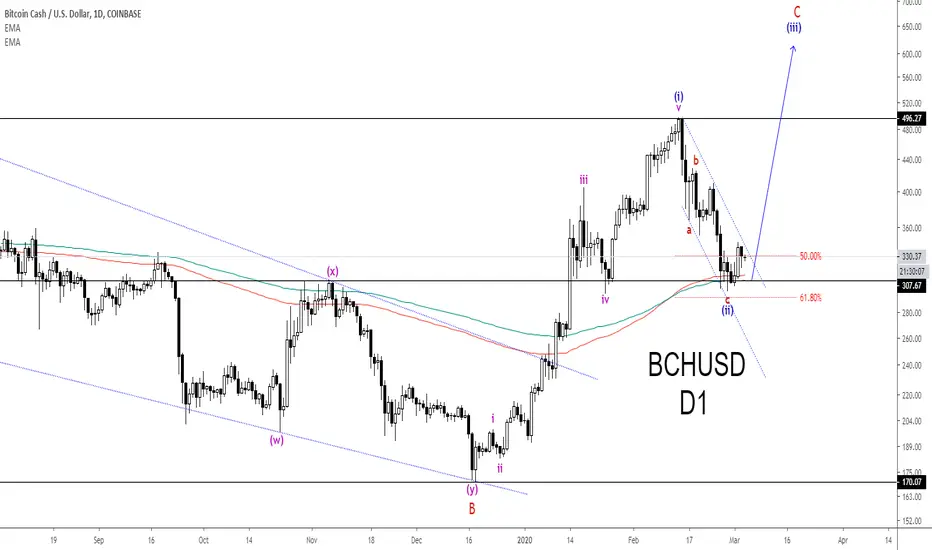
Bitcion Cash is Showing a Pattern That Could Lead to a Bull RunThe rally that started in December 2019 breakout descending wedge, resistance level and can be seen as a five-wave impulse pattern.
Once a five-wave impulse is completed, a three-wave pullback follows according to Elliot Wave theory.
In BCHUSD's case, the decline from February high to current low can be seen as a simple a-b-c zigzag/flag pattern. Wave c of the zigzag equals a, and the correction retraced 50-61.8% of the advance while retesting a broken S/R level that lined up with moving averages.
If this count is correct + other technical confluence, the price has the potential to move higher in wave (ii).
Target above February high is plausible, given that wave (iii) usually move 1.618x wave (i).
What's your thought on Bitcoin Cash?
GBPAUD Bears Set To Overtake After 4 Years of Correction.GBPAUD is bearish against the decline that started in August 2015. The decline can be seen as a five-wave Elliot Wave impulse structure, labeled 1-2-3-4-5.
According to Elliot Wave theory, a three-wave correction follows every impulse move.
In GBPAUD's case, since the completion of the decline in 2016, it has been a tug-of-war between the bulls and bears in the corrective phase. The correction is a complex one which is labeled as W-X-Y-X-Z double three corrections.
Once the correction is completed the primary trend resumes.
If this count is correct the correction is completed and we have a 5-3 wave cycle. We should see a massive decline in wave (C) to complete the Zigzag pattern, target below wave (A) low is plausible.
Further Confluence
Rejection from 61.8 Fib
Rejection of monthly 200 EMA not on the chart
Multiple rejections from the upper trend line
A perfect flag pattern
What's your thought on GBPAUD?

NASDAQ 100 CASH Index Weekly Path Forward till the US elections!The clearest count I see from the March 2009 lows on the TVC:NDX NASDAQ 100 CASH Index is that we are now forming an ending diagonal 5th final wave and the drop last week was just wave a of ii of this ending diagonal.
We are now in the midst of wave b of ii with another minor low drop coming once the current rally exhausts itself between the 61.8% and 78.6% Fibonacci retracement of the drop in wave a of ii. This should fill part of the gap from last Monday.
The rise in wave i was a 3 wave abc with b being a triangle. I am seeing some stretched counts showing the rise from Dec 18 is a "B" wave of an expanded flat but the "B" high was way higher than the beginning of wave "A" for this to be a credible count.
I will say one thing as clear as I can: while Trump is running for re-election THERE IS NO WAY IN HELL A MARKET CRASH WILL BE ALLOWED by the Fed, the Admin and Wall Street giants.
The stakes of a possible Bernie Sanders Presidency are too high.
President Trump is known to be unorthodox and not to respect any independence of the Fed and politics. He will do whatever it takes to get the Fed to keep the markets afloat till at least Nov 3 and the Fed looks like it is about to oblige judging from Powell's statement on Friday afternoon and the rumored G7 call between Mnuchin, Powell and other G7 nations - tomorrow.
When push comes to shove Trump is not going to be shy about even threatening to fire Powell if he sees the danger of losing the election. Any of you who think this is an impossibility have not been paying attention to all the lines in the sand Trump so easily erases and crosses.
More importantly, for such a powerful, bubble-like and almost parabolic bull run in tech stocks since the March 2009 Financial Crisis lows, the ending is not going to come without seeing at least multiple divergences on the MACD on the long-term daily and Weekly charts. Right now MACD has been pushing higher with each high in the NASDAQ which is confirming the trend is very much intact and animal spirits still very powerful in this Bull run.
I have shown how MACD should look in the coming months for us to see an ending coming later this year.
Do not start daydreaming of a crash coming till a proper topping process is in place and in Indices with long and powerful bull run trends like the NASDAQ 100, the top will be A PROCESS that will take months and months with MACD diverging along the way. This is what happened in the 2000 Dotcom crash and in the Great Depression. No crash is going to happen of meaningful long-term significance while MACD keeps punching higher and higher. Just plot the NASDAQ on a log chart from 2009 lows and you will see the latest drop last week was peanuts and minor in the long-term perspective. On linear charts, it looks scarier than it is. This is merely a correction in the midst of a final ending diagonal wave.
The coming Fed intervention will result in a short-covering rally (rumors and hopes of which have been the reason for the rise since Friday) which will fall short of the recent all-time high and wave c of ii of the ending diagonal will begin in earnest. Wave c should be a devastating drop that will freak out everyone. But it too shall stop and wave iii of the ending diagonal will then begin in earnest to new all-time highs - as pictured above.
The sentiment at last Friday's low was some of the worst pessimistic in decades using many metrics including CNN Fear/ Greed index, Mclellan Oscillator, and many others. The bounce I predicted to start last Friday (see the last post) happened right on time and was very predictable. When everyone is already bearish and panicking to the extreme, there is only one way to go and that is UP.
