TLRY - Don't short now. Long the breakout for a bounce!TLRY saw a massive dump after completion of wave 3.
TLRY is completing A leg of the ABC correction. Watch for a breakout for long opportunity on the bounce.
Elliotwavecount

ETH - short the breakoutETH is also forming corrective 3 wave structure.
Its basically moving sideways we made just slight higher high but overall picture is still the same.


CGC - Short for the big incoming correction.CGC has completed 5 waves up on the weekly chart. Get ready for a big long ABC correction down to around $22-$25.

APPL - short the breakdown to 214-216$Watch and wait for breakout for short opportunity to around 214-216$ to complete the corrective structure.

ETH - Major Dump before the big PumpETH very similar to BTC has completed a corrective pattern - expanded flat.
It broke the low and the broke the high of wave A making this an expanded flat.
Since it formed a corrective pattern instead of making a new impulse, should expect another wave down before any kind of reversal in Ethereum and rest of the crypto market altcoins.

ETC - Short the breakdown to $8ETC formed a running flat and broke down presenting with a short opportunity down to $8.
BTC and ETH looking weak atm too. Very likely to see new lows on ETC as well.

TWTR - Long the breakout for bounce!TWTR completed the A wave of ABC correction for wave 4.
Long the break out to target around 0.5 fib level.

ICX - Good buy between $0.2- 0.3$ ICX has been in a pretty strong downtrend. It made a corrective 3 wave down up instead of 5 wave impulse up that would suggest that it has another leg down before short term trend reversal.
ETH is also weak and will make another leg down. ( very good indicator of health of alt markets )
Planning to buy between 0.2-0.3$ for best to risk to reward setup on ICX.

EOS - complete cycle count EOS has completed a 5 wave impulsive cycle and we are big weekly corrective trend from the genesis since it got added on Bitfinex.
EOS is about to complete the first leg in its corrective cycle to make the W leg of the WXY double zig zag at around $3.
Following which it will bounce up to make the X wave before making the final Y wave down which will take us to bottom.

BTCUSD Bull Run? Elliot Wave & Schiff Pitchfork 2014 & 2018Intro: Light at the end of the accumulation tunnel. Why a BULL Run is possible when comparing 2014 & 2018 Elliot Wave ABC Corrections and Schiff Pitchforks:
1) W correction is about a 70% price drop in both 2014 & 2018.
2) Both Y corrections extend to the 0.786 Fib Level.
3) A correction retraces to mean in the Pitchfork.
4) B correction extends to about the 1.5 Pitchfork line.
5) C correction retests the 0.5 Pitchfork line.
6) Current correction has touched the WARNING line (2.0 Pitchfork extension in a red dash line) and found support back in the 1.5 Pitchfork line.
Disclaimer: This is not advice but any trade entries at this point carry low risk and high reward if 2014 correction were to repeat itself.
Support: Comment & like if you agree or disagree. This is a learning community and feedback is always welcomed for my own learning curve.

BTCUSD: Elliot Wave 2014 vs 2018, The Case for the Bulls!!!Intro: By now you should be sick of the 2014 vs 2018 BTC comparisons BUT there are uncanny parallels between these two corrections regarding their ABC corrections and the Fibonacci Extensions. Here's what I'm seeing:
1) Three Lower Lows in 2014 and 2018 create our A correction (Zig-Zag Pattern).
2) The A correction DROPS about 70% in both 2014 and 2018.
3) Both C waves have a 0.786 Fibonacci extension.
4) A symmetrical triangle formation develops after the ABC correction to the downside.
5) An ABC correction forms to the upside.
6) The C Correction to the upside COULD reach the 1.618 in 2018 just like it did in 2014.
What Invalidates this analysis? A drop below the 2018 low ($5774.72 on Bitstamp).
Disclaimer: This is not advice. Entering a trade at this moment presents a massive reward and a low risk if the C wave extends to 1.618 Fib number and we hold the 2018 low. Even better, reaching the 1.618 fib extension means higher highs and a confirmation of a reversal.
Please comment and like: This is a learning community and your comments or questions make a difference.
BITSTAMP:BTCUSD
Take a look at my Gann Fan Analysis:


NZD/CHF DailyIt is at the first fork. Small ending diagonal 1hr. But there are 2 ways I can label this 5 wave, this is one where we would get an ending diagonal, or shortening of impulses as a wave 5 so keep that in mind. There are a lot of levels for price to hit so I would recommend being careful and patient for an attempt at a large up move, we are in a strong downtrend and impulse waves are fractal, but I expect at least a correction to be coming from this strong fib area. If it gives us a larger ending pattern, which would take some time (see NZD/USD buy I posted from the low) that would be the type of setup I would look for exact entry and 50-62% retrace of 5 wave down. It can come up some from right here but, be careful. See Weekly chart I posted

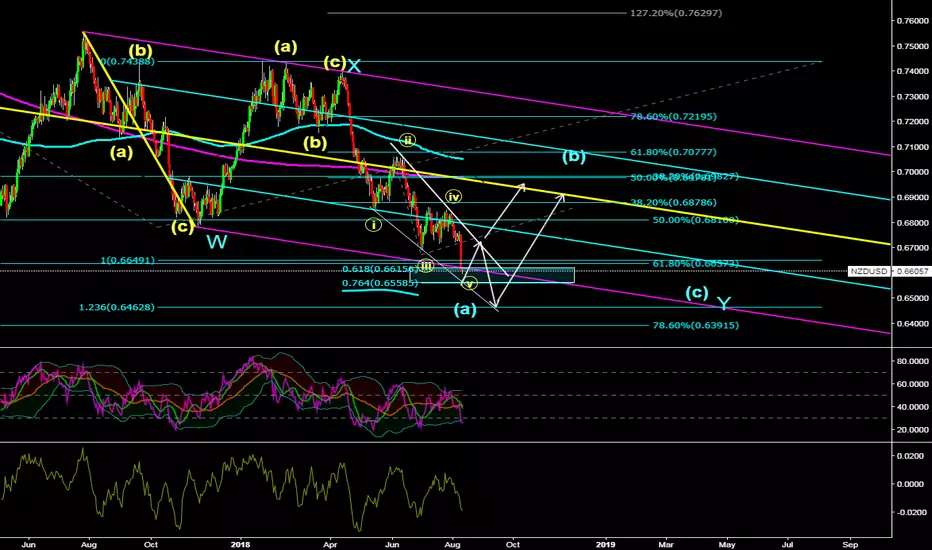
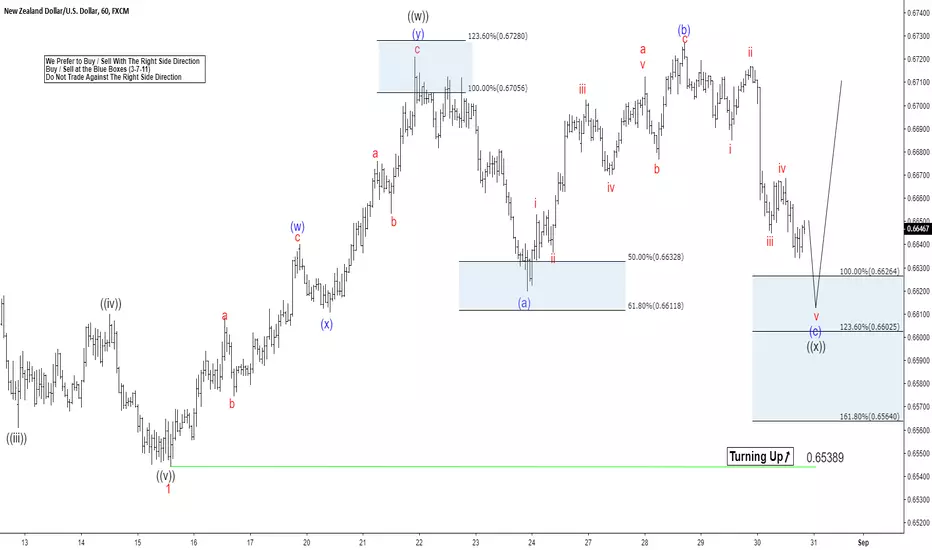
NZDUSD Elliott Wave Analysis: Double Correction Taking PlaceHello Traders,
NZDUSD short-term elliott wave analysis suggests that the decline to 0.6543 low ended red wave 1. The internals of that decline unfolded as impulse structure with lesser degree Minute wave ((i)), ((iii)) & ((v)) unfolded in 5 waves structure. Above from there, red wave 2 bounce is taking place as double correction higher with lesser degree cycles showing sub-division of 3 wave structure its each leg higher.
Up from 0.6543 low, the rally to 0.6719 high ended black wave ((w)) of 2. The internals of that rally also unfolded as double three structure where blue degree wave (w) ended at 0.6639. blue wave (x) pullback ended at 0.6609 & blue (y) of ((w)) ended at 0.6719 high. From there, the pullback in black wave ((x)) remains in progress as a Elliott Wave Flat structure to the areas of around 0.6626-0.6603 (Blue box area). Near-term, as far as dips remain above 0.65389, we expect pair to resume the next leg higher in black wave ((y)) of 2. We don’t like buying the pair and like to stay on the sidelines for now.
EUR/GBP Elliot Wave Analysis Sell Set Up!Look for a impulse wave to the downside to break out of the corrective channel then a small correction for a sell set up!
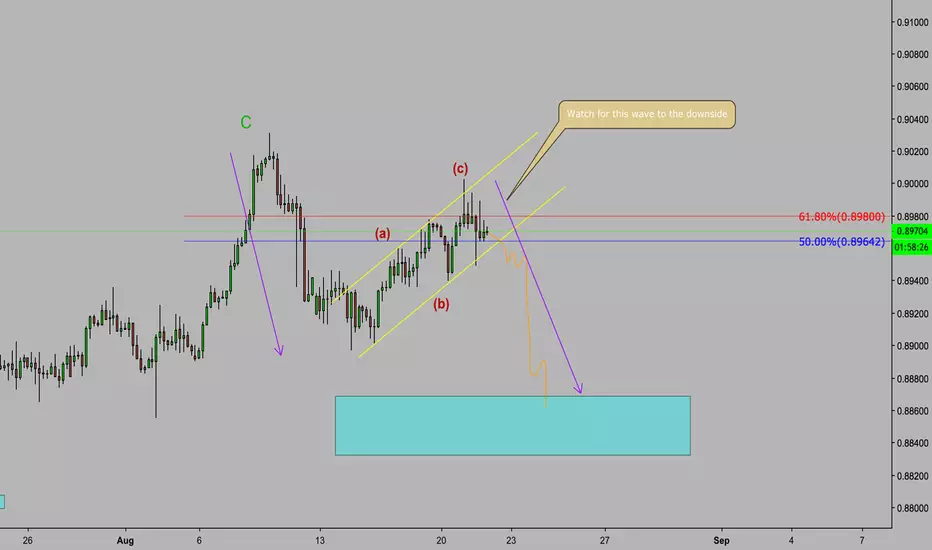
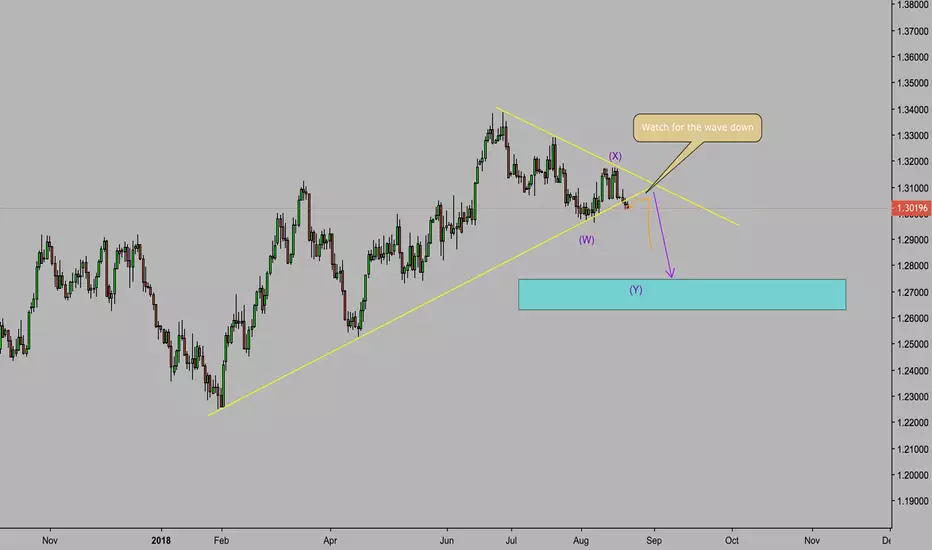
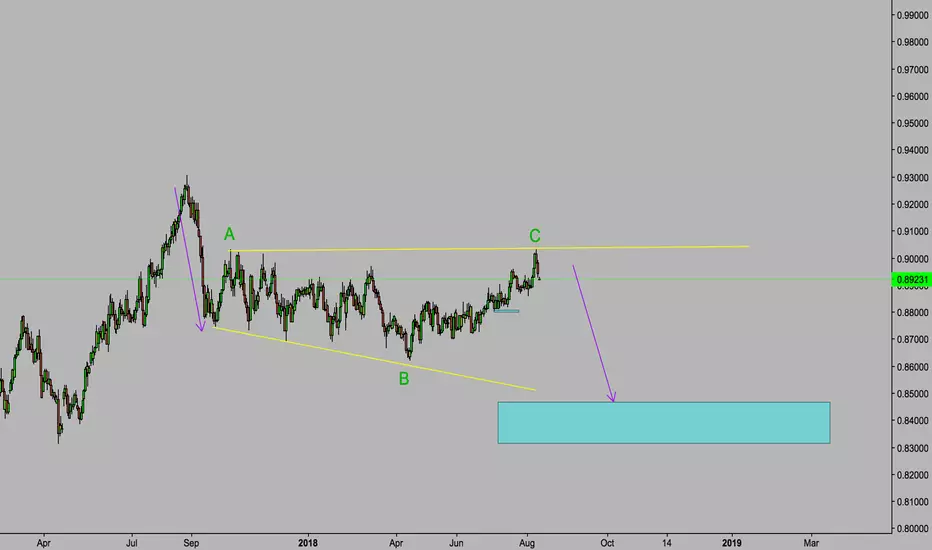
EUR/AUD Elliot Wave Sell Set Up Corrective StructureLook for the corrective structure to end soon and price to break out impulsively to the downside targets

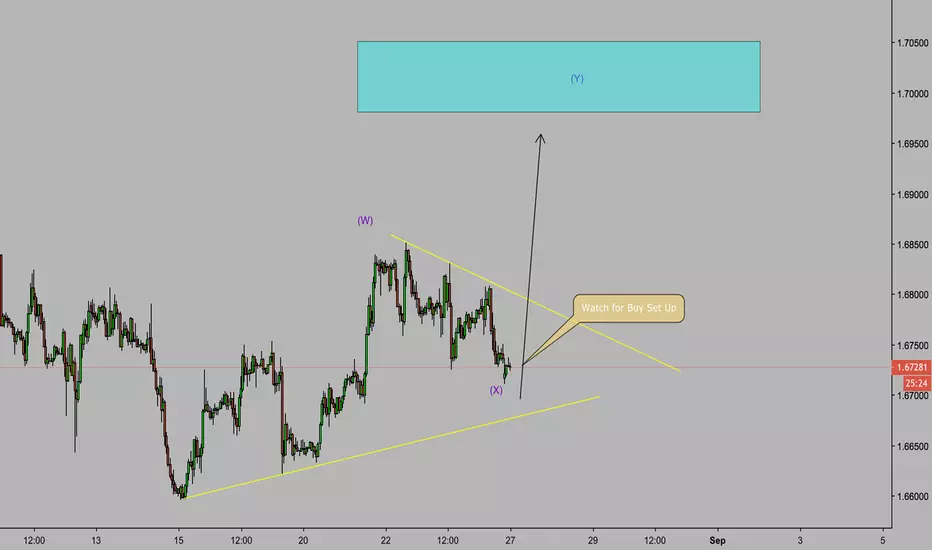
USD/JPY Elliot Wave Analysis Watch for price to breakout of the corrective channel for a buy set up to finish the Flat correction then the sell set up after the structure is complete
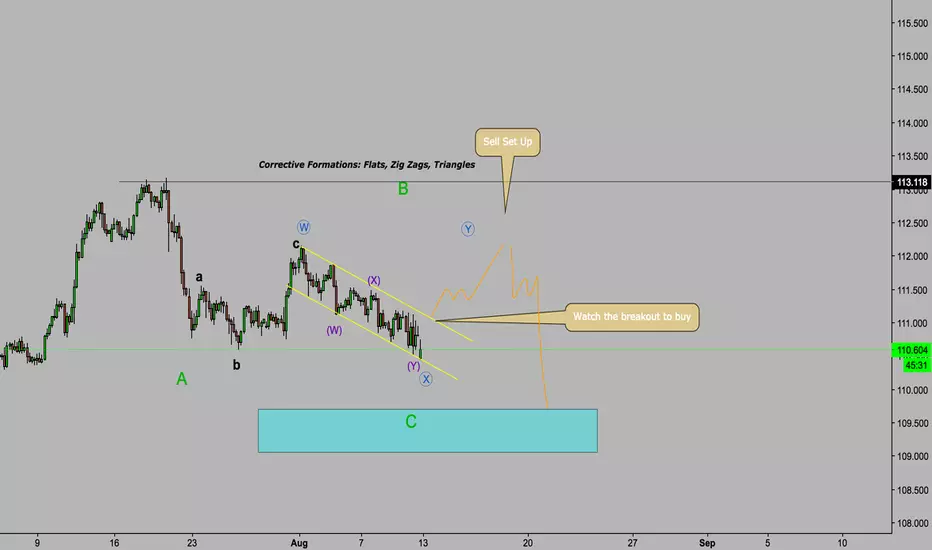
Elliot Wave Analysis USD/JPY Corrective Wave Structure ExplainedWatch as I explain some basic Elliot Wave Concepts of Corrective Formations and anticipating the next waves. I Also breaks down the idea of an IF-Then-Thought-Process using Elliot Wave and reacting to price.

NZD/USDI have company arriving and don't have time to post or explain everything. NZD/USD at a pitchfork. So is Nzd/chf. Nzd/jpy is hitting the 200MA on monthly along with the 50% pitchfork fib drawn high to low on daily. Nzd/chf is now in a 5 wave down with a stunted 3rd wave, so I am still looking for a 3 wave pullback before final drop. NU might not be the best of the 3 to trade. NJ is very interesting. I'm not saying to just buy NZD, but watch out... Watch it... By the way, I am expecting long term bearishness on Nzd/Usd in a weekly wxyxz pattern that is moving down on wave "Z". However, it will have to pullback and confirm the down move, but in the current pattern it can still do one more up even breaking the high. Looking at the price action through the NZD pairs, I foresee decent buy entries upcoming. At least ones to get stops in profit if managed properly. But we are hitting multiple pitchfork fibs across the pairs right now...