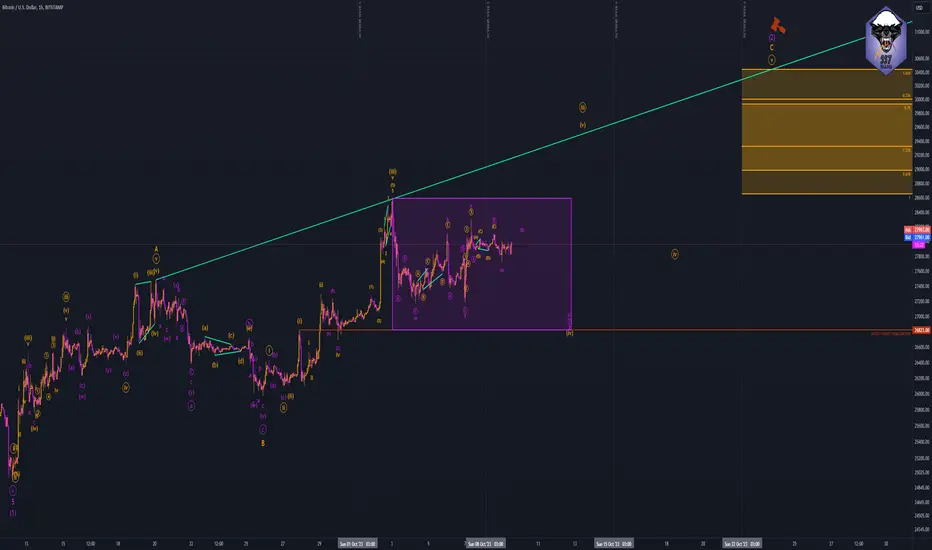
BTCUSDT reached supply BTCUSDT seems to be reached supply zone. Price action drew a logical dynamical resistence line - top formation - in a confluent Elliot Wave count. USDT 40400 is a potential target for short swing trade in an possible impulse bearish.
Elliotwavecount

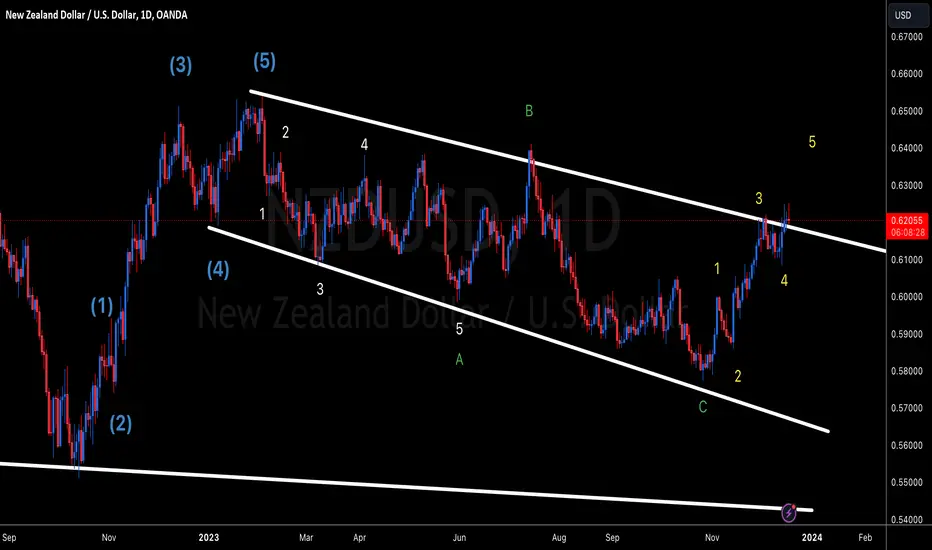
NZDUSD Long For Wave 5NZDUSD Long To Complete Wave 5. As we see in the chart the other waves matched up perfectly.
Decoding USDINR with Elliott Waves: A Comprehensive AnalysisDecoding USDINR with Elliott Waves: A Comprehensive Analysis
Weekly Perspective:
Daily Perspective:
4 Hourly Perspective:
Hourly Perspective:
Current Stage: Inside iv of (c) of 2 of ((1)) of wave V of wave (III).
Current Bias: Presently showing a bearish inclination on the hourly chart.
Future Outlook: Post the completion of wave (c) of 2 , a potential swing towards the north is anticipated.
Invalidation Level: Post starting journey towards north Strictly set at the recent swing low of (c) of 2, serving as a critical point for the bearish bias. If breached, it might prompt a re-evaluation of wave counts on the hourly time frame.
Elliott Wave Concept:
Elliott Wave Theory proposes that market prices unfold in specific patterns, providing insights into potential future price movements.
It identifies waves of various degrees, each with its own subdivisions, illustrating the cyclical nature of market psychology.
Corrections, labeled as 2 or (b), are temporary pauses in the prevailing trend before the larger trend resumes.
Validation of Elliott Wave counts often comes from adhering to strict rules and guidelines, including confirmation of trend reversals and respecting key invalidation levels.
Conclusion:
The USDINR pair, as per Elliott Wave analysis, is currently navigating a complex pattern with bearish signals on the hourly chart. However, the prospect of an upcoming swing towards the north is plausible post the completion of wave 2. Traders are advised to closely monitor the invalidation level as it holds the key to potential shifts in the Elliott Wave counts.
I am not Sebi registered analyst. My studies are for educational purpose only.
Please Consult your financial advisor before trading or investing. I am not responsible for any kinds of your profits and your losses.
Most investors treat trading as a hobby because they have a full-time job doing something else.
However, If you treat trading like a business, it will pay you like a business.
If you treat like a hobby, hobbies don't pay, they cost you...!
Hope this post is helpful to community
Thanks
RK💕
Disclaimer and Risk Warning.
The analysis and discussion provided on in.tradingview.com is intended for educational purposes only and should not be relied upon for trading decisions. RK_Charts is not an investment adviser and the information provided here should not be taken as professional investment advice. Before buying or selling any investments, securities, or precious metals, it is recommended that you conduct your own due diligence. RK_Charts does not share in your profits and will not take responsibility for any losses you may incur. So Please Consult your financial advisor before trading or investing.

Please, Trade with Caution...I think that this concludes Intermediate Wave 2.
I could be wrong, I hope I am, because if I am right, the carnage will be terrible. Please mitigate your risk, that is the only purpose as to why I have started posting.
Please, please, please be careful.
Trade safely.
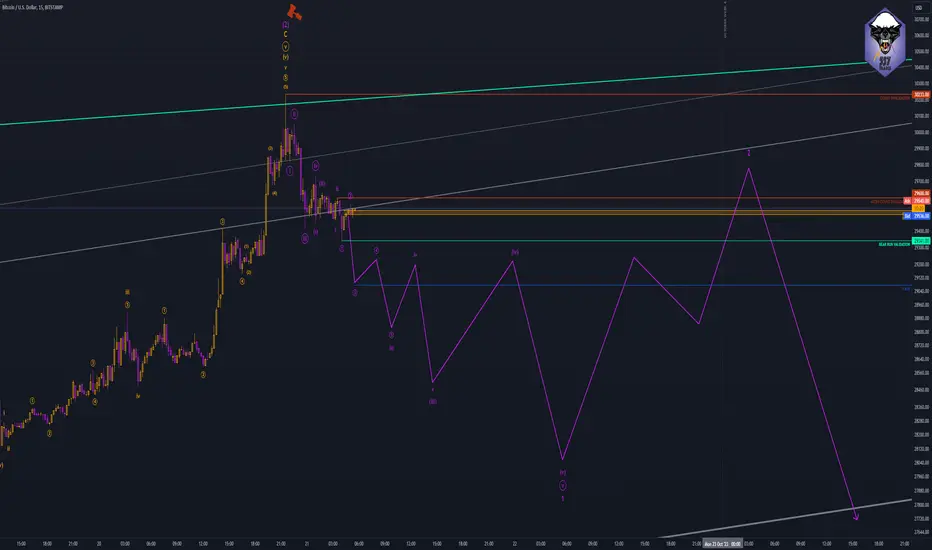
Regardless of your bias, trade cautiously...Honestly, I do not think the correction is over, I think we may see near Covid prices again... The lack of a "covid wick" on the monthly is the biggest giveaway to me.
I must admit, my macro has errors and therefore, can only trade my micro, however, at the end of this set we could really dump. I know Bulls are calling for buys at 28k, but honestly, with the uncertainty I can see in the market (Triangles within corrections), who knows how deep that could go, and it will only be a Wave 1 going down... On retracement, everyone that missed the sell will offload for profits starting Wave 3...
This is an opinion, based on my TA. I may be wrong. I do not care if I am, I will protect my wealth regardless, you do you.
I am currently long, so short term BTC goes up.
However, on the daily, two of four criteria to indicate the top have been met.
Regardless of your bias, protect your positions at the end of this set.
I can honestly say I have no idea what will actually happen.
Safe Trading.

BTC Thesis—October 2023First Published: October 5, 2023
Disclaimer:
Please be aware that the information provided in this post is for educational and informational purposes only. It should not be considered financial advice. Trading and investing in financial markets carries inherit risk, always conduct your own research and, if necessary, consult a qualified financial adviser prior to making any investment decisions.
Thesis Statement:
The primary objective of our monthly BTC Thesis is to deliver comprehensive Elliott Wave Theory (EWT) analysis, free from external influences or biases, to determine overall market sentiment. Through meticulous examination of the Monthly, Weekly, and Daily time frames using EWT, our analysis aims to identify key levels for potential Monthly candle highs and lows. This post caters primarily to traders seeking unbiased, EWT based evidence to support their own analysis, empowering them to make well informed trading decisions.
Introduction and Overview:
Welcome to our October 2023 BTC Thesis, where we provide a meticulous EWT analysis, free from external influences, to decode the fractal nature of EWT and pinpoint significant trading opportunities. Our primary focus is on identifying the potential Monthly Candle high and/or low.
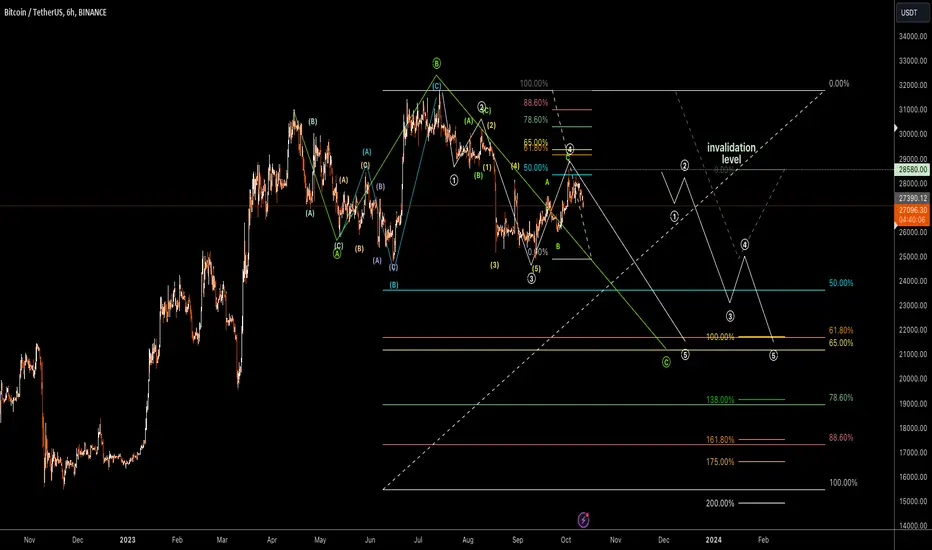
In this analysis, we emphasize a bearish sentiment, as BTC currently undergoes a Wave 4 correction—notably an Expanded Flat. Our EWT count unveils a rare trading opportunity, the likelihood that the Monthly Candle high aligns with the bottom of Intermediate Wave 2 within the final Wave of this correction. Throughout, we stress the importance of a precise 5 Wave count down that will complete Wave C of the Cycle and the overall correction. The tone is clear: we anticipate further downside potential, urging caution and patience as we wait for the Wave formation to fully form.
Macro Analysis:
Our Macro Analysis begins on the Monthly time frame, delving into the rich history of price action data available on the BLX chart. EWT, known for its fractal nature, reveals a continuous wave formation, with Wave 1 of the largest degree always evolving. Currently, price action is navigating Wave 4 of the Super Cycle.
Notably, Wave 3 of the Super Cycle commenced in November 2011 and featured an extended Wave 3, and, Wave 5, terminating in an Ending Diagonal, implying the potential complexity of this Wave 4 correction.
We confidently identify the ongoing correction as an Expanded Flat, validated by Wave B surpassing the completion of Wave 5 and Wave C surpassing the completion of Wave A.
Price action for Wave 4 typically will retrace between between the Yellow 0.236 and 0.382 FIB levels indicated on the chart.
Wave Form Analysis:
Transitioning from monthly analysis, we maintain our focus on the ongoing Wave 4 correction. As we inspect the Weekly time frame, the fundamental 3-3-5 Wave form of an Expanded Flat becomes evident, sparking discussions about what we have marked as the completion of Wave 3 within this correction.
While there is a case to be made for a completed 5 Wave move down from the top of Wave B to the November, 2022 bottom, further analysis on the Daily time frame will be required to establish and validate a micro count.
Confluence between price action on the broader Monthly chart, where the absence of observable complete 5 wave moves suggests that the overall structure remains incomplete.
It is vital to underscore that an immediate reversal signal, similar the notable 'COVID dip,' remains absent, further strengthening the notion that the correction is still in progress. Additionally, current Wave 5 targets indicated by the Yellow -0.236 FIB level displayed on the Weekly chart have not been met.
Micro Analysis:
Transitioning from the Wave Form analysis, our primary focus is to establish a correct and valid count from the top of Wave B on the Daily time frame. This count is vital in determining whether the 5-wave move down, forming Wave C, has reached completion.
Starting from the top of Wave B in November 2022, we can clearly identify a 5-wave move leading to the January 2022 bottom, completing Primary Wave 1. Primary Wave 2, formed a Triangle correction completing on the March 2022 top. Primary Wave 3 unfolded with an extended Intermediate Wave 3, completing on the June 2022 bottom. Intermediate Wave 4 formed a Complex EWT Combination Correction that concluded on the November 2022 top, which marked the start of Intermediate Wave 5. Intermediate Wave 5 completed on the November 2022 bottom completing Primary Wave 3, and establishing a count invalidation number at the top of Primary Wave 1.
Despite Primary Wave 4 retracing deeper than average, it remained within the boundaries of valid price action, the count invalidation number, and adhered to the principles of the Law of Alternation, forming a simple Zig Zag correction, juxtaposed to the Triangle correction of Primary Wave 2.
Price action has indicated Primary Wave 5 has commenced, as such, a Micro Count Invalidation number can be established on the July 2023 top.
Presently, a validated five-wave move has been counted, descending from the July 2023 top, marking the completion of Intermediate Wave 1 within Primary Wave 5.
Our assumption is that price action currently resides within Intermediate Wave 2, of Primary Wave 5, of Cycle Wave C, of Super Cycle Wave 4.
Outlook:
Upon the completion of Wave 2, typically at the Blue 0.618 FIB Level indicated on the Daily time frame, an immediate retracement is expected as price action transitions into Wave 3. It is anticipated that this reversal will contribute to the formation of the wick on the top of the monthly candle.
While standard levels of expected price action are presented on the Daily time frame, it's crucial to acknowledge that Intermediate Wave 5 targets do not align with Primary Wave 5 targets, or, Super Cycle Wave 4 targets, suggesting the potential for an extended Intermediate Wave 3, and, Primary Wave 5.
Conclusion:
Our monthly BTC Thesis has provided comprehensive EWT analysis, providing traders and enthusiasts with an unbiased, EWT based understanding of BTC price action. This analysis, spanning the Monthly, Weekly, and Daily time frames, has been dedicated to identifying significant levels for the potential Monthly candle high, catering primarily to traders seeking EWT based evidence to support their trading decisions.

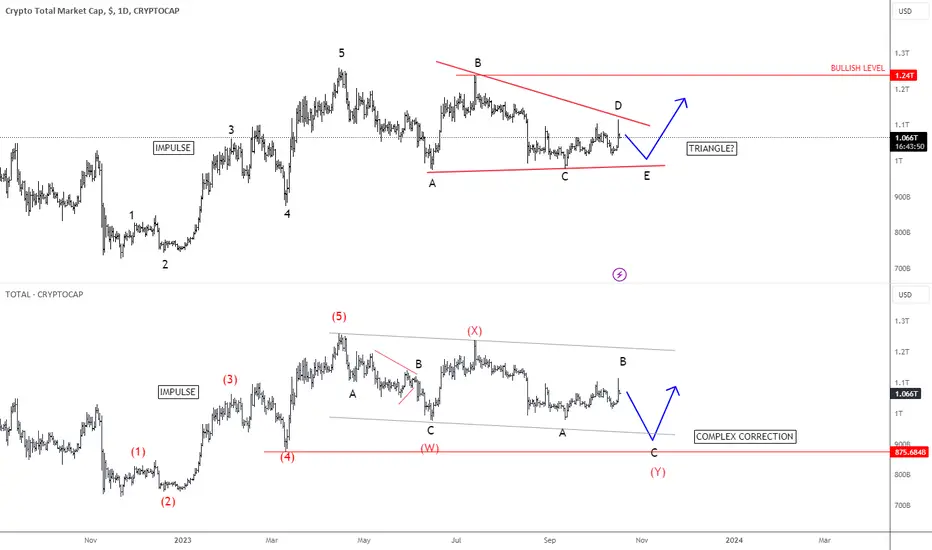
Crypto Market Can Be Finishing A Corrective ConsolidationCrypto market made nice and clean impulsive rally at the beginning of 2023, which indicates for a bigger recovery after a correction. Well, Crypto market is now in a corrective consolidation since April, which we see it either as a bullish triangle pattern or maybe even slightly deeper and more complex W-X-Y correction.
After yesterday's volatility Crypto market firstly jumped higher on the news that SEC approved iShares spot ETF, but then immediately reversed down, when BlackRock confirmed that this is false and that their application is still under review. So, it looks like a short-term spike up only, which means that we should be aware of a new slow down within wave E of a triangle or maybe even for wave »c« of Y of deeper complex W-X-Y corrective decline.
Once a correction fully unfolds, we will expect a continuation higher in the Crypto market, ideally at the end of 2023 or beginning of 2024.
All the best!
BTCUSDT final leg down short?Is it time for BTC to go down? Is this the start of a possible 5th wave?
This is only one possible TA for short, although there are many arguments and the possibility that BTC is still going up. But currently the risk reward is so good that this trade looks very attractive. The analysis was made with Fibonacci, Elliot waves and harmonic patterns. Currently BTC reached TP1 for Anti Bat pattern. More on this, that is, in more detail the next day or two, when I have a little more time (and until then, if the bulls want to, I can disable this idea)
BTC Week 1 Analysis—October 2023First Published: October 8, 2023
Disclaimer:
Please be aware that the information provided in this article is for educational and informational purposes only. It should not be considered financial advice. Trading and investing in financial markets carries inherit risk, always conduct your own research and, if necessary, consult a qualified financial adviser prior to making any investment decisions.
Introduction:
Welcome to our BTC Weekly Analysis for October, Week 1, 2023. This analysis offers continued insights into BTC price action, focusing on Elliott Wave Theory (EWT) analysis conducted on the BITSTAMP Daily, Four Hourly, and Hourly time frames. Our objective is to provide traders with unbiased, EWT-based evidence to support their decision making process.
Primary Assumption:
Our Weekly analysis builds upon the data presented in our October BTC Monthly Thesis, and the EWT count remains valid to the completion of Primary Wave 4. As a result, a count invalidation number has been established at what we believe to be the beginning of Primary Wave 5.
Macro Analysis:
Our Weekly Analysis begins with a focus on the Daily time frame, aiming to identify the wave in which current price action resides. Commencing at the start of Primary Wave 5, we observe a valid five-wave move down to the September 2023 low, effectively completing Intermediate Wave 1. Subsequently, we witness price action retracing into Intermediate Wave 2.
With confirmation that price action is currently within Intermediate Wave 2, we identify key levels at which price action is expected to retrace. Typically, Wave 2 retraces within the range defined by the Yellow 0.618 and 0.75 FIB levels, as displayed on the Daily time frame.
Wave Form Analysis:
Transitioning from the Daily time frame, our analysis shifts to the Four Hourly as we embark on our Wave Form Analysis. Our primary objective is to identify the corrective wave form that Intermediate Wave 2 is currently developing.
Wave 2 is a corrective wave, typically taking the form of a simple Zig Zag correction. However, it's worth noting that Wave 2 can occasionally manifest in alternate forms, such as a Triangle, as was the case in Primary Wave 2 of Cycle Wave C of this correction. To accurately identify the wave form that price action is adopting, we must consider all potential corrective wave structures.
If price action forms a Zig Zag correction, we will observe a 5-3-5 wave pattern.
If price action forms a Flat correction, we will observe a 3-3-5 wave pattern.
If price action forms a Triangle correction, we will observe a 3-3-3-3-3 wave pattern.
In the event of a Combination correction, we may encounter two or more variations of these corrective wave forms.
After the completion of Intermediate Wave 1, price action has displayed two highs and one low, indicating that Intermediate Wave 2 is forming a three-wave pattern. Consequently, the possibility of Intermediate Wave 2 adopting a Triangle formation has been ruled out. Additionally, the Flat corrective pattern can be eliminated as Wave B did not conclude at, or beyond, the point of Intermediate Wave 1 completion.
Hence, the prevailing price action suggests that Intermediate Wave 2 is evolving as a Zig Zag correction. It's important to note that while the current price action strongly indicates a Zig Zag wave form for Intermediate Wave 2, the remote possibility of it forming an EWT Combination correction still lingers.
Assuming Wave A and B are now complete, the Four Hourly time frame reveals potential targets for Wave C completion at the Yellow 1 and 1.236 FIB levels. In cases where Wave C is extended, the target for completion shifts to the Yellow 1.618 FIB level.
Micro Analysis:
Once we have identified the wave form of Intermediate Wave 2, our analysis shifts to the Hourly time frame. Our goal is to validate the wave count and pinpoint crucial levels that signify the completion of Intermediate Wave 2, and the commencement of Intermediate Wave 3.
To confirm whether this correction takes the form of a Zig Zag, we need the three-wave correction to adhere to a 5-3-5 pattern.
Our analysis commences at the September 12 low, where Minor Wave A initiates with an impulse, establishing Minute Wave 1. Price action retraces into Minute Wave 2 prior to Minute Wave 3 which unfolded with an extended Wave 3 and 5, culminating on the September 15 high. Minute Wave 4 takes the form of a Complex EWT Combination correction, concluding on September 18. Minute Wave 5 then materializes as an Ending Diagonal, completing a valid five-wave move within Minor Wave A.
With the validation of a five-wave sequence in Minor Wave A, our focus shifts towards confirming a three-wave sequence for Minor Wave B. This sequence commences as price action forms a double Zig Zag pattern, finalizing Minute Wave A at the September 22 low. Minute Wave B unfolds as a Triangle, completing on the September 25 high. Subsequently, Minute Wave C also takes the form of a double Zig Zag, constituting a valid three-wave sequence within Major Wave B, ending on the September 25 low.
Major Wave C commenced with an impulse into Minute Wave 1, followed by price action retracing into Minute Wave 2, which completed on the September 27 low. Price action then surged into Minuette Wave 1 on the September 27 high, retracing into Minuette Wave 2, prior to Minuette Wave 3 unfolding with an extension, culminating on the October 3 high.
Presently, price action has retraced and currently resides within Minuette Wave 4, of Minute Wave 3, of Major Wave C, of Intermediate Wave 2, of Primary Wave 5, of Cycle Wave C, of Wave 4, of the Super Cycle.
Outlook:
Until price action surpasses the completion of Minuette Wave 3, our assumption is that it remains within Minuette Wave 4 of Major Wave C. We anticipate this correction taking the form of some complex EWT combination correction, given that Minuette Wave 3 concluded with an extended Wave 3 and 5, culminating in an Expanding Diagonal.
While we refrain from attempting to predict the specific nature of the correction currently unfolding within Minuette Wave 4, we can make reasonable predictions about its behavior. Price action is not expected to venture into the price territory of Minuette Wave 1. As such, we've established a Micro Count Invalidation at the completion of Minuette Wave 1. Major Wave C will remain incomplete until both Minuette Wave 5 and Minute Wave 5 have concluded. Consequently, we anticipate two additional local highs on the Daily time frame this month, with the second forming what will be the upper wick of the Monthly candle.
Should price action remain above our Micro Count Invalidation point, our expectation is for a climb to the Blue -0.236 FIB level, indicated on the Hourly time frame, which will signify the completion of Minute Wave 3. Subsequently, we anticipate a retracement into Minute Wave 4, followed by the final push to complete Minute Wave 5, Major Wave C, and Intermediate Wave 2 at the Yellow -0.236 FIB level as indicated on the Hourly chart. This event will mark a significant reversal as price action transitions from Intermediate Wave 2 into Intermediate Wave 3.
Conclusion:
Our BTC Weekly Analysis for October, Week 1, 2023, has offered valuable insights into the current state of BTC price action, and serves as a crucial bridge between our BTC Monthly Thesis, offering traders a more immediate perspective on the evolving Elliott Wave structure of BTC. As always, our aim is to empower traders with objective analysis, enabling them to make confident and well informed trading decisions in the dynamic cryptocurrency market.
Crude Oil: Ongoing Elliott Wave Corrective Drop Can Be DeeperCrude oil has been on the rise over the last view weeks, which is the main reason why inflation is still the main global problem, so we have seen some positive correlation between dollar and crude as speculators believe that rates will stay here higher for longer. Well, what’s interesting now is that after that after a lot of crude oil bull calls for 100 dollar and higher, the energy is turning south. Looking at the current intraday drop, we can see some sharp move down now, it looks like an ongoing intraday impulse with room for more weakness after Crude inventory data shows decline of 2.2 million barrels last week. From an Elliott wave perspective that’s going impulse for wave A, so more weakness can be seen after subwave iv rally, or even after wave B bounce. Resistance is at 86.75 and 88.30.
In fact, lower energy can also mean that inflation can slow down, and this can then at some point puts limited upside for the USD and yields.
Grega

AUD/JPY: Bullish Trend Pauses for a Pullback-- 30-Minute Chart
The AUD/JPY pair is currently trading in a narrow range on the 30-minute chart. The pair is facing resistance at the 94.20 level and support at the 94.00 level.
The RSI indicator is currently in overbought territory, suggesting that the pair may be due for a pullback. However, the MACD indicator is still generating bullish signals.
-- 4-Hour Chart
The AUD/JPY pair is currently trading in a bullish trend on the 4-hour chart. The pair is facing resistance at the 94.50 level and support at the 94.00 level.
The RSI indicator is currently in overbought territory, suggesting that the pair may be due for a pullback. However, the MACD indicator is still generating bullish signals.
-- Daily Chart
The AUD/JPY pair is currently trading in a bullish trend on the daily chart. The pair is facing resistance at the 95.00 level and support at the 94.00 level.
The RSI indicator is currently in overbought territory, suggesting that the pair may be due for a pullback. However, the MACD indicator is still generating bullish signals.
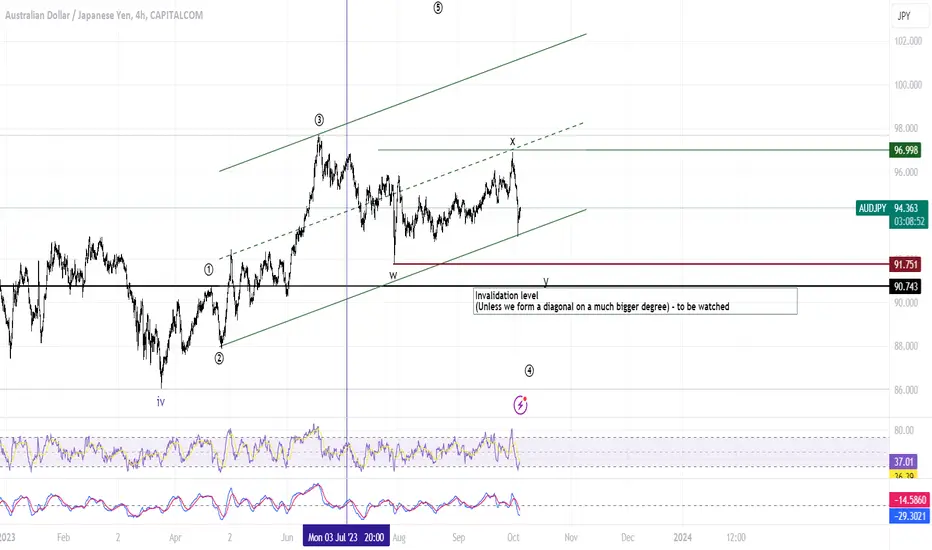
Elliott Wave Analysis
Based on Elliott Wave Theory, as marked on my chart, the AUD/JPY pair may be in the process of completing a five-wave upward Elliott wave pattern. If this is the case, the pair could experience a significant pullback in the near future.
AUD/JPY Fundamental and Technical Analysis for 4 October 2023 (30-min, 4-h, and Daily Charts)
Fundamental Analysis
The Australian dollar (AUD) is a commodity currency, meaning that its value is closely linked to the prices of commodities such as iron ore and coal. The Japanese yen (JPY) is a safe-haven currency, meaning that it tends to appreciate in value during times of market turmoil.
The AUD/JPY currency pair is often seen as a proxy for risk appetite. When investors are feeling optimistic about the global economy, they tend to buy the AUD/JPY pair. When investors are feeling cautious, they tend to sell the AUD/JPY pair.
Technical Analysis
30-Minute Chart
The AUD/JPY pair is currently trading in a narrow range on the 30-minute chart. The pair is facing resistance at the 94.20 level and support at the 94.00 level.
The RSI indicator is currently in overbought territory, suggesting that the pair may be due for a pullback. However, the MACD indicator is still generating bullish signals.
4-Hour Chart
The AUD/JPY pair is currently trading in a bullish trend on the 4-hour chart. The pair is facing resistance at the 94.50 level and support at the 94.00 level.
The RSI indicator is currently in overbought territory, suggesting that the pair may be due for a pullback. However, the MACD indicator is still generating bullish signals.
Daily Chart
The AUD/JPY pair is currently trading in a bullish trend on the daily chart. The pair is facing resistance at the 95.00 level and support at the 94.00 level.
The RSI indicator is currently in overbought territory, suggesting that the pair may be due for a pullback. However, the MACD indicator is still generating bullish signals.
Elliott Wave Analysis
Based on Elliott Wave Theory, the AUD/JPY pair may be in the process of completing a five-wave upward Elliott wave pattern. If this is the case, the pair could experience a significant pullback in the near future.
Conclusion
Overall, the AUD/JPY pair is in a bullish trend on all three timeframes. However, the RSI indicator is currently in overbought territory on all three timeframes, suggesting that the pair may be due for a pullback.
Traders should watch the key support and resistance levels mentioned above carefully. A break above the 94.50 level on the 4-hour chart would confirm the continuation of the bullish trend. A break below the 94.00 level on the 4-hour chart would suggest a pullback is underway.
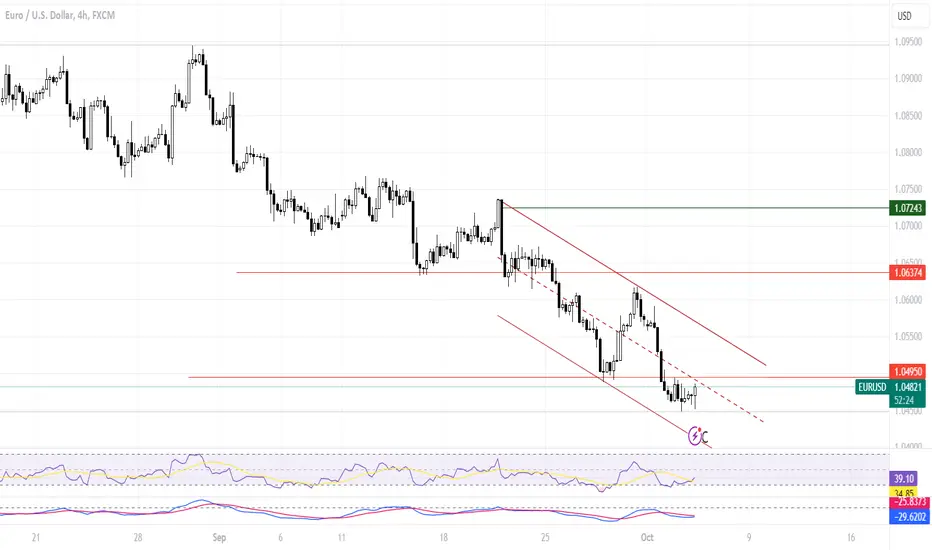
EUR/USD: Oversold, But Still BearishThe EUR/USD currency pair is currently in a downtrend on all three timeframes (30-min, 4-hour, and daily). On the 30-minute chart, the pair is trading below its 200-period moving average, which is a bearish signal. The pair is also trading below a descending trendline, which provides further resistance.
On the 4-hour chart, the EUR/USD currency pair is also trading below its 200-period moving average. The pair is also trading within a descending triangle pattern, which is a bearish pattern.
On the daily chart, the EUR/USD currency pair is trading below its 50-period moving average, which is a bearish signal. The pair is also trading within a descending channel pattern, which is another bearish pattern.
Overall, the technical analysis on all three timeframes is bearish for the EUR/USD currency pair.
Elliot Wave Analysis
Based on Elliot Wave Theory, the EUR/USD currency pair is likely in a corrective wave C of a larger degree wave down. This means that the pair is likely to continue lower in the near term.
RSI and MACD
The RSI indicator on all three timeframes (30-min, 4-hour, and daily) is in oversold territory. This means that the pair is technically oversold and may be due for a bounce. However, the oversold condition does not necessarily mean that the pair will reverse its downtrend.
The MACD indicator on all three timeframes (30-min, 4-hour, and daily) is bearish. This means that the selling pressure in the market is stronger than the buying pressure.
Conclusion
The EUR/USD currency pair is in a downtrend on all three timeframes (30-min, 4-hour, and daily). The technical analysis, Elliot Wave Theory, and MACD indicator are all bearish for the pair. The RSI indicator is oversold, but this does not necessarily mean that the pair will reverse its downtrend.
Trading Strategy
Based on the technical analysis, traders may want to consider shorting the EUR/USD currency pair at current levels. However, traders should be aware that the pair is oversold and may be due for a bounce. Traders should also be aware of the geopolitical tensions and the weakening economic outlook in Europe, which could weigh on the euro in the medium to long term.
AXS Elliot Wave Count In my opinion AXS is about to end or has end the correction and about to start it's 3rd wave.

XLM - Be Patient With the Correction
The correction on the daily chart has played out in line with my primary wave count.
Even though I believe we are on the final stages of this correction, the lack of RSI divergence and sideways price action still points to another leg down before any significant upside.

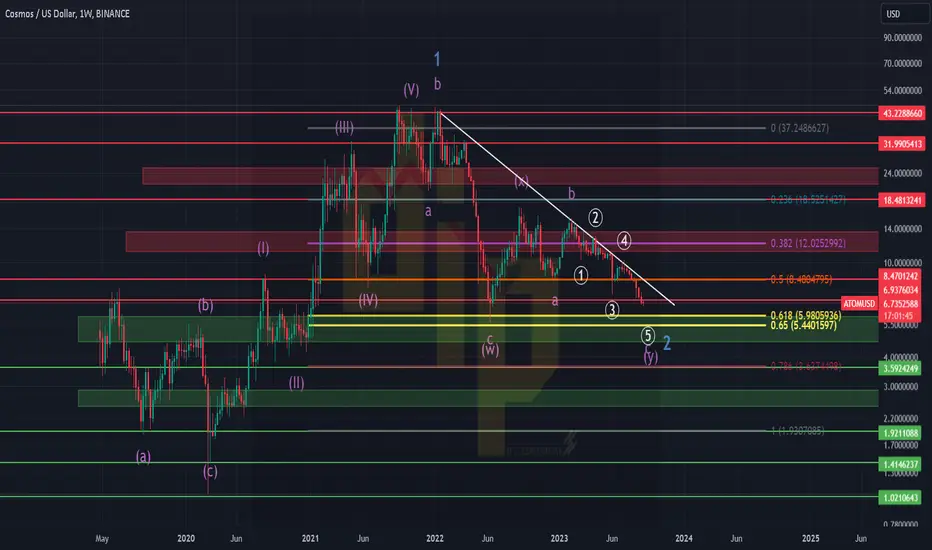
ATOM wave countI think ATOM is playing the fifth wave of a expanded flat .It may end at 5.98$ area or 3.6$ area
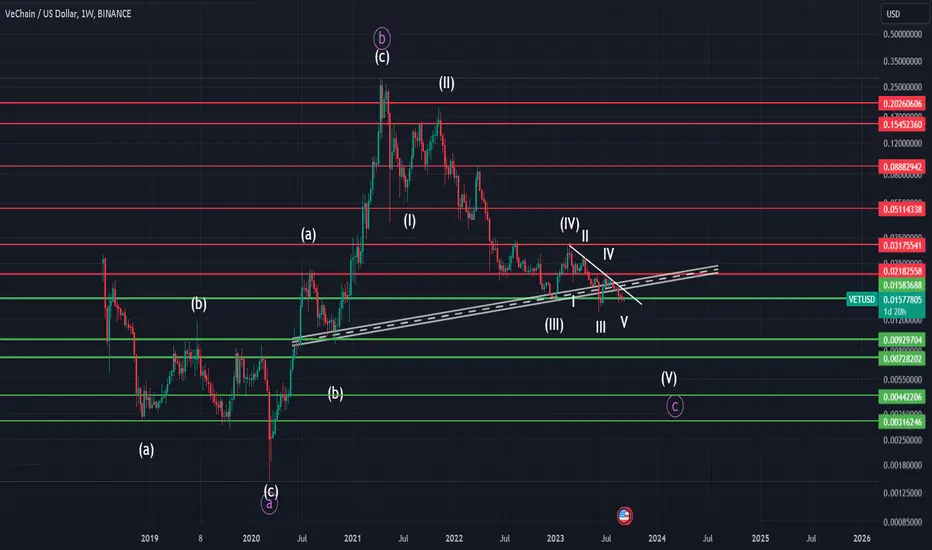
VETUSD Flat IdeaIn my point of view Vet is running a running flat correction from the beginning. In present it is running the final leg. Let's see whether the supercycle wave 5is truncated or not. If 0.218 area broken and started pumping the 5th wave has truncated and a new wave has started. Unless that we can expect further downward movement. Currently wee are in the leading diagonal of cycle wave
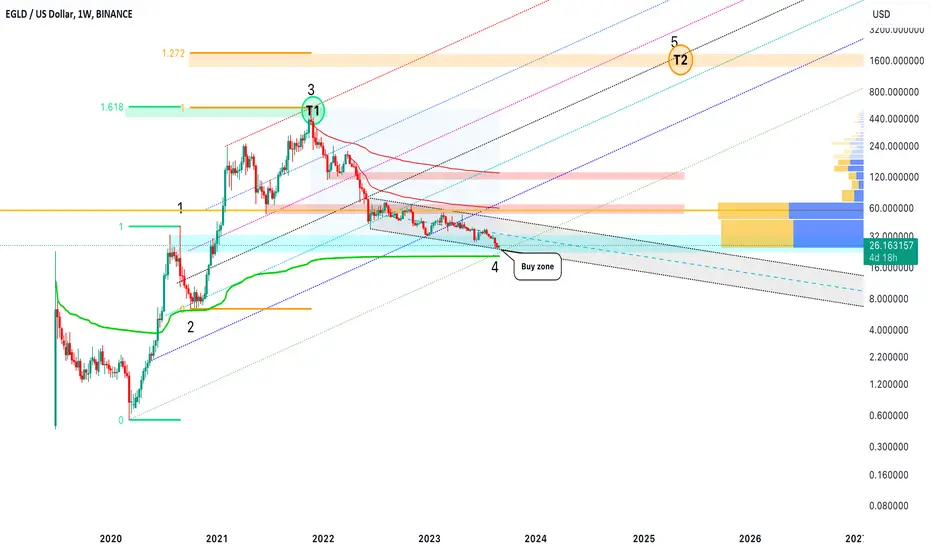
Elliot Wave count on EGLD/USDOn this EW weekly count, it seems that we are in the buy zone. The 1-2, and 3-4 legs respect the EW rules and they hit the targets accordingly. The fib levels also confirm this scenario. This is a long-term play but the good part is that the longer the time interval the higher the probability of working out and of course the higher the payout.
Bitcoin elliott wave updateFrom alth to bottom it made 5 waves Down. We are now in corrective fase up. I have provided a detailed count of the last 5th wave.
Some have the last 5 th wave as b wave. That is possible but I cannot get the subwaves to fit in a b wave. If it is a b wave we are now in an expanded flat which is about to end. For now I go with 5 waves Down and look for a zigzag up as a corrective move before new lows

Study and test Elliott Wave theoryI have been studying and experimenting with the original Elliott Wave theory for several days now. I've delved into the concepts and this is just the beginning, only 10 out of 100 in terms of results. Clearly, 90% is still incomplete for me. So, I'm looking for something more exceptional than this. Sometimes, time might help me develop something better. Haha... :)

Japanese Yen Is Trading At The SupportJapanese Yen has been one of the weakest currency in the last couple of months. But, looking at the JPY Futures chart, we can see it finishing a larger A-B-C corrective decline, while it's trading at the support, which can cause reversal and recovery for the Japanese Yen.
Even COT data of the japanese Yen shows extreme levels for Large speculators (green). It means that we may see some slow down of a current bear move, or even rally in the months ahead.

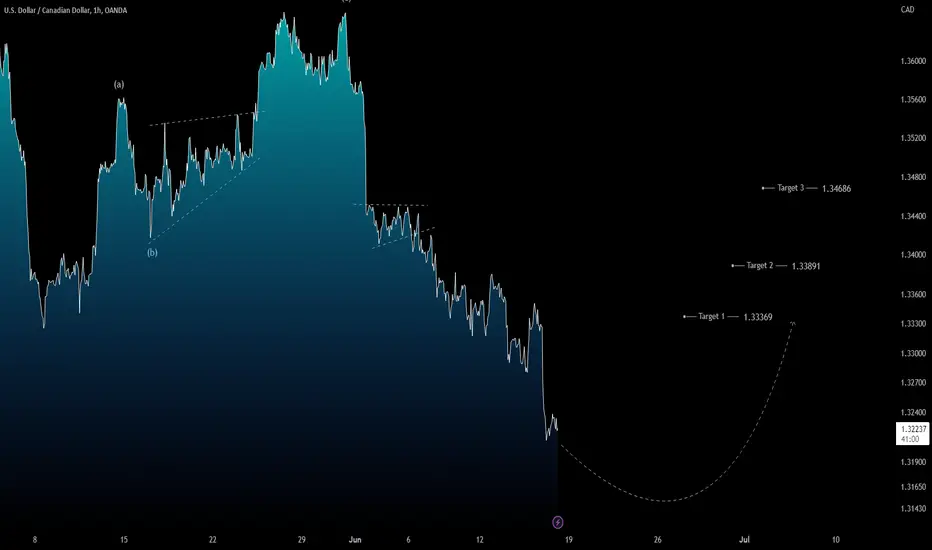
USD/CAD: Short Term "Buy the Dip" strategy!From a technical point of view,, the FX:USDCAD pair is bearish in short term, but at the same time, we think a corrective structure "must" be triggered. With this in mind, the strategy is simple: "Buy the Dip" on the intraday chart (1H time frame).
On chart I have shown some potential targets that could be reached, but to understand which of these to look at, we need to follow the swing that will form (3 or 5 waves), so it will be necessary to follow and update this analysis (levels) along the way.
Trade with care!
Like 🚀 if my analysis is useful.
Cheers!
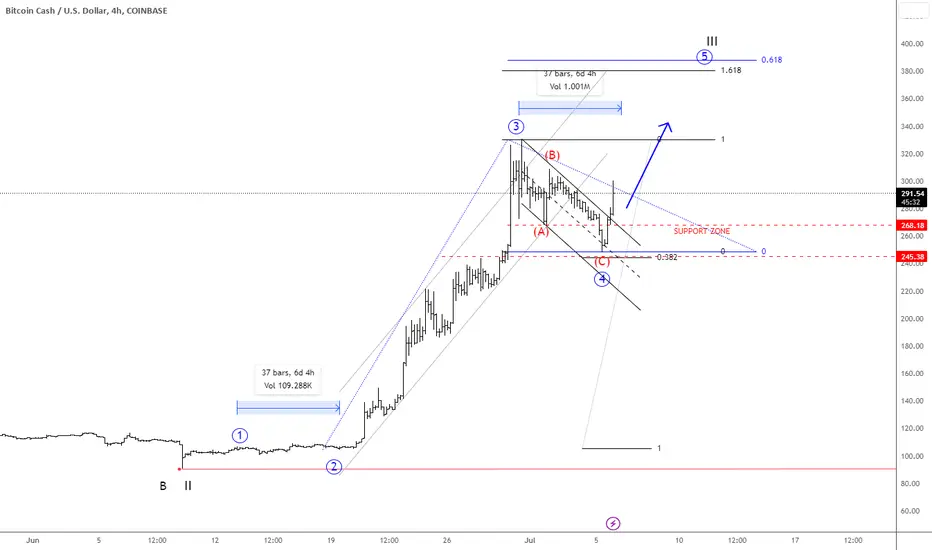
BCHUSD Is Pointing Higher Within A Bullish ImpulseBitcoin Cash with ticker BCHUSD is one of the first weaker ALTcoins with a massive recovery away from the lows. In the 4-hour, we are tracking wave 4 correction after a completed an extended wave 3. It's bouncing sharply and strongly from projected support after a three-wave (A)-(B)-(C) corrective setback in wave 4. So, seems like wave 5 is now underway that can send the price up to 350 – 400 area.
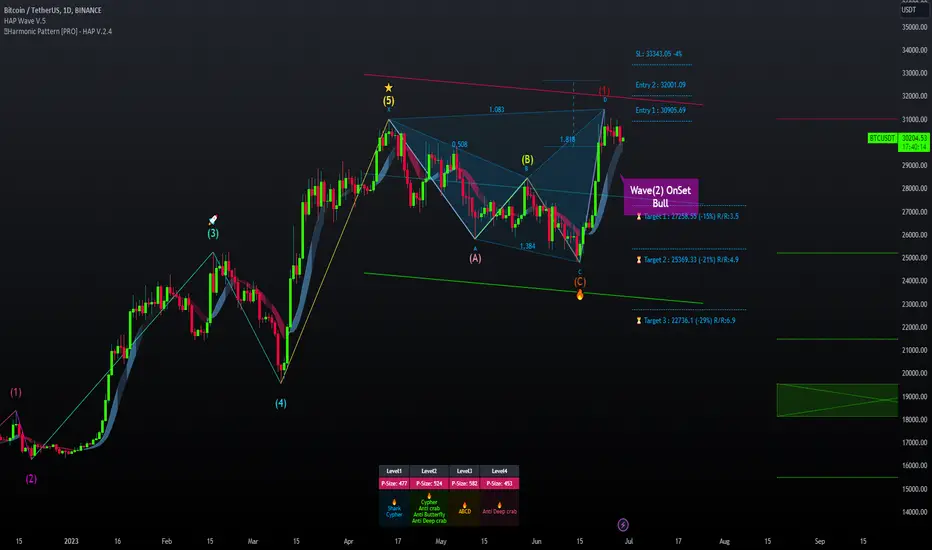
Bitcoin Wave 2 onset and Harmonic likely to emerge soon. BINANCE:BTCUSDT Wave 2 onset and Harmonic Pattern It appears that both patterns are likely to emerge soon. Please be cautious. However, if the price can go back above 32K, we may witness a strong reversal.