Ethena Bullish Momentum Builds, Eyes 30% Rally to $0.85Hello✌
Let’s analyze Ethena’s upcoming price potential 📈.
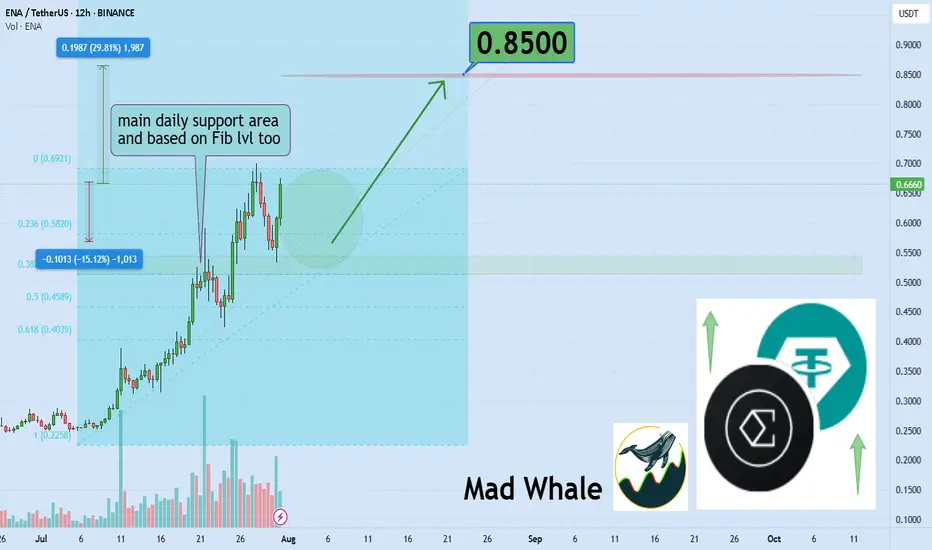
BINANCE:ENAUSDT has demonstrated strong bullish momentum recently, supported by positive fundamental developments 📈. The price is currently near key daily and Fibonacci support levels. If these hold, a potential 30% upside targeting $0.85 looks likely 🚀.
✨We put love into every post!
Your support inspires us 💛 Drop a comment we’d love to hear from you! Thanks , Mad Whale
Enalong
ENA About to Explode or Dump? Key Levels You Can’t Ignore!Yello Paradisers — are you positioned right for the next potential explosion in #ENA, or will you get caught on the wrong side of the move like most retail traders? After a brutal grind in a descending channel, something big is brewing... and it’s coming faster than many realize. Let's dive in.
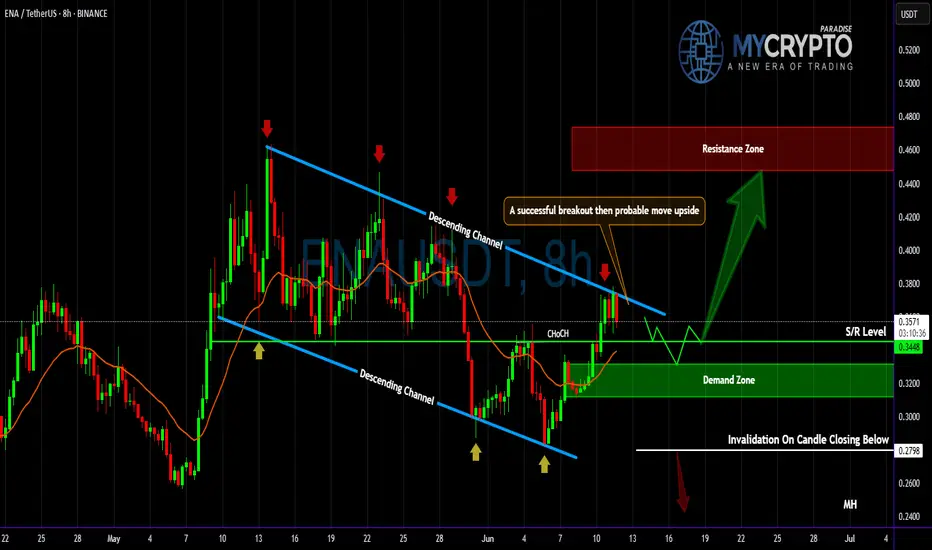
💎#ENAUSDT currently facing a key resistance at the upper boundary of the descending channel, clearly tested multiple times and respected well by the market structure. A candle close above this channel would trigger a confirmed breakout, which opens up a clean path for continued upside movement — the next major target sits at the resistance zone between 0.446 and 0.4725.
💎There’s a high-probability alternative setup unfolding as well: ENA holding the S/R level around 0.3448 and the demand zone below, which aligns perfectly with the multi-timeframe EMA support. If this area holds strong, expect another impulse move toward our resistance zone as momentum builds.
💎Price had been forming lower highs and lower lows, respecting the downtrend But recently we observed a Clear Change of Character (ChoCH) — ENA broke market structure by forming a higher high.What usually follows? A higher low, and that’s where we are now.
💎The most probable scenario is for price to pull back to the S/R level or dip into the demand zone, and then form a higher low before making the next leg upward toward resistance.
💎Invalidation is simple and must be respected: if we see a confirmed candle close below 0.2798, then the bullish case breaks and the setup is no longer valid. This is where you must cut quickly, avoid hope-trading, and reassess the structure from scratch.
Don’t chase. Don’t panic. React with strategy, not emotion. This is how real professionals win in crypto. Stay sharp, Paradisers.
MyCryptoParadise
iFeel the success🌴
#ENA/USDT#ENA
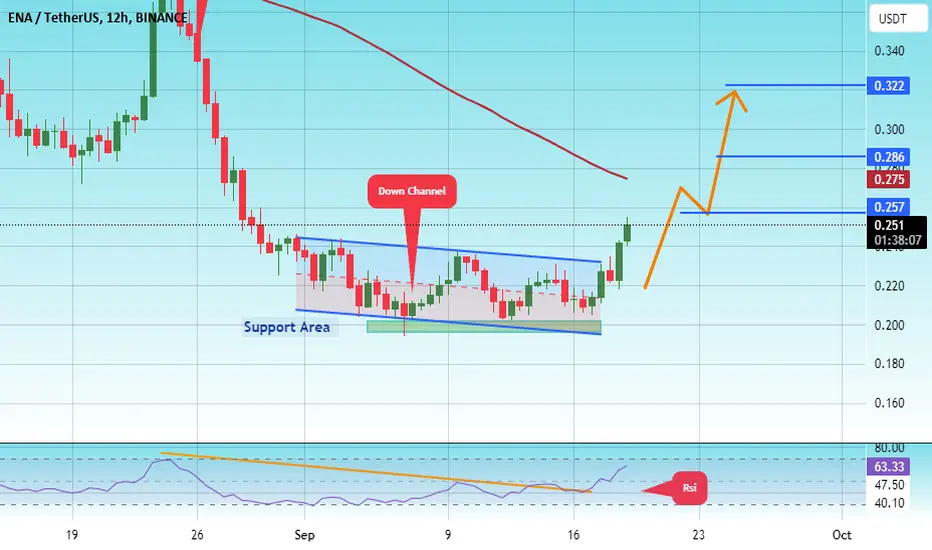
The price is moving in a descending channel on the 12-hour frame and is sticking to it to a large extent and it was broken upwards
We have a bounce from the lower limit of the channel at a price of 0.200
We have an upward trend on the RSI indicator, which supports the rise
We have a trend to stabilize above the moving average 100
Entry price 0.220
First target 0.257
Second target 0.286
Third target 0.322
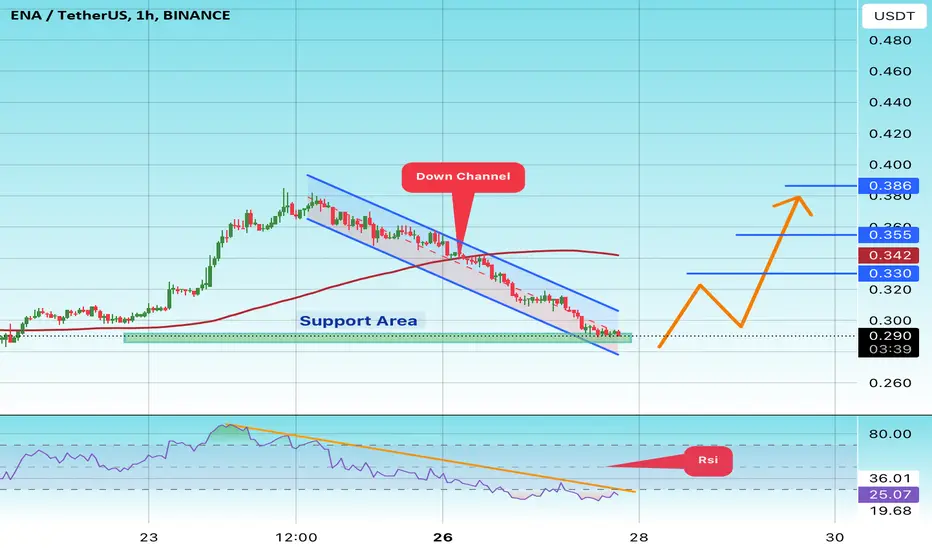
#ENA/USDT#ENA
We have a descending channel pattern on the 12-hour frame, the price is moving within it and adhering to its borders well
We have a support ar ea in green at a price of 0.800 after the price touched it and rebounded from it
We have a trend to stabilize above the moving average 100
We have a descending trend on the RSI indicator that supports the price upwards and is expected to break it
Entry price 0.2900
First target 0.330
Second target 0.355.
Third target 0.386
#ENA/USDT#ENA
The price is moving within a bearish channel pattern on the 4-hour frame, which is a strong retracement pattern
We have a bounce from a major support area in the color EUR at 0.470
We have a tendency to stabilize above the Moving Average 100
We have a downtrend on the RSI indicator that supports the rise and gives greater momentum and the price is based on it
Entry price is 0.500
The first goal is 0.566
The second goal is 0.618
Third goal: 0.672
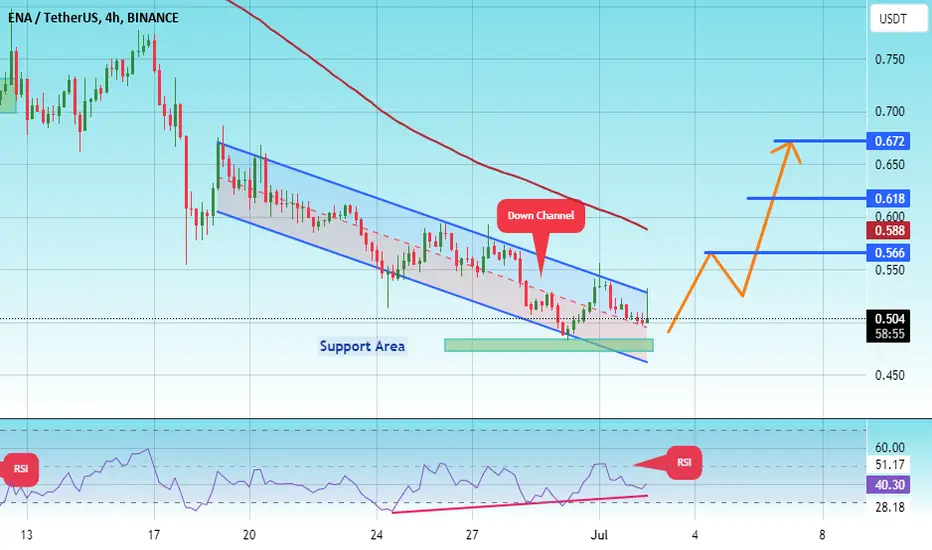
Chart Idea - ENAUSDT Swing LongChart Idea - ENAUSDT Swing Long
Self Explanatory chart. Will keep building this position and move SL to previous resistance break out areas. It's a swing trade and can take weeks to play out.
Will update!
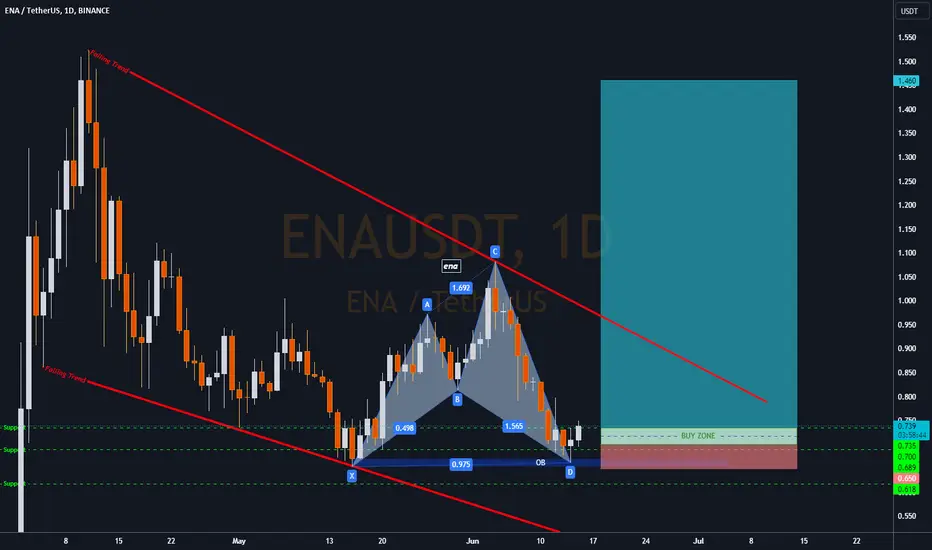
ENAENA has formed harmonic pattern
the price will have correction soon before achieving double profit
good entry when BTC will dumb
be careful and keep stop lose
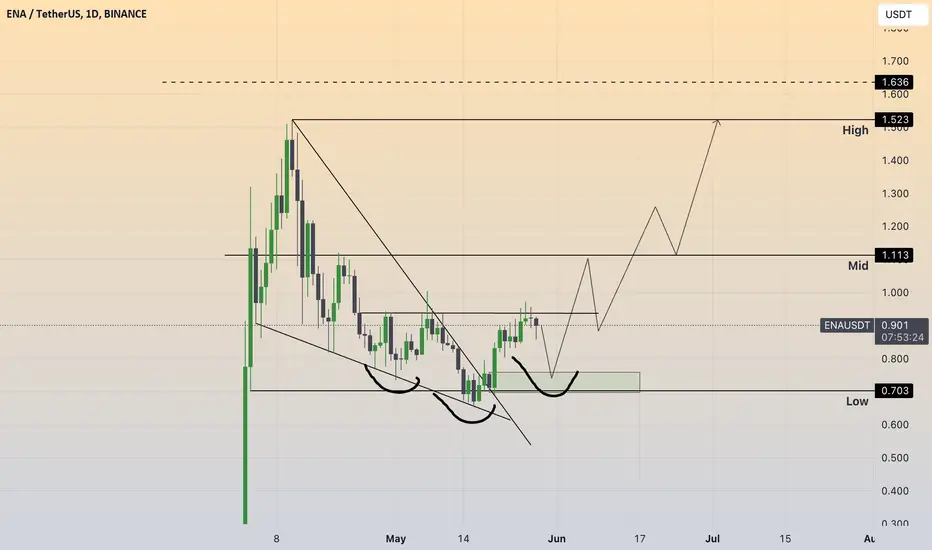
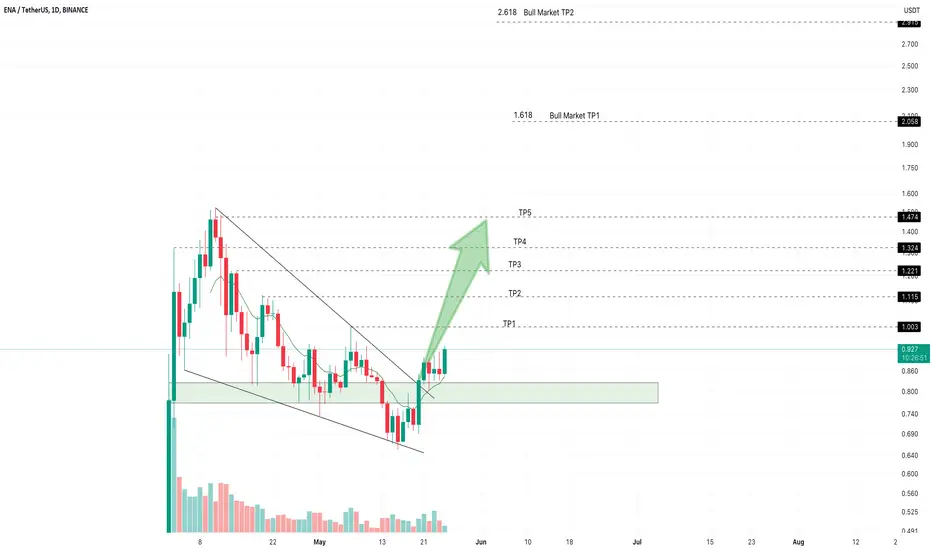
ENA Super Long Trade Setup ENA/Usdt chart is super clean and clear.
Confluences:
1. Left shoulder done, head done, now waiting for right shoulder formation.
2. Bullish Flag breakout done.
No more confluences are required, chart is crystal clear.
Must Take this as positional trade and hold it for 1-2months for high reward.
You can close trade at mid or high depends on your wish or keep checking updates.