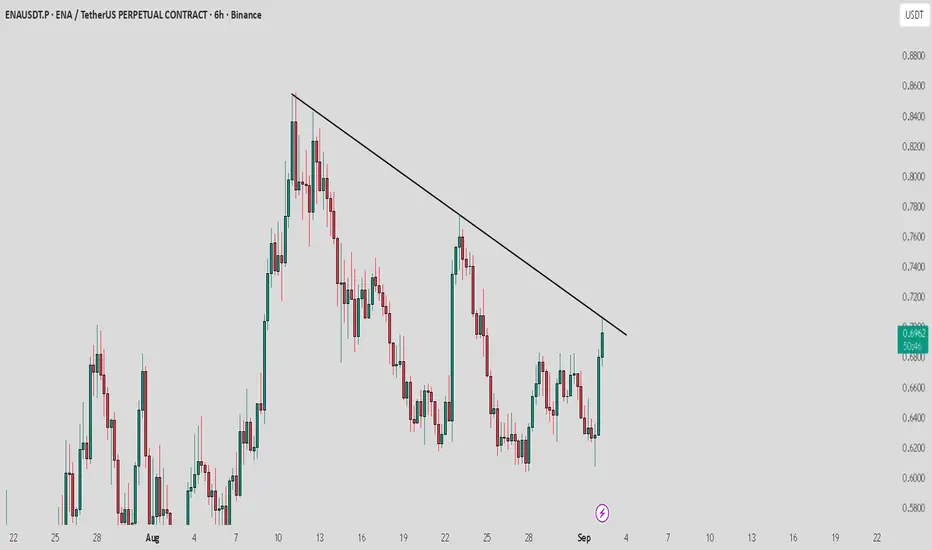
ENA / USDT : Keep a close watch on breakoutENA/USDT is currently testing trendline resistance and attempting a breakout.
Bullish scenario: A successful breakout with confirmation could push price toward $0.80 – $0.85.
Bearish scenario: Failure to breakout will invalidate this setup.
Always manage risk and avoid entering without clear confirmation.
ENAUSDT
ENAUSDT UPDATE#ENA
UPDATE
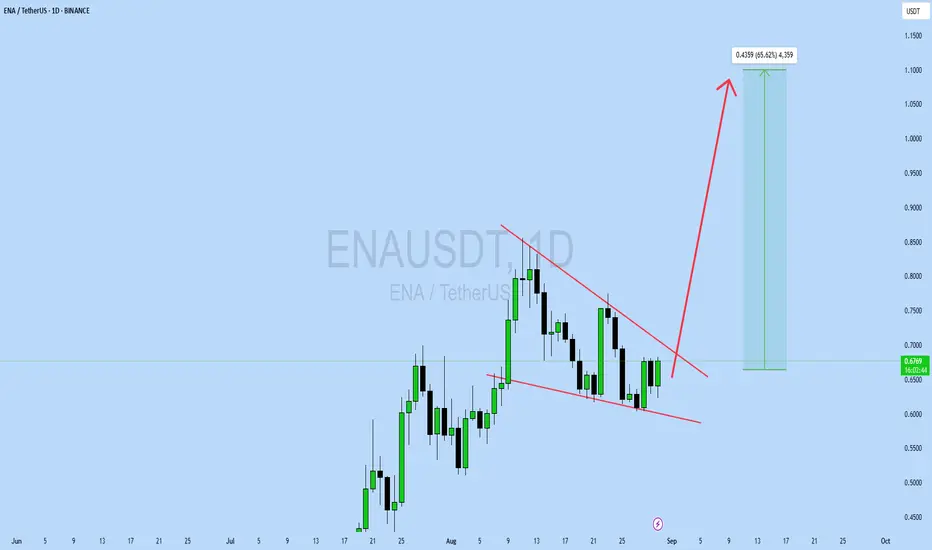
ENA Technical Setup
Pattern : Falling Wedge Pattern
Current Price: $0.6759
Target Price: $1.11
Target % Gain: 65.62%
Technical Analysis: ENA is consolidating inside a falling wedge on the 1D chart. Price is holding near support and showing signs of breakout potential, with upside momentum likely to push toward $1.11 if confirmed by volume.
Time Frame: 1D
Risk Management Tip: Always use proper risk management.
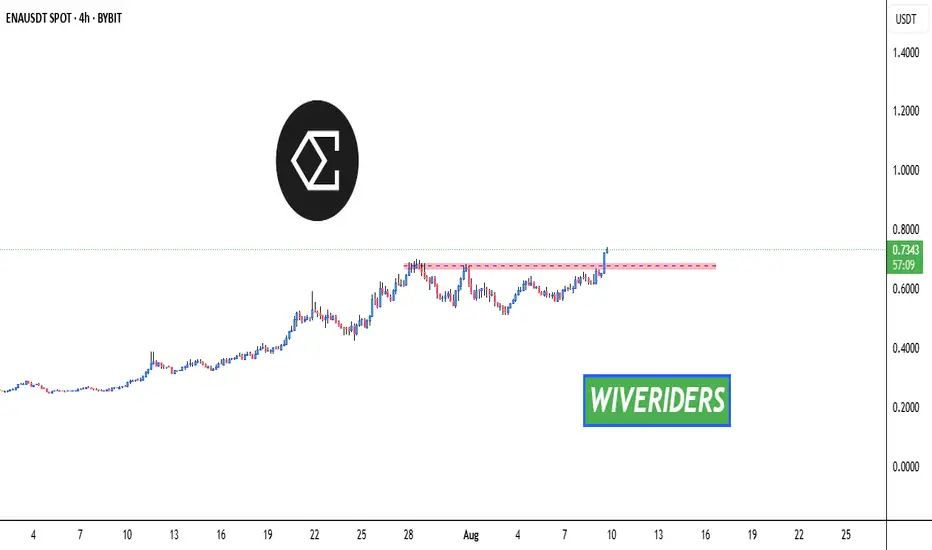
ENA Breakout Alert!🚨 MIL:ENA Breakout Alert! 🚨
MIL:ENA is currently testing the red resistance zone 🔴
If price breaks out, the first target will be the green line level 🎯
A confirmed breakout here would signal bullish continuation and could fuel further upside ✅

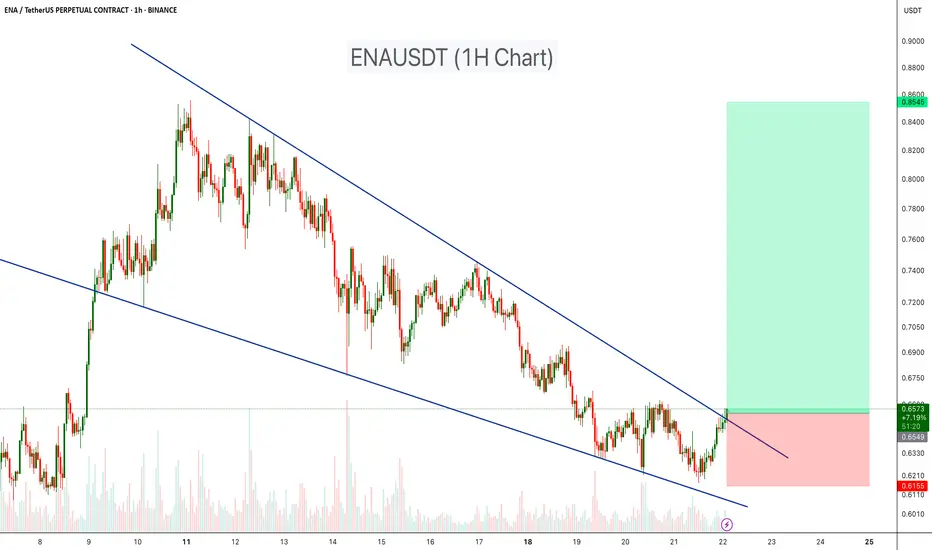
ENAUSDT – Falling Wedge Breakout in PlayENAUSDT on the 1H chart is forming a falling wedge pattern, which is typically a bullish reversal signal. After a consistent downtrend, the price is now testing the upper wedge resistance.
A breakout above this level could confirm bullish momentum, with potential upside toward the 0.85 USDT target zone.
Resistance 1:0.72
Resistance 2:0.79
Resistance 3:0.85
Stop loss: $0.615
Cheers
Hexa
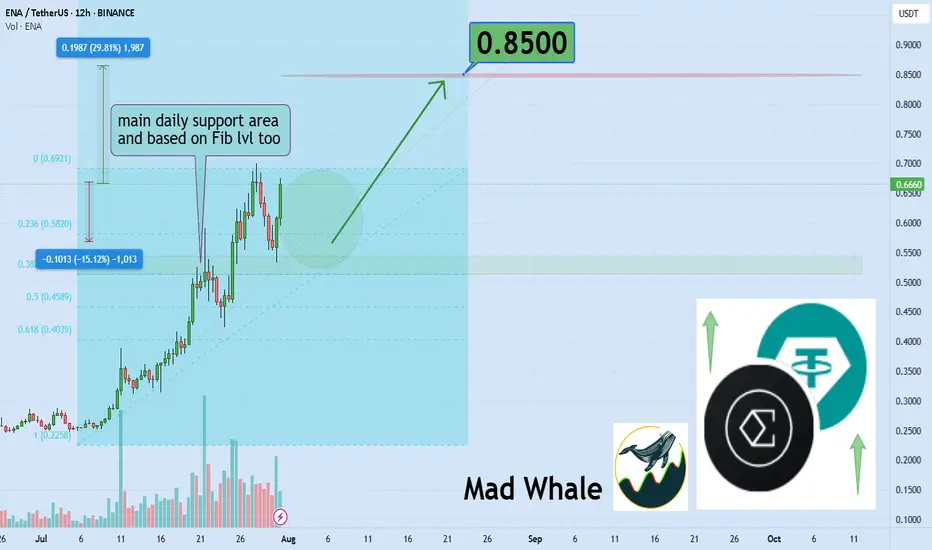
Ethena Bullish Momentum Builds, Eyes 30% Rally to $0.85Hello✌
Let’s analyze Ethena’s upcoming price potential 📈.
BINANCE:ENAUSDT has demonstrated strong bullish momentum recently, supported by positive fundamental developments 📈. The price is currently near key daily and Fibonacci support levels. If these hold, a potential 30% upside targeting $0.85 looks likely 🚀.
✨We put love into every post!
Your support inspires us 💛 Drop a comment we’d love to hear from you! Thanks , Mad Whale
Ethena Showing Strength, Poised for 20% Rally to $0.99Hello✌️
Let’s analyze Ethena’s price action both technically and fundamentally 📈.
🔍Fundamental analysis:
Ethena’s USDe hit $10B market cap in 500 days, helped by U.S. rules limiting yield on other stablecoins. Institutional demand for its DeFi-based returns could lift ENA’s role and value. 💹
📊Technical analysis:
BINANCE:ENAUSDT is showing exceptional strength with strong volume, solid Fibonacci support, and a key daily trendline 📈. These technical factors suggest a potential 20% upside targeting $0.99 🚀.
✨We put love into every post!
Your support inspires us 💛 Drop a comment we’d love to hear from you! Thanks, Mad Whale

Ethena Poised for 29% Rally Toward Crucial 0.75 Target Hello✌️
Let’s analyze Ethena’s price action both technically and fundamentally 📈.
🔍Fundamental analysis:
Every $1B rise in USDe means more demand for ENA tokens as collateral. With $290M revenue, ENA shows strong, steady growth potential 🚀.
📊Technical analysis:
BINANCE:ENAUSDT is approaching a critical daily support zone that also coincides with a key level on the daily chart 📉. If this support holds firm, we could see a strong 29% rally toward the 0.75 target 🎯. This setup offers a clear risk-reward for traders watching closely.
✨We put love into every post!
Your support inspires us 💛 Drop a comment we’d love to hear from you! Thanks, Mad Whale

ENA Breakout Alert – Red Resistance Cleared! 🚨 MIL:ENA Breakout Alert – Red Resistance Cleared! 🔴✅
MIL:ENA has finally broken out of the red resistance zone.
📊 This breakout signals bullish momentum with potential for further upside.
🔥 Buyers stepping in strong —
ENAUSDT 4H Chart Analysis | Bullish Breakout Setup in FocusENAUSDT 4H Chart Analysis | Bullish Breakout Setup in Focus
🔍 Let’s dive into the ENAUSDT perpetual contract and analyze the recent price action, spotlighting key technical signals and a potential breakout scenario.
⏳ 4-Hour Overview
The 4-hour chart shows ENAUSDT consolidating above a critical ascending trendline, with price action tightening into a symmetrical triangle formation. Multiple attempts to break down have resulted in a fake breakout, as indicated by low volume during the breakdown — a classic sign of seller exhaustion.
🔺 Bullish Breakout Setup:
On the upside, a confirmed breakout above the $0.6800 resistance could pave the way for a bullish continuation towards the $0.8000 target zone. The structure suggests increasing buying pressure as long as price holds above the trendline and key support ($0.6050).
📊 Key Highlights:
- Price retested the ascending trendline; buyers defended it aggressively.
- A fake breakout with low volume suggests trap for bears and quick recovery by bulls.
- The next major resistance comes at $0.6800, with a projected target at $0.8000 upon breakout.
- Short-term support sits at $0.6050. Price action above this level remains constructive.
🚨 Conclusion:
Watch for a decisive move beyond triangle resistance. A high-volume breakout above $0.6800 could trigger a sharp move toward $0.8000. Bulls are building momentum — keep an eye on volume to confirm breakout strength.

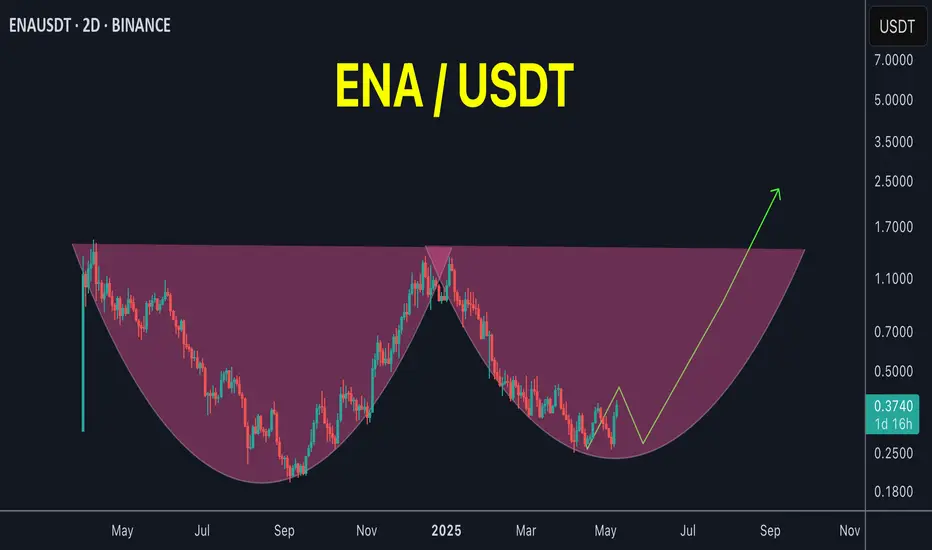
ENA / USDT#ENA / USDT
Iam expecting big returns from ETH and its related coins in this season
This chart is also looking good
Another Potential round bottom pattern under formation
Keep an eye
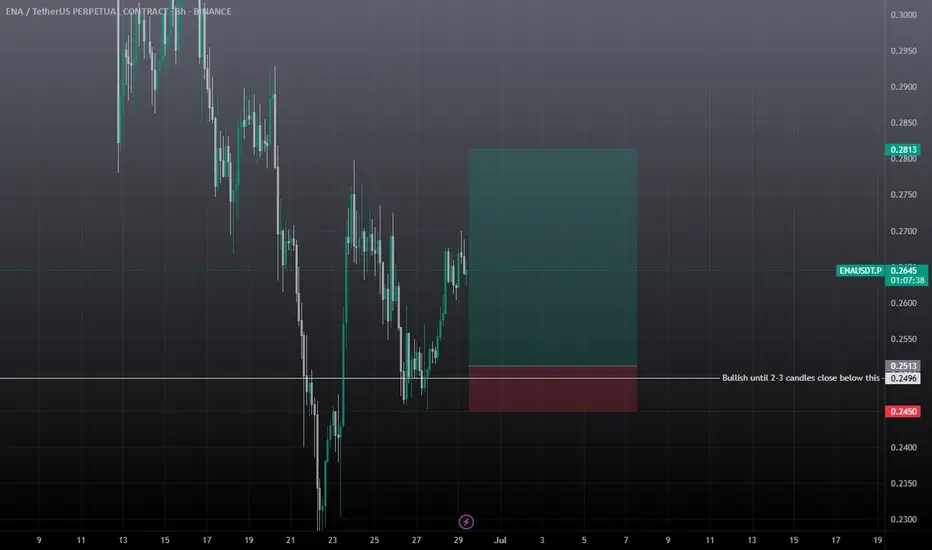
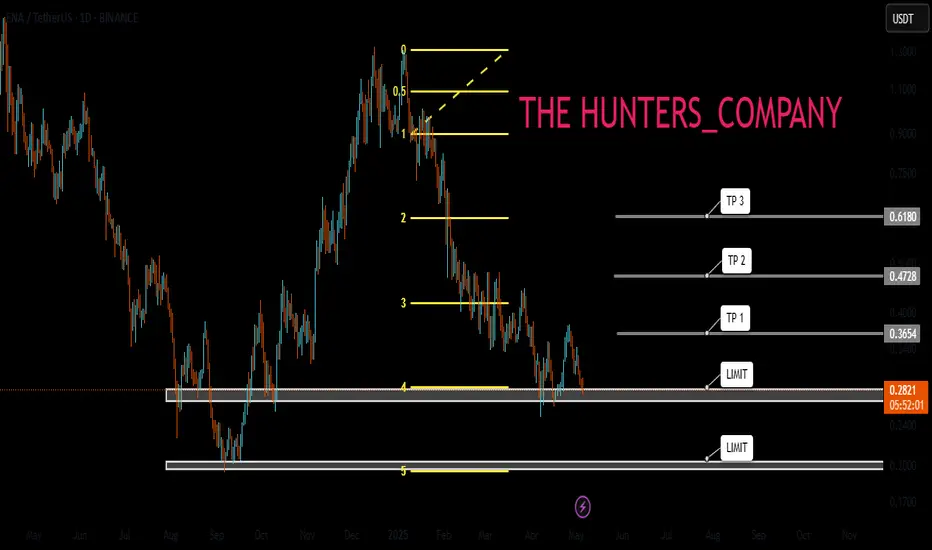
Long-Term Technical Analysis of ENA CoinENA coin continues its downward movement after being rejected from the $0.70 resistance level. As long as ENA holds above the 4H support level at $0.5549 with confirmed 4-hour candle closes, it is likely to attempt a rebound toward the weekly resistance zone (marked in blue).
However, if ENA loses the $0.5549 support level and closes multiple 4H candles below it, further downside momentum is expected. In such a scenario, the initial downside target would be $0.4611.
For long-term spot investments in ENA, the price range between $0.3952 and $0.3781 should be closely monitored by investors.
Our plan is to accumulate ENA coin within the $0.3952 – $0.3781 support range for long-term spot positions. If the price reaches this zone, our target will be set at $1.
Not Financial Advice (NFA).

ENA Explodes After Breakout – What’s Next?
ENA Exploded 100%+ After Our Post 🚀
Just days ago, we highlighted ENA as one to watch — and it delivered.
Since then, price has nearly doubled, breaking past key resistance with strong volume and momentum.
This is why timing + conviction matters. When the setup is clean, the move speaks for itself.

Ethena · Millions Overnight? It Can Be DoneEthena is starting its 2025 bullish cycle with three full green candles. The current week has the highest volume since the first week of trading in April 2024. Normally the first week of trading tends to produce the highest volume. ENAUSDT is matching those days now and market conditions are so much better in 2025 compared to 2024.
The entire bullish period last year lasted less than two months. That's it. This wasn't an uptrend nor a bull market, it was more like a bullish jump. A momentary event. ENAUSDT right now is entering the 2025/26 bull market. Growth can be sustained for a period of 6 months or longer. Sometimes a bull market trend can last 8 months, 12 months, or even 16 months or longer. We have many examples across the market.
This week Ethena is trading above EMA55 weekly for the first time ever. The bullish bias is confirmed.
When I saw this pair it was already moving, not the bottom catch that I like and go for and yet, I still went ahead on it because it is still early when you consider the bigger picture; practice what you preach.
We missed the bottom but it is still early, there is plenty of room available for growth. Trading is easy when the market is approached with the right mentality, with a simple working plan. Buy and hold. Watch how the market will take care of the rest.
Just deposit and continue to invest, as much as you can. Continue to add to each position you like and grow; let it grow. Check back every 3 weeks, every 1-2 months; watch your money grow. It is truly that simple. Timing is very important for this strategy and the best timing is now. Right now we are on the verge of a major advance, no need to wait. You can buy today and start earning within days.
A few months back, we had to wait for months. A few weeks back, we had to wait for weeks. Entering the market now, the wait is short but patience is key.
It will go higher than what is shown on the chart. This publication is to alert you of a great timing, be ready to wait. Make sure to do your own planning. The risk is minimum when trading spot. The worst case scenario is a long wait. If things go right; enter green, stay green and profits-capital grow.
Success can be achieved but the hard part is being around now, when prices are low. It is easy to be around when there is hype and everything is 1,000% up. But can you beat the impulse to sell when the right choice is to buy? Can you take action now and go ahead?
If you are reading this now, you are in the right track but for many people it is not that easy, they are allergic to low prices and they won't be reading this until it is too late. 90% of the people will only become aware of these opportunities that I am showing you daily when it is too late.
That's ok. We use the experience to learn. When I first started I went through the same process. The euphoria got my attention and when I became aware of the market everything was already high up. We tend to join at the market top. But then we go through the entire cycle, the market is here to stay. We get to buy the bottom, we gain experience and in the end we can always win if we never give up. Persistence and consistency, be ready to hold.
If you can hold your altcoins when prices are low, you will reap the rewards at the time of the bull run. Millions to be made overnight. Years of preparation, but it can be done.
Namaste.

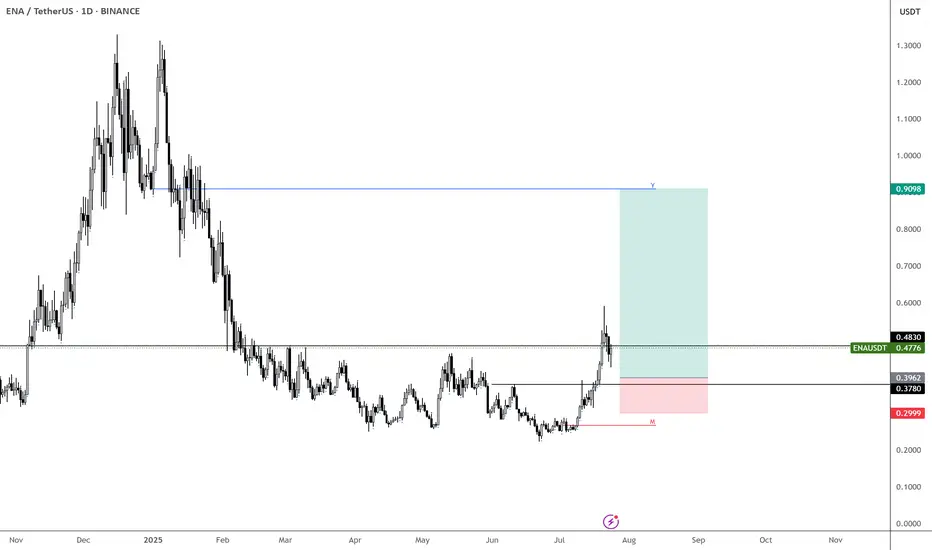
ENA Analysis (3D)ENA has been outperforming many altcoins for weeks, yet it still appears undervalued based on its fundamentals and recent investor interest.
Where to buy?
Right now, buying at current levels is extremely risky, as the ideal buy-back zones are significantly below the market price.
First major support: $0.48 — considered a "cheap" entry.
Dream entry (low probability): $0.37–$0.38 — at that point, ENA would feel almost free.
Notably, BlackRock and its partners are actively investing in ENA, which speaks volumes about its long-term credibility. That alone justifies keeping it on your radar.
Minimum target: $1.00–$1.20
Remember, that’s just the beginning. We may see even more once momentum kicks in.
Sometimes, the best trade is the one you're waiting for.
Good luck.

ENA – Sub-40c Would Be a Gift
If we get BINANCE:ENAUSDT below 40c, that would be an incredible opportunity.
Maybe I’m being too greedy—or maybe not. I’ll let the market decide.
Right now, ENA looks like a solid play for the coming weeks, so I’m focused on finding the best possible entry.
MARKETSCOM:ETHEREUM still looks strong overall. Even with a minor retrace, I’m expecting higher—potentially up to $7k.
So it makes sense to position in names like BINANCE:ENAUSDT , BINANCE:EIGENUSDT , BINANCE:AAVEUSDT , and others to ride the wave.
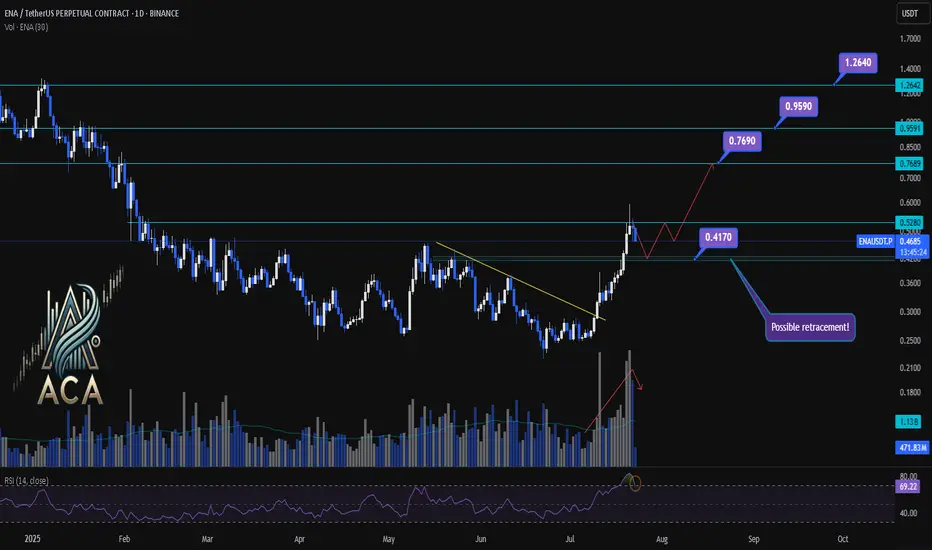
ENA/USDT Chart Analysis | Volatility Signals & Bullish TriggersENA/USDT Chart Analysis | Volatility Signals & Bullish Triggers
🔍 Let’s dive into the ENA/USDT perpetual contract and analyze recent price action, focusing on momentum shifts and key breakout scenarios.
⏳ Daily Overview
The daily chart shows that ENA recently reentered the overbought zone on the RSI, which can serve as a potential trigger for traders watching momentum shifts. Earlier, price action broke decisively above a long-standing descending trendline, resulting in a rapid, nearly 100% surge, a classic RR2 move off the trendline. This breakout coincided with a visible uptick in trading volume, confirming strong demand behind the move.
Now, during the ensuing rest or correction phase, trading volume is decreasing—often a constructive sign suggesting either profit-taking or a healthy pullback rather than panic selling.
🔺 Bullish Trigger & Setup:
- RSI Signal: Reentry into the RSI overbought zone is a potential long trigger, especially if confirmed by price action.
- Confirmation Level: A daily close with strong volume above $0.528 would add conviction to a bullish setup.
- Trendline Reference: The break above the recent trendline fueled the rapid advance, showing the importance of watching such key resistance levels.
📊 Key Targets (on further bullish confirmation):
- $0.769 — First upside resistance.
- $0.959 — Next bullish target.
- $1.264 — Extension target if momentum continues and broader market sentiment remains supportive.
🚨 Conclusion:
Eyes are on the $0.528 level—closing above it with volume, especially while RSI holds in the overbought zone, could provide the next strong entry signal. Current declining volume during pullbacks suggests this is likely a profit-taking phase or standard correction, not bearish capitulation. Keep monitoring RSI, volume profile, and price closes for the next actionable opportunity.
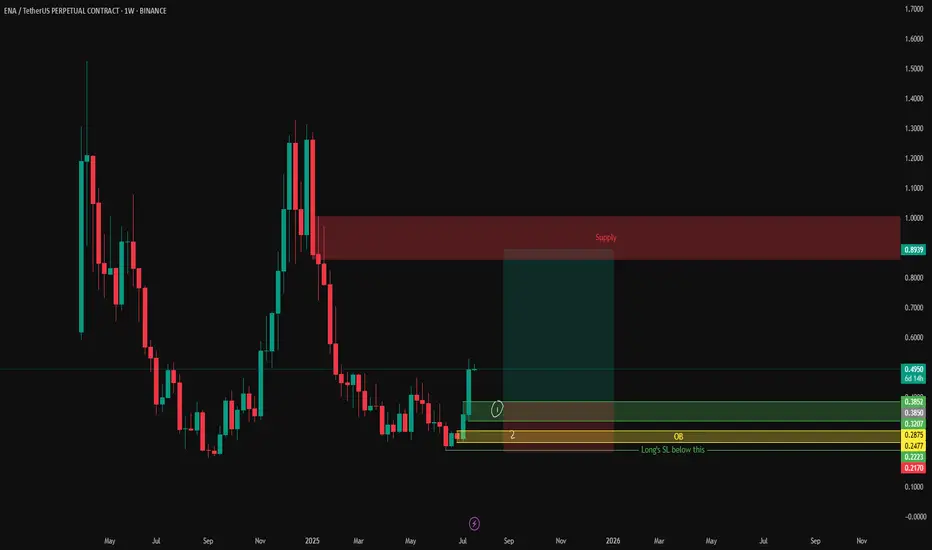
ENA Swing planENA swing plan explained in the chart.
Strategy: Supply and Demand.
Higher Time frame confirmations needed before entering.
Scaled entries would be preffered.
21:1 risk-to-reward trade setup for EthenaIs it time for the bulls to push it higher? This setup offers a 21:1 risk-to-reward ratio with a target of 1.25.
Entry 0.32
Stop loss 0.25
Target 1.25
ENAUSDTAccording to TRex, the price has made a sharp downward move. I expect a triple drive, which has turned two-sided and is expecting a third drive.

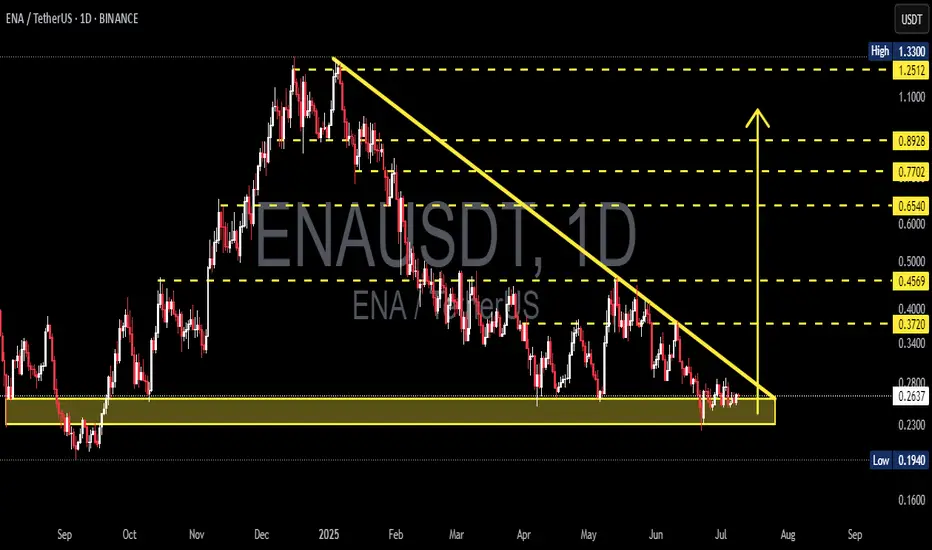
ENA/USDT Breakout Watch Signs of Reversal from a Key Demand Zone🔍 Full Technical Analysis:
ENA/USDT has been forming a Descending Triangle pattern since the December 2024 high — a structure often seen in continuation moves, but here it may act as a potential reversal pattern, especially since price is consolidating around a strong historical demand zone.
The price is hovering within a key support area between $0.1940–$0.2624, which has repeatedly held against bearish pressure. Recent candles are showing signs of accumulation, indicating possible base formation before a breakout.
✅ Bullish Scenario (Breakout Setup):
If the price successfully:
1. Breaks above the descending trendline (yellow line), and
2. Confirms with a breakout above the $0.28–$0.30 zone with strong volume,
We could see a powerful bullish reversal with the following upside targets:
📈 Target 1: $0.3720
📈 Target 2: $0.4569 – breakout structure confirmation
📈 Target 3: $0.6540 – prior resistance zone
📈 Target 4: $0.7702
📈 Target 5: $0.8928
💥 Extended Targets: $1.2512 – $1.3300 (Major High from December 2024)
🚨 A clean breakout from this setup may trigger major FOMO and offer multi-level swing trading opportunities.
❌ Bearish Scenario (Breakdown Risk):
If the downtrend continues and:
The price fails to break above the trendline, and
Breaks below $0.1940, which is the historical low support,
Then the door opens for further downside towards: 🔻 Bearish Target: $0.1600 or lower
⚠️ A confirmed breakdown below this key zone would suggest trend continuation and weakness in buyer interest.
🧠 Strategic Summary:
Strong Demand Zone + Historical Support suggest high probability of trend reversal.
Descending Triangle offers a textbook breakout opportunity with favorable risk-reward.
High RR potential makes this setup ideal for swing traders and mid-term investors.
💡 Success tip: Wait for breakout confirmation and volume spike before entering.
#ENAUSDT #CryptoBreakout #DescendingTriangle #BullishReversal #AltcoinSetup #CryptoTrading #SwingTrade #TechnicalAnalysis #ChartPatterns #SupportAndResistance
ENA : The largest token release...Hello dears
Given the long-term price decline that we have witnessed, it has now been announced that this currency is going to do a token release, which will naturally cause the price to fall, so be careful.
In case of a fall, we have identified important supports for you so that you can buy with risk and capital management.
The target has also been identified.
*Trade safely with us*
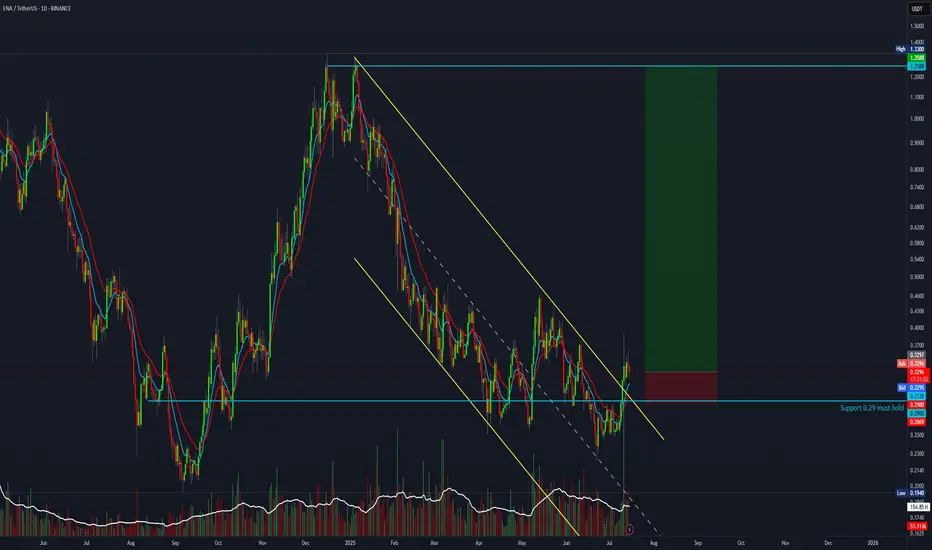
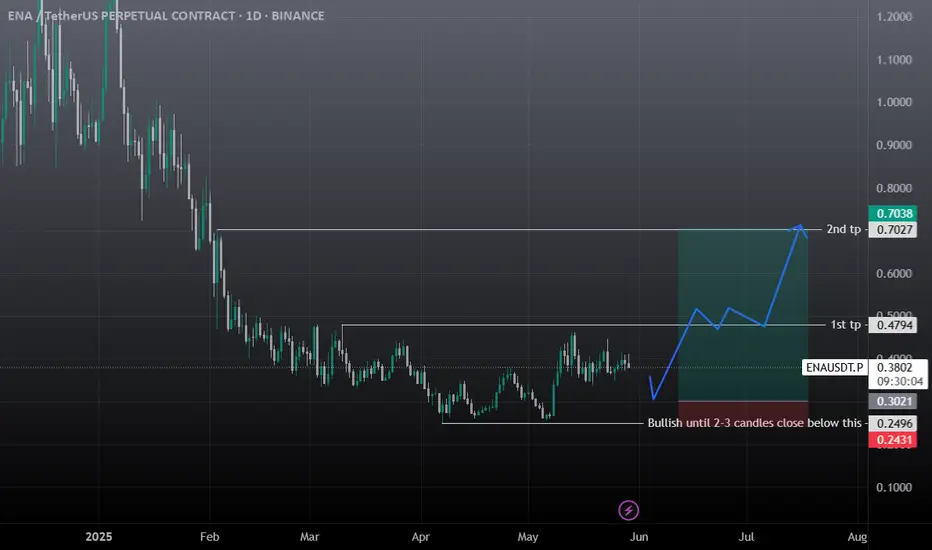
ENA Long / Buy Swing SetupENA Looking Good here, daily closing above 1st tp guaranteed tp 2. Ena can be the next SUI, Ondo. Below 0.31$ buying is a good choice and hold till 1st and then 2nd tp. While for the long term investors it has the potential to hit 2-3$ mark.
ENAUSDT Long / Buy SetupOn lower tf ena showing bullish momentum, while previous setups went bad due to war, but ena still holding the previous marked area, this is a short term setup not long term, still expecting another low for whole market. Will share swing setups if found strong momentum. Must use SL as btc as it's peak.