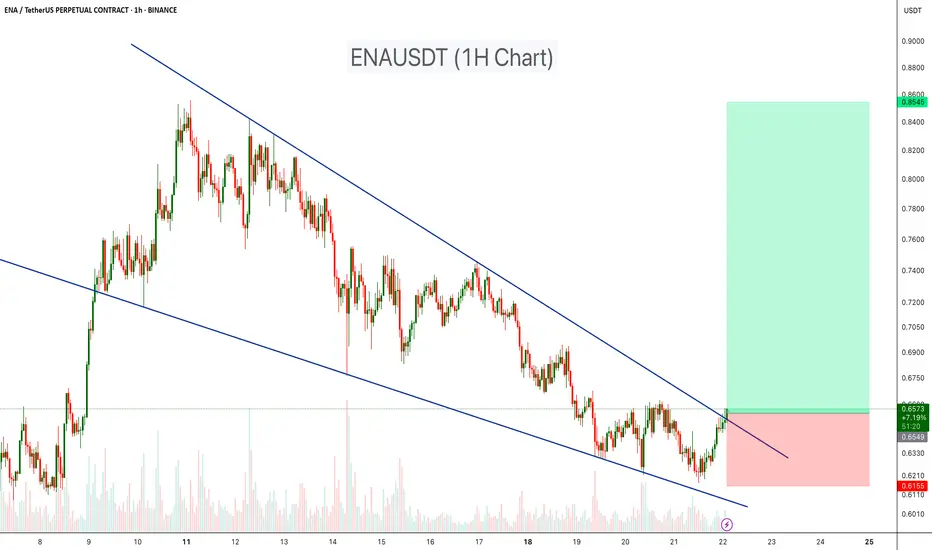
ENAUSDT – Falling Wedge Breakout in PlayENAUSDT on the 1H chart is forming a falling wedge pattern, which is typically a bullish reversal signal. After a consistent downtrend, the price is now testing the upper wedge resistance.
A breakout above this level could confirm bullish momentum, with potential upside toward the 0.85 USDT target zone.
Resistance 1:0.72
Resistance 2:0.79
Resistance 3:0.85
Stop loss: $0.615
Cheers
Hexa
Enausdtanalysis
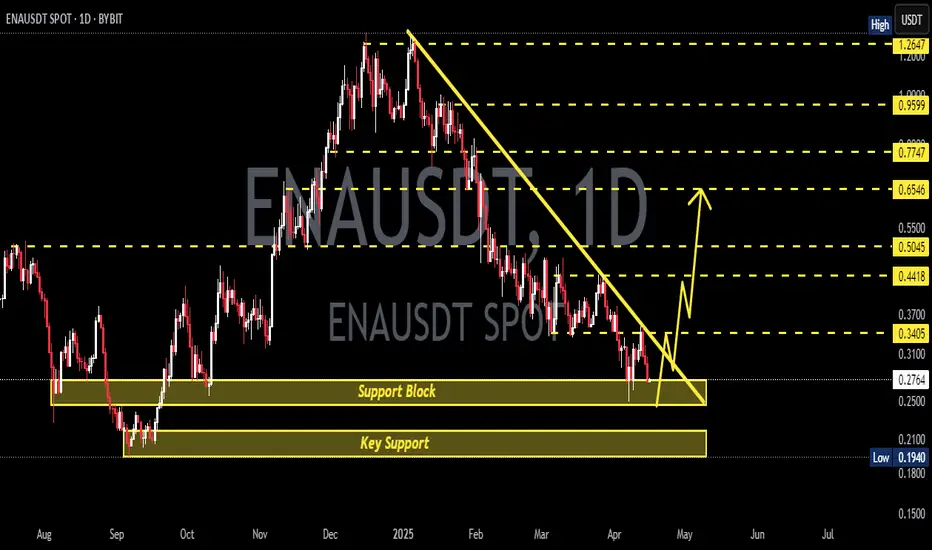
ENA/USDT Breakout Watch Signs of Reversal from a Key Demand Zone🔍 Full Technical Analysis:
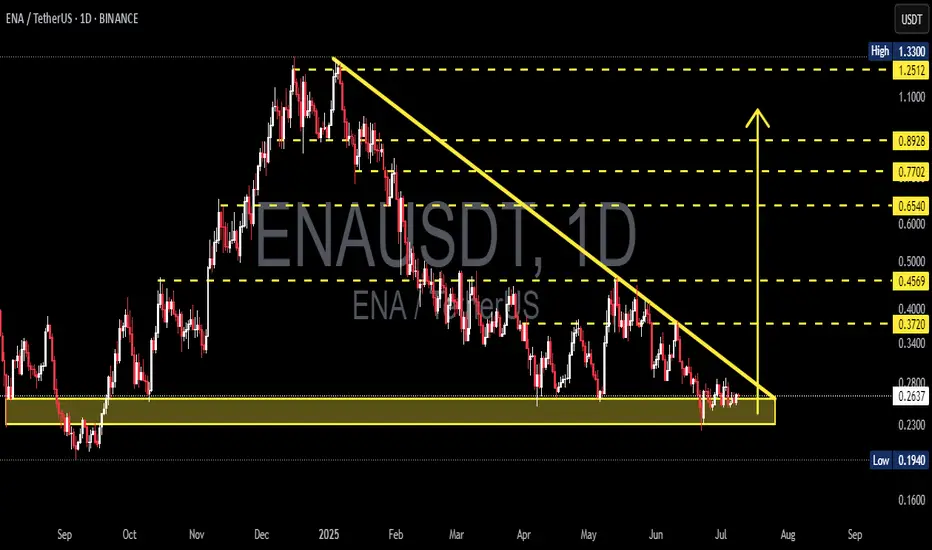
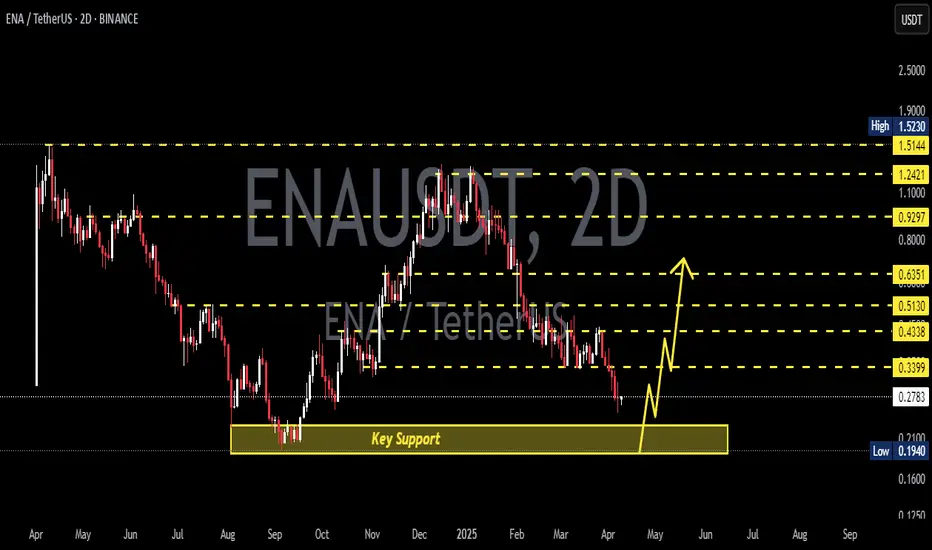
ENA/USDT has been forming a Descending Triangle pattern since the December 2024 high — a structure often seen in continuation moves, but here it may act as a potential reversal pattern, especially since price is consolidating around a strong historical demand zone.
The price is hovering within a key support area between $0.1940–$0.2624, which has repeatedly held against bearish pressure. Recent candles are showing signs of accumulation, indicating possible base formation before a breakout.
✅ Bullish Scenario (Breakout Setup):
If the price successfully:
1. Breaks above the descending trendline (yellow line), and
2. Confirms with a breakout above the $0.28–$0.30 zone with strong volume,
We could see a powerful bullish reversal with the following upside targets:
📈 Target 1: $0.3720
📈 Target 2: $0.4569 – breakout structure confirmation
📈 Target 3: $0.6540 – prior resistance zone
📈 Target 4: $0.7702
📈 Target 5: $0.8928
💥 Extended Targets: $1.2512 – $1.3300 (Major High from December 2024)
🚨 A clean breakout from this setup may trigger major FOMO and offer multi-level swing trading opportunities.
❌ Bearish Scenario (Breakdown Risk):
If the downtrend continues and:
The price fails to break above the trendline, and
Breaks below $0.1940, which is the historical low support,
Then the door opens for further downside towards: 🔻 Bearish Target: $0.1600 or lower
⚠️ A confirmed breakdown below this key zone would suggest trend continuation and weakness in buyer interest.
🧠 Strategic Summary:
Strong Demand Zone + Historical Support suggest high probability of trend reversal.
Descending Triangle offers a textbook breakout opportunity with favorable risk-reward.
High RR potential makes this setup ideal for swing traders and mid-term investors.
💡 Success tip: Wait for breakout confirmation and volume spike before entering.
#ENAUSDT #CryptoBreakout #DescendingTriangle #BullishReversal #AltcoinSetup #CryptoTrading #SwingTrade #TechnicalAnalysis #ChartPatterns #SupportAndResistance
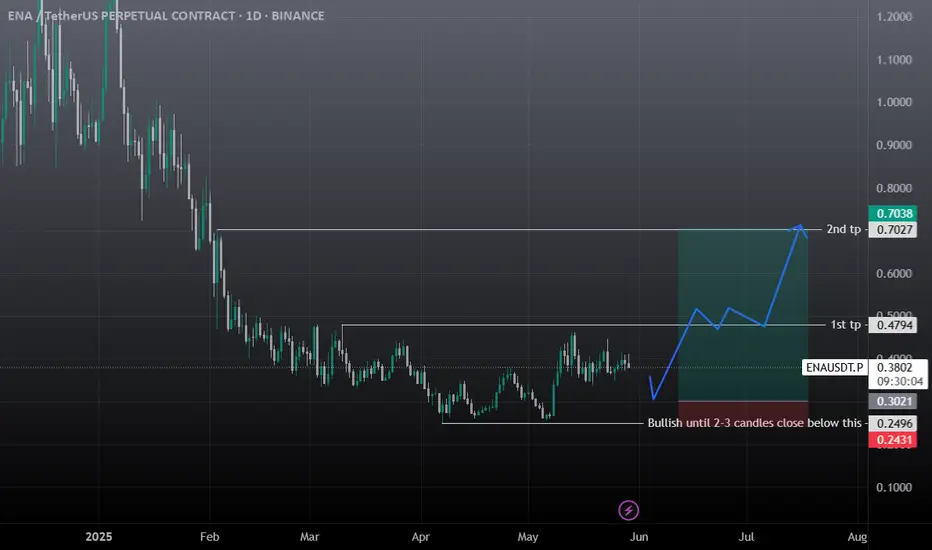
ENA Long / Buy Swing SetupENA Looking Good here, daily closing above 1st tp guaranteed tp 2. Ena can be the next SUI, Ondo. Below 0.31$ buying is a good choice and hold till 1st and then 2nd tp. While for the long term investors it has the potential to hit 2-3$ mark.
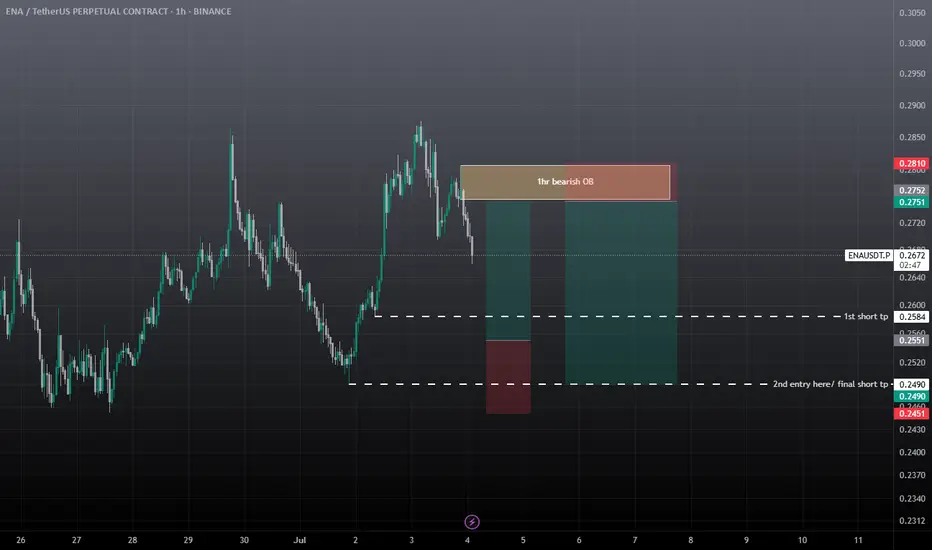
ENA SCALP & Intraday Setup Both Long & Short SetupWait for the entries to be filled first. If short entry achieved first then go for the short, if long entry achieved first then go for the long, in both cases must use SL, cause it's consolidating in a range, any side impulse move is expected from ena.
ENAUSDT 1D Analysis ENA ~ 1D Analysis
#ENA Buy back gradually from here if you still have confidence in this coin with a short term target of at least 15%+ from here.
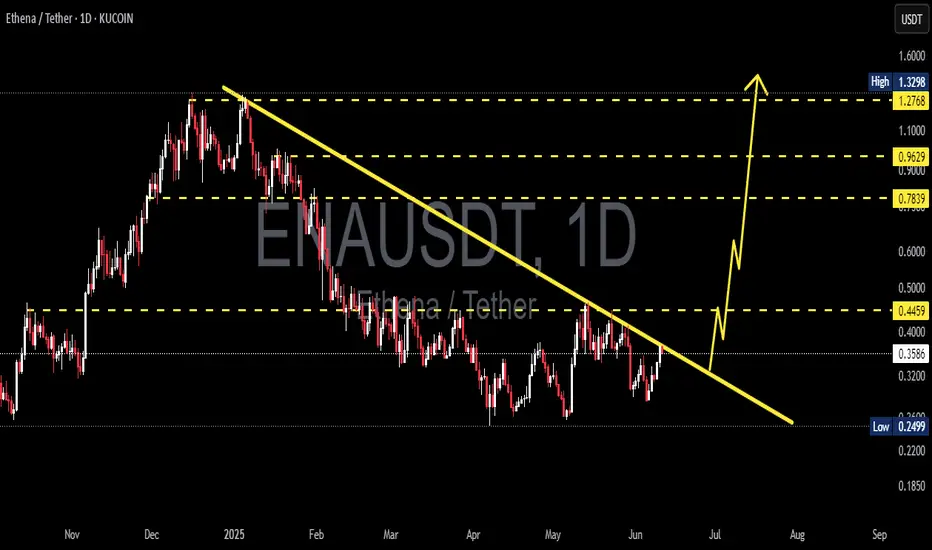
ENAUSDT 1D Analysis ENA ~ 1D Analysis
#ENA Buy after successfully breaking this resistance line with a short term target of at least 15%+, Long term target $1.3
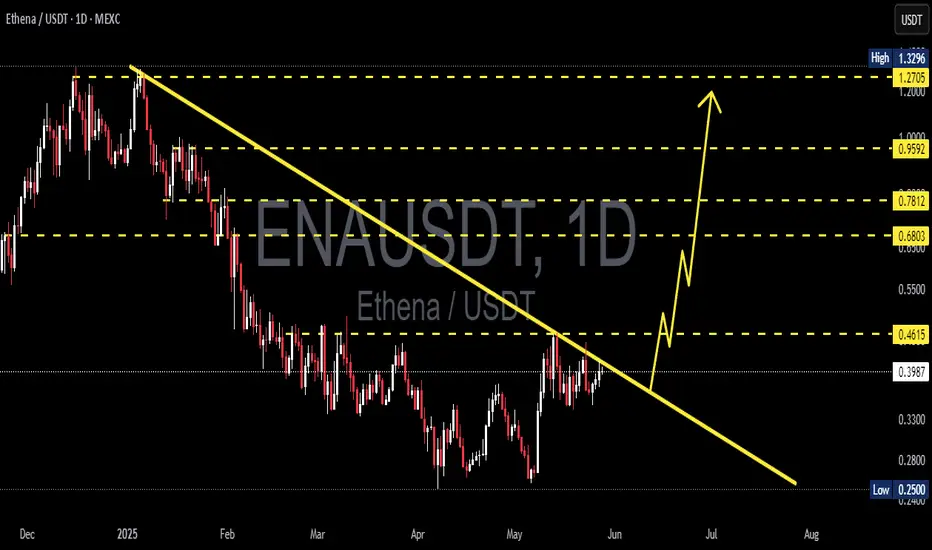
ENAUSDT 1D AnalysisENA ~ 1D Analysis
#ENA Buy after successfully breaking through this resistance line with a short-term target of at least 15%++ and a long-term target of $1.33
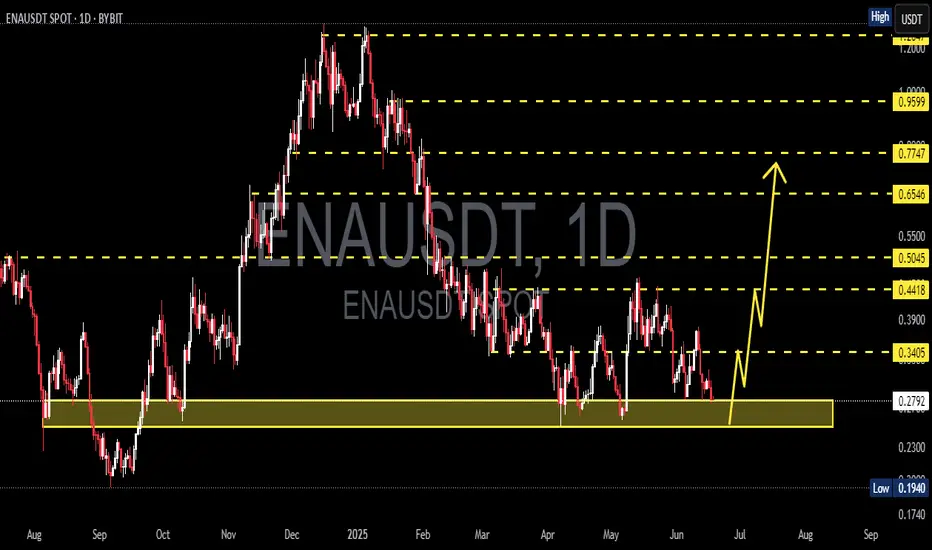
ENAUSDT 1DENA ~ 1D Analysis
#ENA The main support that you might be able to consider to start buying back from here with a short -term target of at least 10%+ from here.
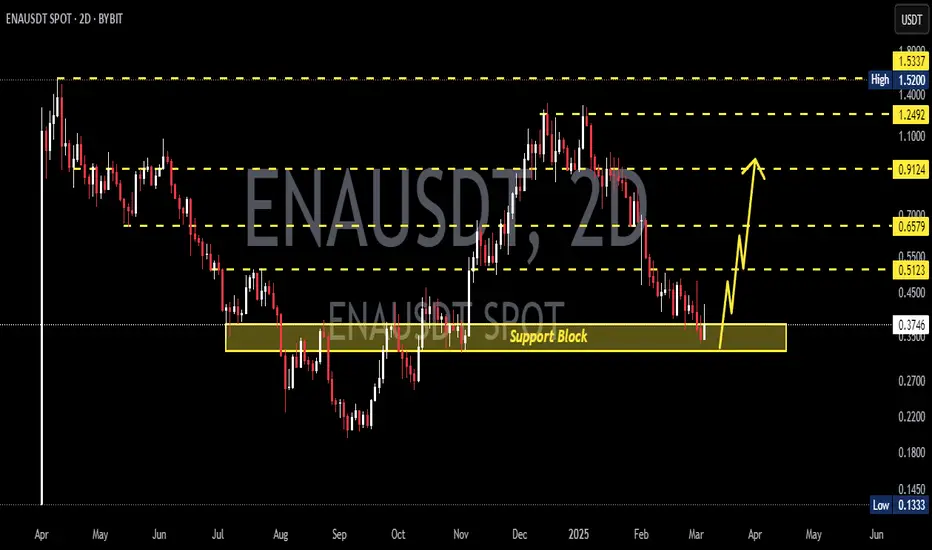
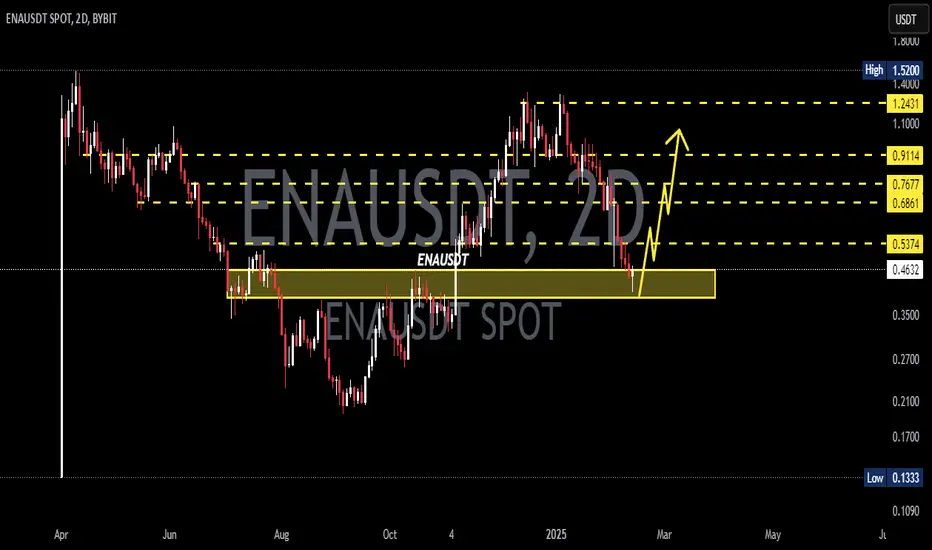
ENAUSDT 2DENA ~ 2D Analysis
#ENA Buy gradually after re -testing this support with a short -term target of at least 15%+ from here.
ENAUSDT 2DENA ~ 2D Analysis
#ENA Buy gradually from here if you still have a Conviction on this Coin with a minimum target of 20%+.
ENAUSDT 1H LONG (All Tsrgets Done)ENA LONG performed excellently according to all expectations and met all target marks from the provided review
Congratulations to everyone who took part in this position.
Basic review:
Update:
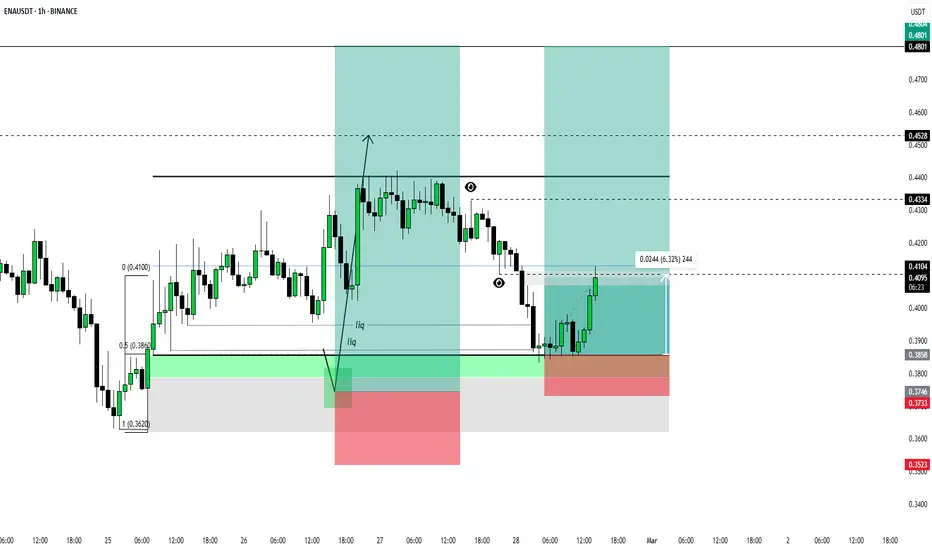
ENAUSDT 1H LONG (UPdate/Results)Due to the arrival of new variables from the market , key targets and entry were be changed. A similar situation was carried out on the LTC coin (in the previous review)
The price delivery range reached the daily POI and was maintained due to large limit purchases. A long position was opened from this range with the target at the CHoCH level
The position from the main review becomes no longer relevant:
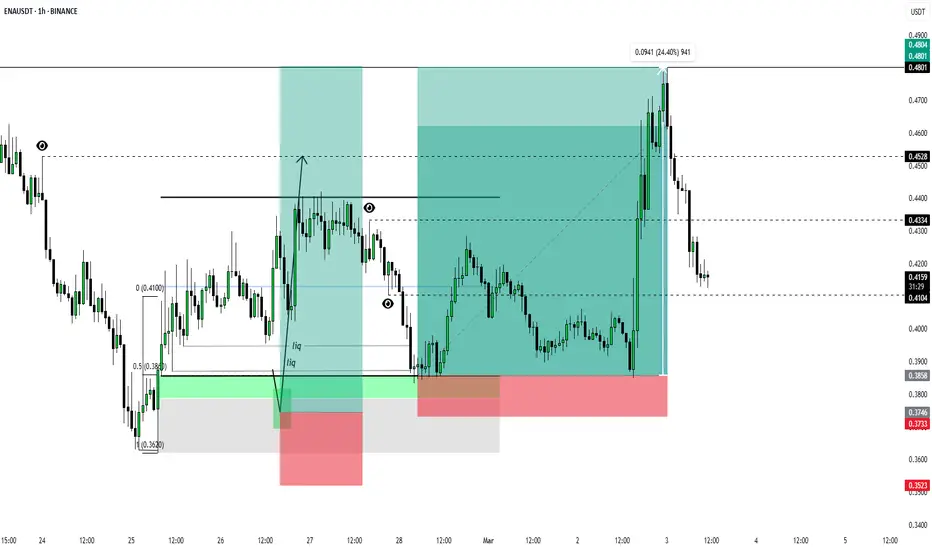
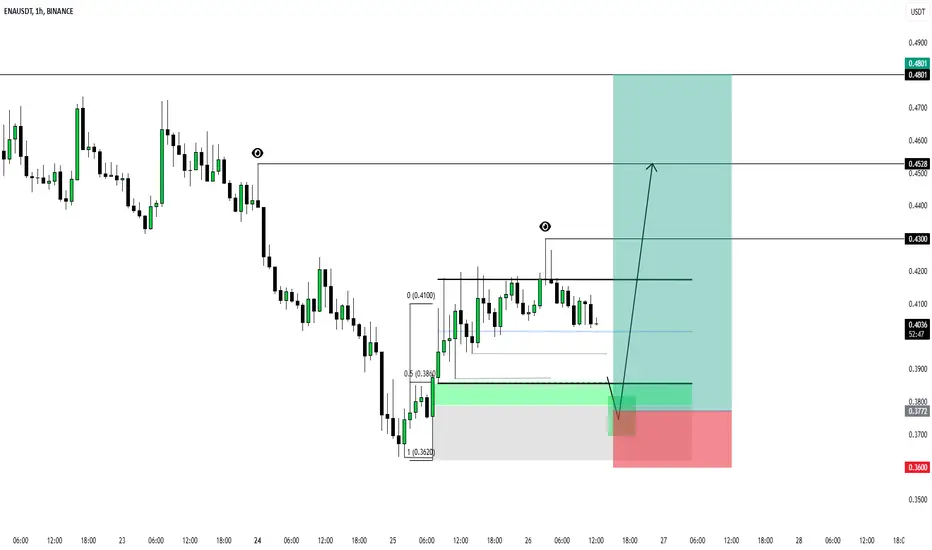
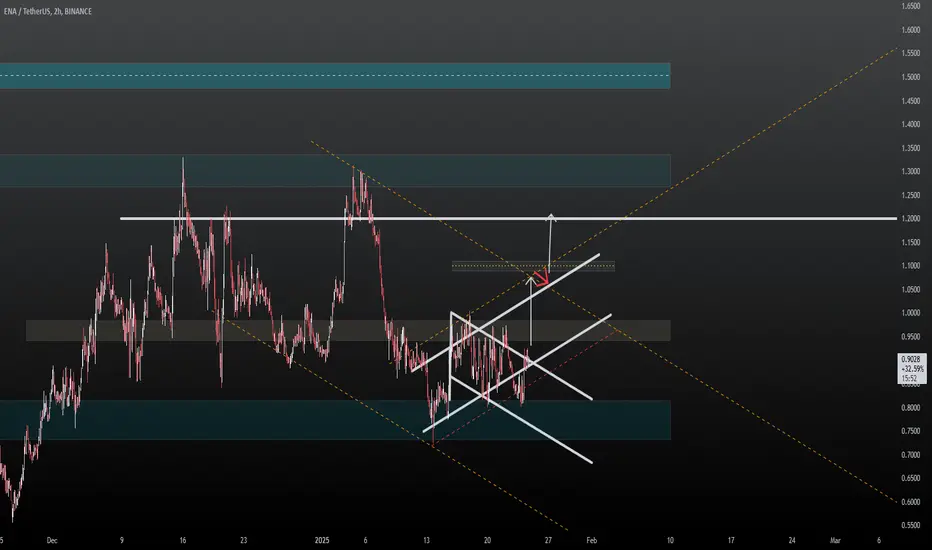
ENAUSDT 1H LONGENA looks cheerful and even very good. Taking into account the situation on the cryptocurrency, this trading instrument remains positive, both fundamental and market.
Rebalancing FGV and retest OB (bullish inefficiency) can create good conditions for finding a long setup.
An example of work is shown on the trading chart
Targets:
- $0.4300
- $0.4528
- $0.4801
Risk management - 1% on stop order
ENAUSDT 2DENA ~ 2D Analysis
#ENA If you still have a Conviction on this Coin, Maybe this support you can consider to start buying back with a minimum target of 15%+.
ENA/USDT - Potential Breakout in Long-Term DowntrendHello traders!
Let's take a look at the ENA/USDT price chart. As you can observe, the price has been locked in a long-term downtrend , contained within a descending macro channel .
Recent Price Action:
Over the past 24 hours, ENA has shown signs of a potential reversal. The price has entered a mini-uptrend channel and is currently approaching the upper boundary (ceiling) of the larger, descending macro channel. This creates the possibility of a breakout from the long-term downtrend.
Potential Breakout Scenario:
Given the potential increase in altcoin trading volume, I believe there's a strong likelihood that ENA could break through the macro channel's resistance level, located around $1.060 . If this breakout occurs, I anticipate a continued upward movement towards the following targets:
First targets:
Target 1: $0.9875
Target 2: $1.0500
Then:
Target 1: $1.20
Target 2: $1.35
Target 3: $1.52
mportant Note on Price Correction:
It's crucial to acknowledge that after a potential breakout above the macro channel's ceiling, a price correction is likely to follow. This is a normal market behavior after a significant upward move and should be anticipated.
Disclaimer:
This analysis represents my personal perspective and should not be considered financial advice. The cryptocurrency market is inherently volatile, and past performance is not a guarantee of future results. Always conduct your own research and manage your risk accordingly before making any trading decisions.
Good luck with your trades!
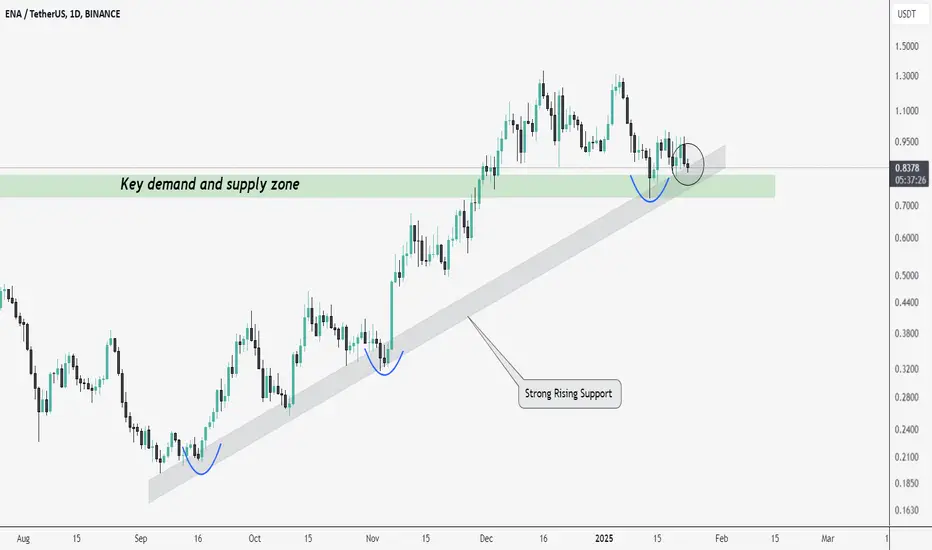
ENA Holding Key Support: Ready for the Next Move?ENA/USDT is in a strong uptrend, consistently forming higher highs and higher lows. The price is currently trading above a key support zone, which aligns with the strong rising trendline.
A bounce from the current levels could lead to a potential upside move, especially after a period of accumulation.
DYOR, NFA
ENAUSDT — Double Top Breakdown: Is a Bigger Drop Coming?Yello, Paradisers! Have you spotted the double top pattern on #ENAUSDT? Let’s break it all down clearly.
💎#ENA is showing a double top breakout, which is a strong bearish signal. The price recently broke below the support neckline and is now retesting that same level, which has turned into a resistance zone around $0.85 to $0.91. This area is key. If the price gets rejected here, it’s likely to continue its downward move toward the next support at $0.68. There’s even a chance it could drop lower into a stronger support zone if the selling pressure increases.
💎However, if ENA manages to reclaim this resistance zone, the price could push higher and target the supply zone between $1 and $1.08. In this case, it would grab liquidity before continuing its downward trend. Keep in mind that this move wouldn’t necessarily signal a full reversal — it could just be a temporary bounce.
💎The key level to watch for bearish invalidation is $1.08. If we see a daily close above $1.08, it would suggest that the bearish structure has broken and the price could shift back into a bullish trend.
Remember, consistency is what separates successful traders from the rest. Stay focused, Paradisers.
MyCryptoParadise
iFeel the success🌴
