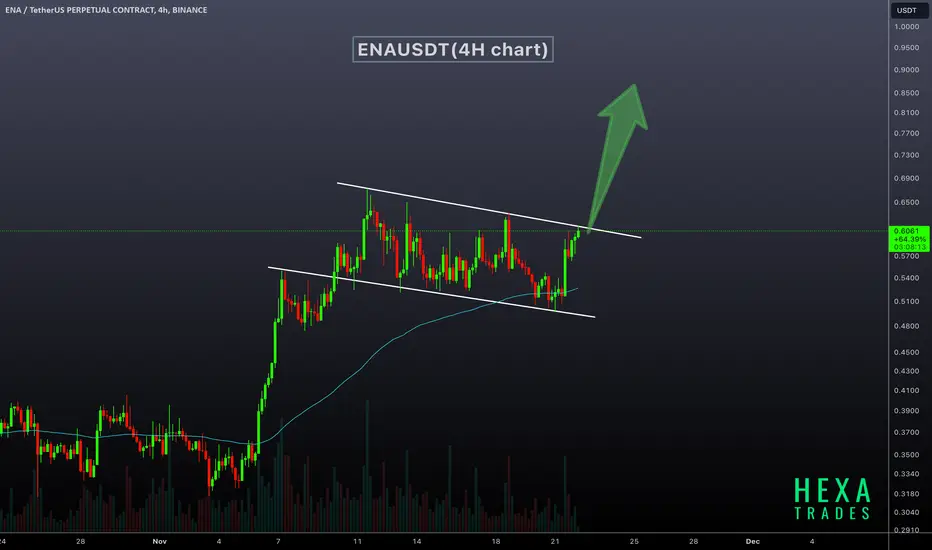
ENAUSDT Bullish Flag!ENAUSDT Technical analysis update
ENAUSDT is trading within a bullish flag pattern on the 4-hour chart, with the 100 EMA providing support at the flag's bottom. Once the price breaks above the flag's resistance, a bullish move of 50-100% can be anticipated in ENA.
Buy After breakout confirmed in 4H chart
Target: 50%-100%
Enausdtidea
ENAUSDTGood Luck >>
• Warning •
Any deal I share does not mean that I am forcing you to enter into it, you enter in with your full risk, because I'll not gain any profits with you in the end.
The risk management of the position must comply with the stop loss.
(I am not sharing financial or investment advice, you should do your own research for your money.)

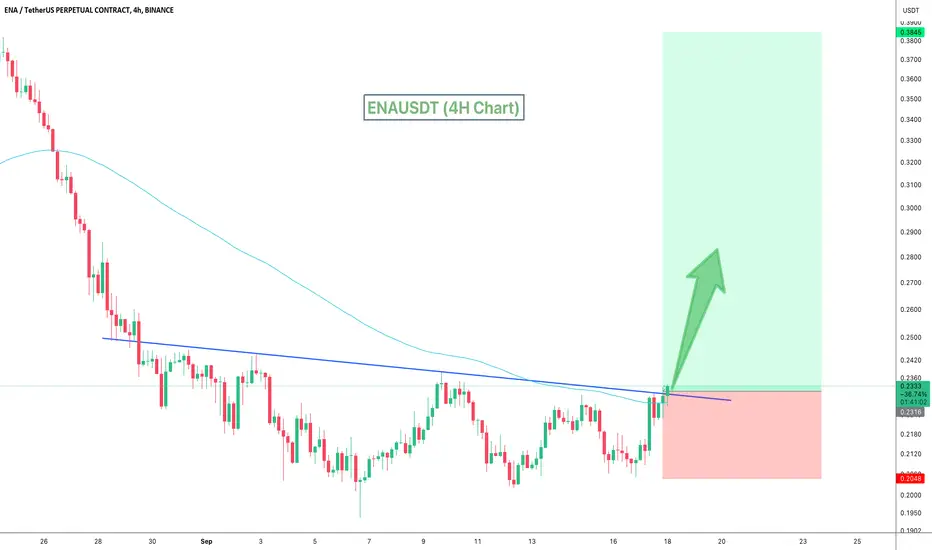
ENAUSDT Resistance Breakout!ENAUSDt technical analysis update
ENA is breaking the resistance trendline after 20 days of consolidation on the 4H chart. We can expect a strong bullish move from the current level, as the price is trading above the 100 EMA.
Regards
Hexa
#ENA/USDT#ENA
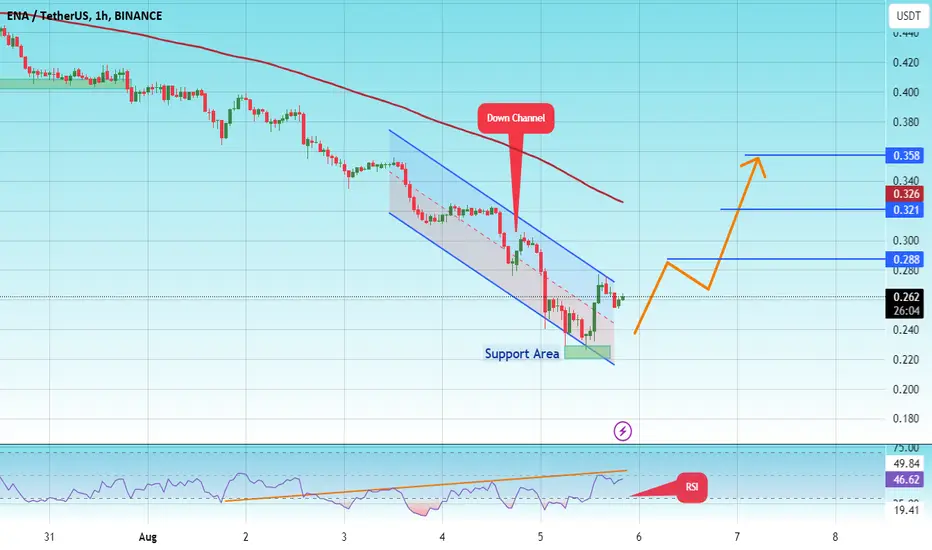
The price is moving in a descending channel on the 1-hour frame and is about to break upwards
We have a trend to stabilize above the 100 moving average
We have an upward trend on the RSI indicator
We have a major support area in green at a price of 0.220
Entry price 0.240
First target 0.288
Second target 0.320
Third target 0.358
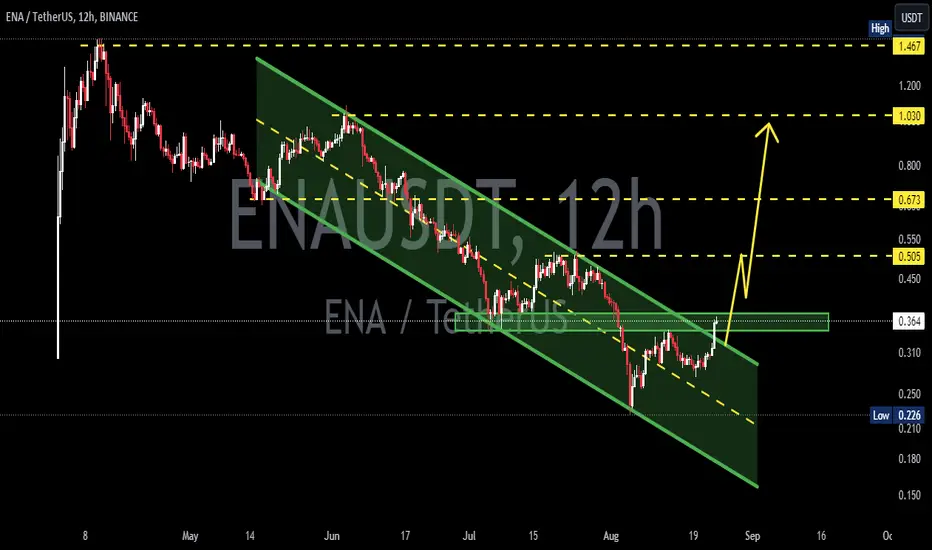
ENAUSDTENA ~ 12H
#ENA Successfully broke through the resistance of this descending pattern.
Buy in stages. bulls will continue to push the price as long as it is above this resistance.
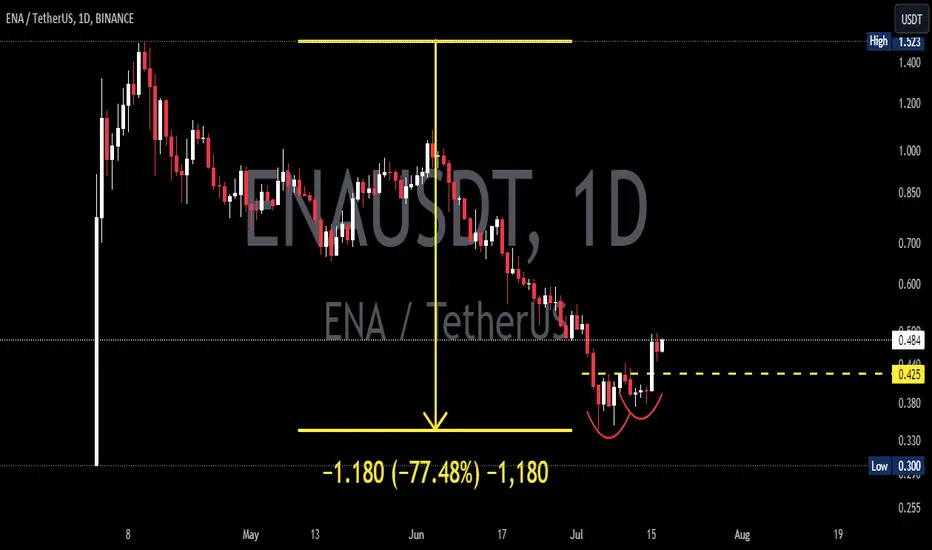
ENAUSDT 1DENA ~ 1D
#ENA Down -77%+ from its highest peak. this is a very good Token. we will start accumulating it from now on.