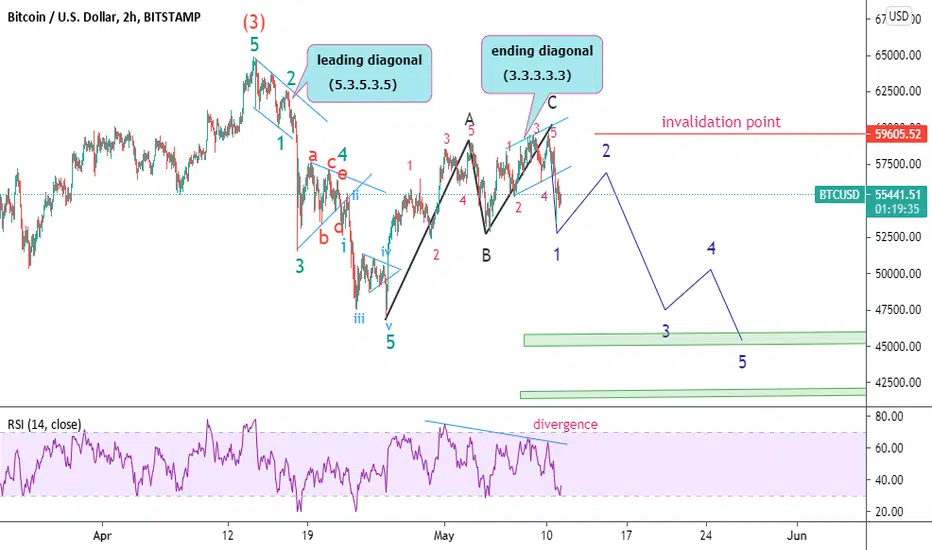
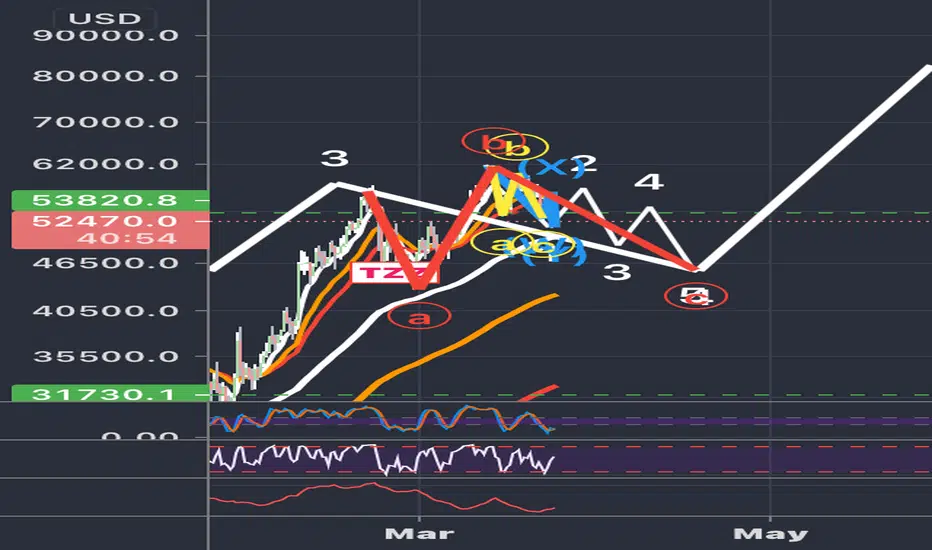
again BTC ganna fallMy previous analysis about BTC exactly happened. ABC has completed and its ready to finish the zigzag .
There is slight possibility that ABC hasn't finished and it might rise above the invalidation point so trade with money management and put your ST above invalidation point.
BE AWARE If BTC falls, most of the altcoins will fall too.
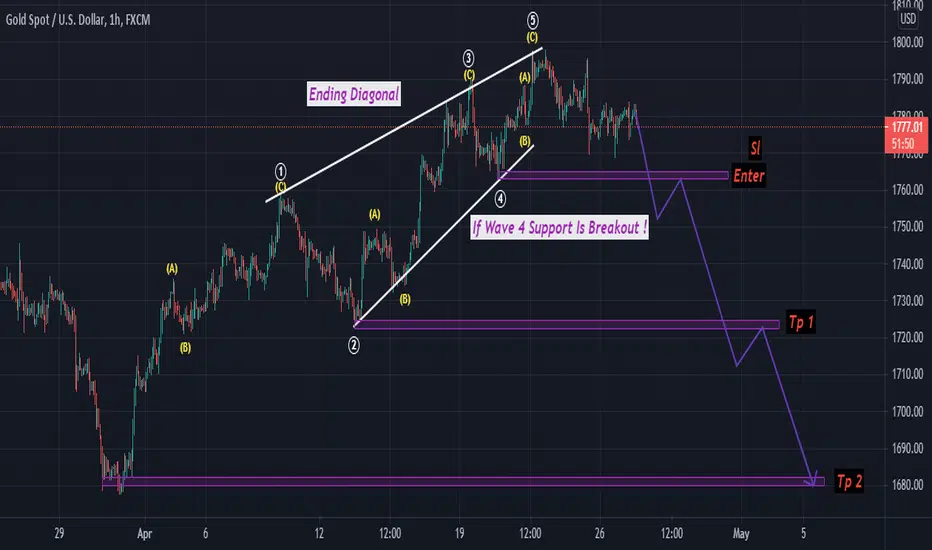
Ending Diagonal
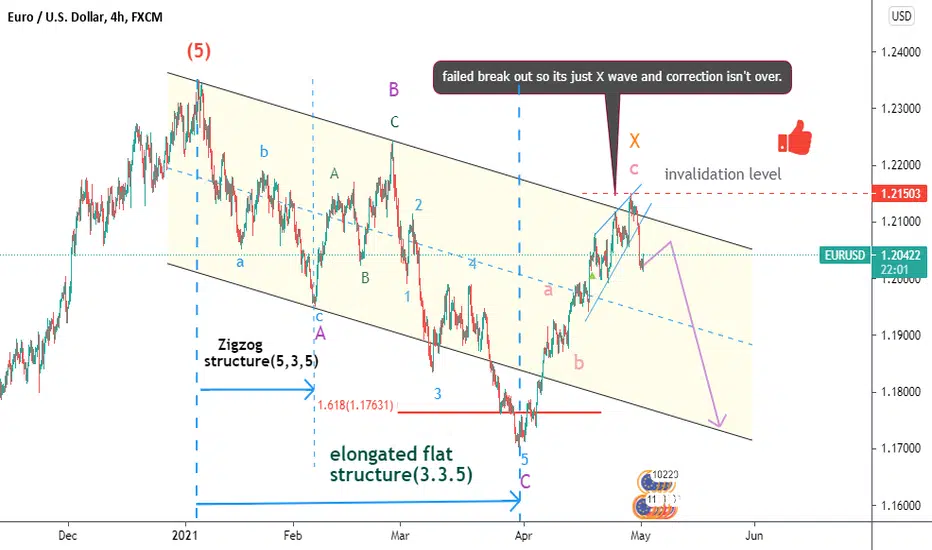
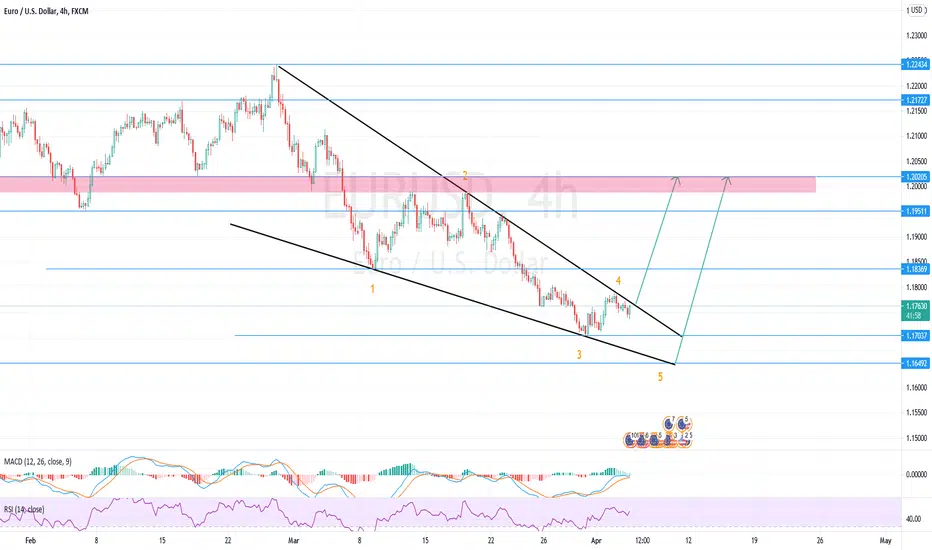
EURUSD, correction goes on !!Hi every body.
My previous analysis about EURUSD had some flaws so i made it right. So far a Flat pattern has completed, wave C retraced more than 161% wave B so its a Elongated Flat. Then a ABC pattern couldn't break the flat's channel therefore it wasn't an impulse and that count as a X wave.
Elongated flats are also common in triangles but i don't think that's going to happen. After this X wave we have another correction and it might be a double Flat or Zigzag or even a triangle and i will update as soon as i found out what it is; but before that comment what correction pattern do you think we'll have ??
For sure it will fall more. You can open a short term sell position and put your ST above the X wave and TP will be near at the bottom of the channel. Everything else is very clear in the chart.
Give it thumbs up if like this analysis and feel free to ask me question.
Ethereum prints another ATH!Congratulation to all eth holders! Another ATH has been reached!
However, the ATH has greeted us with an ending diagonal which impliess that we could see a pullback from this level.
Now in saying that, its nothing to be concerned about.
This means to me that we have more buying opportunities on the dip.
We could for a retest of the EMAs or an OS condition on the RSI for confirmed entry

ABC Correction is still in progress!Careful about the Elliot waves!
You can see how perfectly these Elliot waves and Fib levels rules the market ALMOST TO THE DOLLAR ACCURACY!
BTC is trying to make B wave right now and the ABC correction has not been completed yet.
A healthy market needs to correct itself otherwise we can not expect higher prices.

EURUSD ending diagonal triangle wave (c) of (a)(b)(c) - updatewave V of ending diagonal of (C) - should develop in 3 subwaves
target 1.21104-1.2129 area
ALT: ((1))-((2))

EURUSD ending diagonal triangle wave (c) of (a)(b)(c)EURUSD ending diagonal triangle wave (c) of (a)(b)(c) correction
possible target 1.2094 wave (a) - (c) equality
ALT cont wave (V) of impulsive wave ((1))

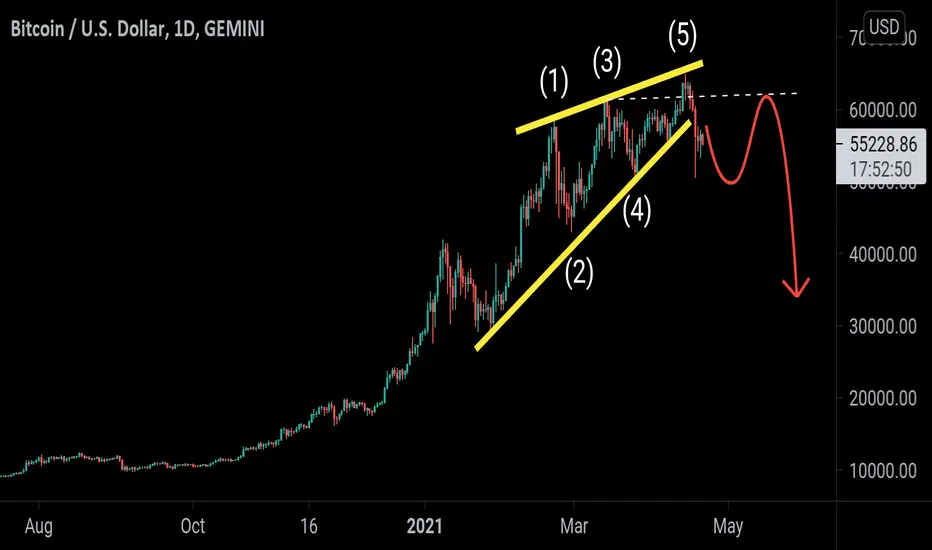
Ending diagonal Ending diagonal is formed at the top of bull market, which leads to sudden trend reversal aka crash.
Is this end of bull market?
is Crash coming?
This chart pattern has successfully predicted market cash many times.
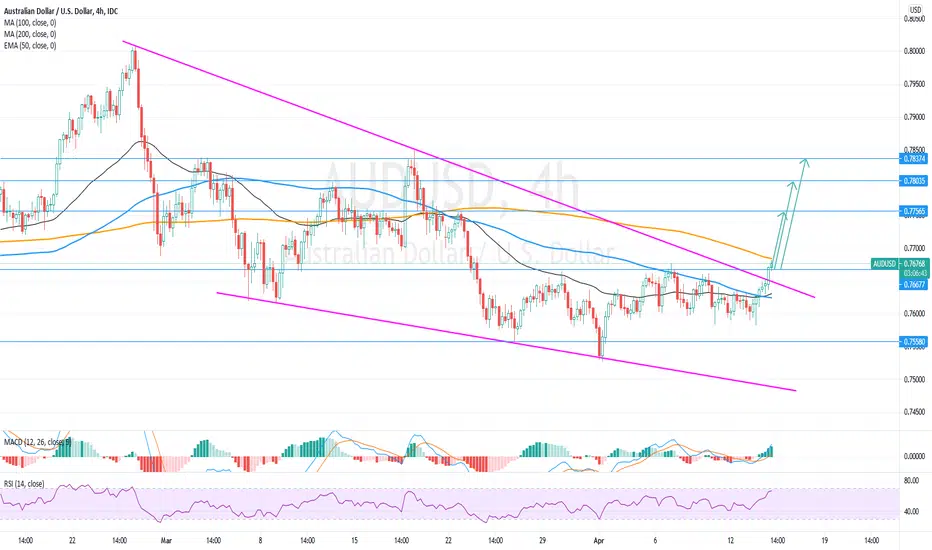
$AUDUSD - Breakout from the ending diagonalHi guys! 👋🏻
🔔 Breakout from the ending diagonal (wedge) is confirmed, AUD/USD remains above the resisance of 0.76670, which is a bullish continuation sign for the pair. Although might slightly correct to retest the upper edge of the pattern as support, so keep that in mind.
🔔 The US Annual inflation rate in March exposed 2.6% which is far beyond the FED’s desired 2%. Hence, investors worry that the FED may reconsider the interest rates sooner than expected.
🔔 Australian Consumer sentiment index in April surged to 6.2% (previous 2.6%) as consumers tend to show confidence in the economic growth of Australia.
🔔 The US Inflation data once again beat expectations and brings anxiety to the market, slacking the US Dollar index. DXY lost 0.28% yesterday and is down 0.12% today, while commodities like gold and silver are looking to rally. The Australian Dollar which is mainly correlated to Gold is on the main spot light.
✊🏻 Good luck with your trades! ✊🏻
If you like the idea hit the 👍🏻 button, follow me for more ideas.
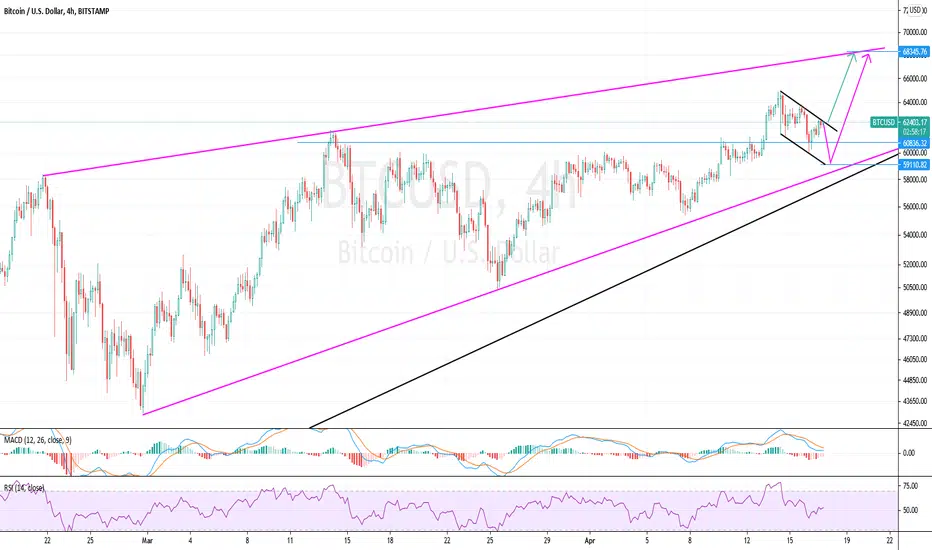
$BTCUSD - Bullish flag and Fibo levelsHi guys! 👋🏻
🔔 Bullish flag is being formed on BTC/USD
🔔 The Fibonacci divergence of the latest impulse replicates a support at 0.5 Fibo, however Bitcoin might as well drop to 0.618 Fibo to a massive support around $59K.
🔔 The retest of $59K would be a drastic uptrend signal as it not only holds the dynamic support of the bullish flag but a dyanic support of February 28.
🔔 Also there is a stable static support at 59K, hence sooner or later BTC will jump towards $68K and as the volumes increase, Bitcoin will proceed towards $70K and $78K. This ending diagonal formation might suggest a bearish reversal, a strong reversal but since March 2020 we have seen many times that BTC simply ignored the pattern and was rather bullish on the completion of this pattern than bearish.
✊🏻 Good luck with your trades! ✊🏻
If you like the idea hit the 👍🏻 button, follow me for more ideas.
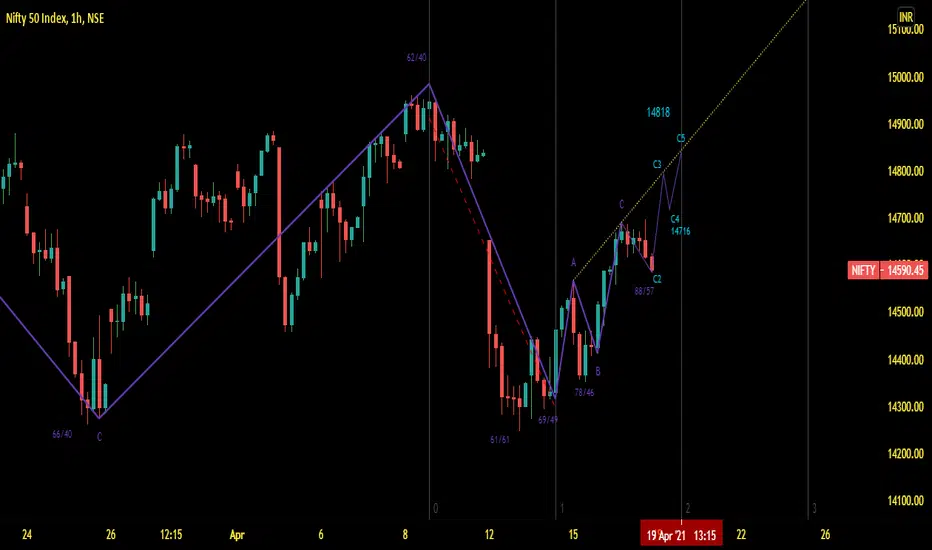
NIFTY ENDING DIAGONAL 14818Final leg of D wave (Flat) is ongoing in NIFTY ,expecting an ending diagonal to reach 14818 on 19th april.
wait for conformation because IF it overcome this number then more upside will be possible
$LUNAUSDT - Wait for a breakout and go longHello everyone!
Look forward to seeing Luna breakout from the ending diagonal and jump towards $20 and $23

$EURUSD - Following an ending diagonalHi guys! 👋🏻
🔔 Euro is following an ending diagonal pattern on an hourly chart
🔔 Both MACD and RSI indicators are signalling the short-term bullish continuation of the pair. Whilst the chart pattern analysis suggests that Euro is about to hike towards $1.1990 and $1.21300, closing above the $1.1800 is extremely important, otherwise it would be a retest of the support as resistance and Euro will resume the downtrend.
🔔 The pair is following the ending diagonal pattern on an hourly, which in general suggests the local trend reversal. According to the five-wave structure of this pattern, it is assumed that the Euro should have one more leg down before it can breakout from the dynamic resistance. However, if the Euro keeps the bullish pace of March 31, we could witness a breakout and an advancement towards $1.19900 and $1.120200 anytime soon.
🔔 Here is what it looks like on a Daily chart, to give more confidence to buyers.
✊🏻 Good luck with your trades! ✊🏻
If you like the idea hit the 👍🏻 button, follow me for more ideas.
MR. DIY hardware retail Chain Store. Waves Updated 12 April 21Mr. DIY price uptrend seem losing its momentum with squeezing price by forming ending diagonal pattern

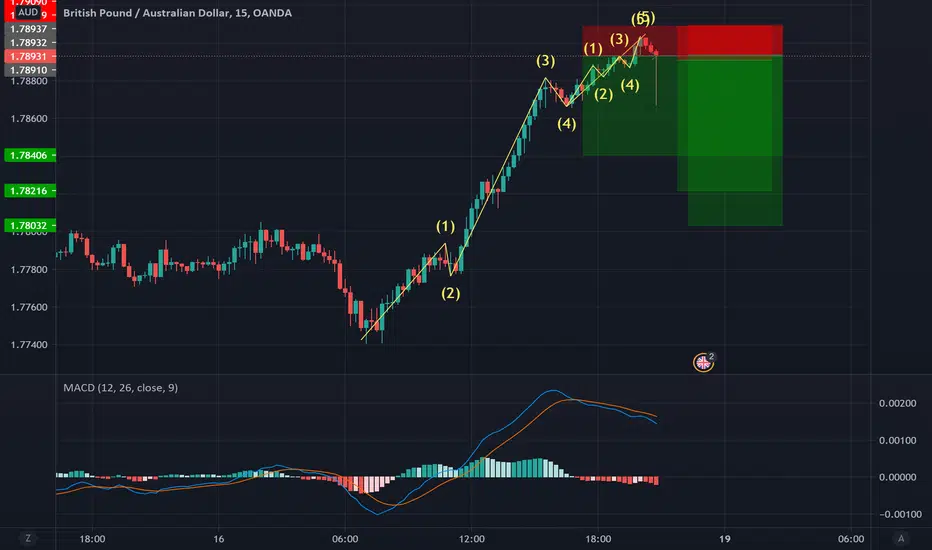
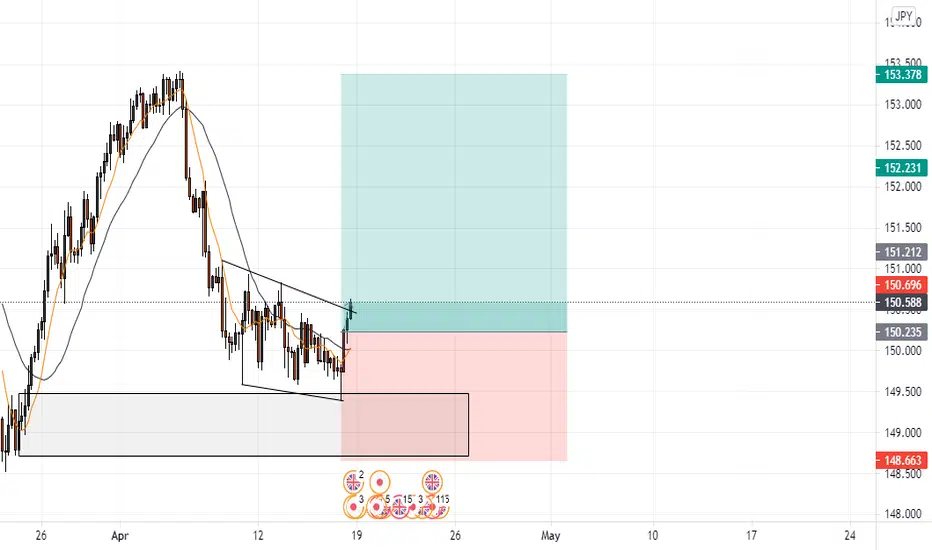
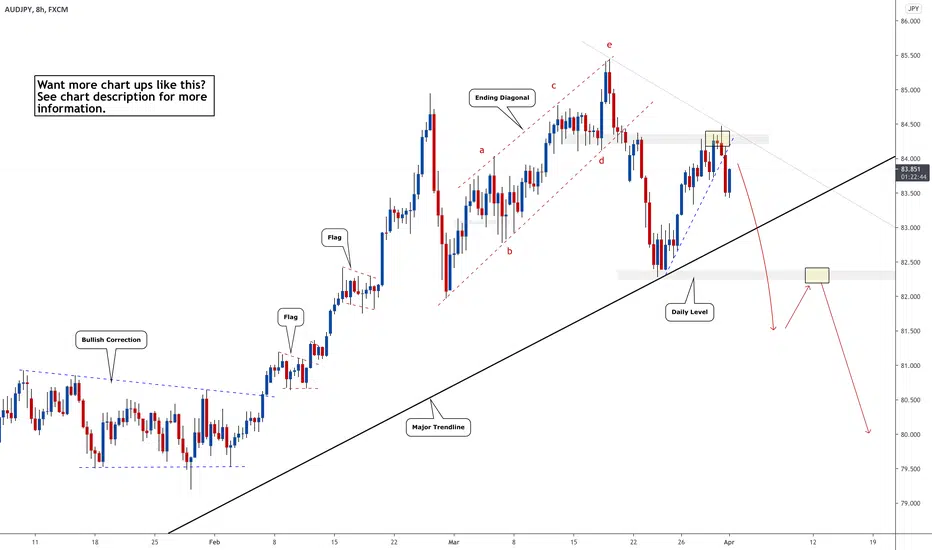
AUDJPY - MAJOR Reversal - DO NOT MISSWe are anticipating AUD weakness and JPY strength which is going to make this trade a really good trade! Safe entry indicated in chart. But you can get an entry soon by identifying bear flags on the smaller timeframe.
Goodluck and trade safe!
Ripple XRPUSD - Road to 100 USD! | Millennium IMPULSE Wave!- XRP is absolutely ready for a massive gains as the current never ending consolidation has finished successfully!
- As per my Elliott Wave count, I can really definitely see a brutal 5th Impulse wave to the upside starting in the immidiate short term!
- Do not forget to check my the most important analysis on BTC.D (Bitcoin dominance).
- XRP fell from 2. down to 7. place on Coinmarketcap in recent months.
- XRP is in my opinion the most hated coin on the cryptocurrency market (pump and dump).
- For expected duration of the trade, probability, stop loss, profit target, entry price and risk to reward ratio (RRR) - please check my signature below ↓
- 200 weekly moving average is rising, which is of course a positive sign!
- Make sure to have enough XRP in your wallet, as I do not recommend to use futures markets for this coin.
- If you want to see more of these ideas, hit "Like" & "Follow"!

Bitcoin’s Running Flat Ends With A Nasty C WaveLook out for the Ending Diagonal to form for C Wave of the extended flat. $45K remains the target.
Bitcoin BTCUSD - Elliott Wave UPDATE! + Rising WedgeBullish scenario for Bitcoin:
- This is my current bullish Elliott Wave count and as you can see, the price action is currently extremely bullish.
- RIsing wedge is generally a bearish pattern, so there is a chance for an ending fifth Elliott wave diagonal.
- Expected duration of the trade, probability, stop loss, profit target, entry price and risk to reward ratio (RRR) - For more information, please check my signature below ↓
- I am not expecting the price to go above the rising wedge, it is possible, but sounds unlikely and can be just a bull trap or liquidity provider for whales.
- The volume is decreasing and this trend should continue for next month.
- If you want to see more of these ideas, hit "Like" & "Follow"!

PLTR: Buy setup - watching for the b/oJust a follow up to my last post. It has broken out of the diagonal like structure. Technically if it is the end of the bigger correction, then we should see a run to the high. Look's like a good one to me. How's it look to you?

USDCAD - Ending Diagonal Scenario - LONGWe maybe seeing an ending diagonal pattern here with a double bottom reversal pattern, indicating towards a bullish breakout. Confirmation would be a break of the trendline and zone and a retest. Will be keeping a close eye on this pair this week to see if we can get an entry.
See links below for more set ups.
Trade Safe!
