Cardano ADAUSD - Elliott Wave + Rounding Bottom! +1200%!- Cardano is currently breaking out to new ALL TIME HIGHS!
- On the chart we can spot a Symmetrical triangle - The price is creating higher lows and lower highs.
- Also, the price is above the ALL TIME HIGH level from 2018, which is very bullish .
- We will experience an acceleration to the upside in a few days!
- Profit target is 0.618 FIB extension, which is around 30 USD - 1000%.
- Cardano made a huge rounding bottom or cup and handle on the weekly time frame.
- For expected duration of the trade, probability, stop loss, profit target, entry price and risk to reward ratio ( RRR ) - please check my signature below ↓
- Due to my Elliott wave count, we are currently at the 5th impulse elliott wave!
- If you want to see more of these ideas, hit "Like" & "Follow"!
Ending Diagonal

Litecoin LTCUSD - 5000% gains + Road to 10 000 USD + Triangle- Litecoin - LTC - Rank #17 - Coin
- If we take a look at the chart, we can definitely spot an ascending triangle.
- We have very important double top resistance right at the ALL TIME HIGH level.
- Litecoin is prepared for a huge pump!
- We need litecoin, because bitcoin transactions are very expensive.
- That's why everybody uses litecoin at this moment. (Paypal, ATM machines etc..)
- RSI is prepared for a next pump!
- 1:1 FIB extension = 1750 USD Profit target.
- For expected duration of the trade, probability, stop loss, profit target, entry price and risk to reward ratio ( RRR ) - please check my signature below ↓
- If you want to see more of these ideas, hit "Like" & "Follow"!

Fetch.AI FETUSDT - Elliott Wave + Ascending parallel channel!- Fetch.ai - FET - Rank #133 TOKEN.
- As per my Elliott Wave count, we are currently in the 5th wave, which can be huge!
- Also, we have an Ascending parallel channel with total 7 touches.
- FET Is prepared for another pump very soon!
- For expected duration of the trade, probability, stop loss, profit target, entry price and risk to reward ratio ( RRR ) - please check my signature below ↓
- If you want to see more of these ideas, hit "Like" & "Follow"!

BitTorrent BTTUSDT - Bull flag- BitTorrent - BTT - Rank #61 - Token
- BitTorrent is the most popular torrent client (together with uTorrent).
- On the chart we can see a bullish flag , which is currently breaking out!
- For expected duration of the trade, probability, stop loss, profit target, entry price and risk to reward ratio ( RRR ) - please check my signature below ↓
- The price retested the ALL TIME HIGH level, we can clearly see a sign of interest at this point.
- 1600% gains is possible in next months, so be prepared!
- If you want to see more of these ideas, hit "Like" & "Follow"!

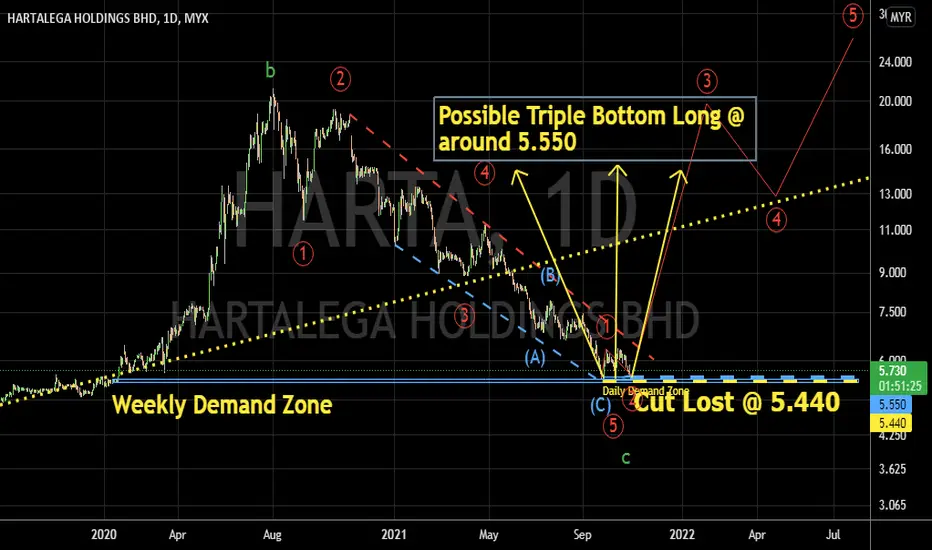
HARTA may done long term correction. 29/Oct/21HARTA may completed its running flat pattern abc (green).. at RM5.440 where wave c (Green) price stalled at :- 1) Lower Trend Line ( Cyan/Light Blue Dashed) of wedge pattern/Ending Diagonal Pattern 2) Major Weekly Demand Zone (Cyan/Light Blue Slim Rectangle Box ).. Daily Chart might form a triple bottom where price will come close to RM5.550 before resuming up trend...Cut Lost for the long will be at RM5.440.. Target Profit is above RM20.00
ISSP , Is this the end of its bullish cycle?The recent All Time High (ATH) just hit the 1.618, and then followed by bearish engulfing. Additionally, there is a potential ending diagonal pattern. TP 2 & TP3 are for overextended scenarios which is low probability if we're considering the current market condition. If ISSP can break out from 394, we can expect potential upside target around 436 - 526. ISSP technical chart represents neutral with caution market condition.
DISCLAIMER ON
This analysis is not financial advice. Please note that you are responsible for your own investments. This chart only represents my opinion and view about the stock market in general and may be used only for educational purposes.

Dash DASHUSDT - Ascending channel + new ATH soon!- Dash DASH - Rank #65 on coinmarketcap
- On the weekly chart we can spot a huge ascending channel
- The price respects a support trendline
- Profit target is 1:1 extension or top of the channel
- For expected duration of the trade, probability, stop loss, profit target, entry price and risk to reward ratio ( RRR ) - please check my signature below ↓
- If you want to see more of these ideas, hit "Like" & "Follow"!

EOS EOSUSD - Rounding bottom + Next Target- This is my analysis for EOS , a lot of poepole asking about why EOS is not pumping.
- So be careful and consider if the EOS is a good choice or not, maybe it is too risky.
- On the chart we can see a rounding bottom or cap and handle formation, which is bullish .
- After a rectangle consolidaton, the price started with an Impulse Elliott wave .
- First target 1:1 / below all time high.
- RSI is ready and volume favors bulls.
- For expected duration of the trade, probability, stop loss, profit target, entry price and risk to reward ratio ( RRR ) - please check my signature below ↓
- If you want to see more of these ideas, hit "Like" & "Follow"!

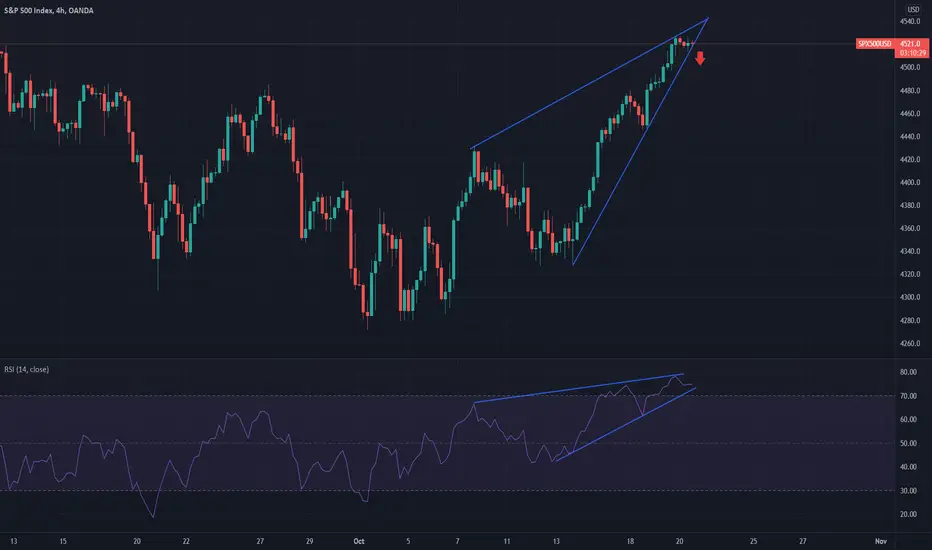
SPX500 correction be about happenAt this moment SPX is overbought, RSI shows a beautiful ending diagonal pattern. This price parabolic movement can't take long so correction is mandatory.
GOOD LUCK!
Ending DiagonalEnding diagonals are strong reversal patterns and in this case, price has tested a long term bearish trendline. Wait for price to break the marked zone before entry

Tron TRXUSD - Elliott wave + Massive channel!- On the chart we can see an incomplete Impulse Elliott Wawe (5th wave).
- Rounding bottom or cup and handle is also printing on the chart.
- Volume is very bullish and also RSI is prepared for another pump!
- Target is 1:1 fib trend-based extension + top of the ascending channel + 5th elliott wave
- For expected duration of the trade, probability, stop loss, profit target, entry price and risk to reward ratio ( RRR ) - please check my signature below ↓
- Huge bullish volume is also one of the positive signs!
- If you want to see more of these ideas, hit "Like" & "Follow"!

Ripple XRPUSD - Elliott Wave + Ascending channel- On the chart we can spot an Impulse Elliott Wave and ascending parallel channel!
- As you can see we are currently at the 5th wave to the upside, which can be huge!
- For expected duration of the trade, probability, stop loss, profit target, entry price and risk to reward ratio ( RRR ) - please check my signature below ↓
- The coin started this uptrend by the Head and Shoulders pattern.
- Target is top of the channel or 1:1 fib extension!
- New all time highs are near than you think.
- The volume is decreasing, which means, that a big explosive move is coming!
- If you want to see more of these ideas, hit "Like" & "Follow"!

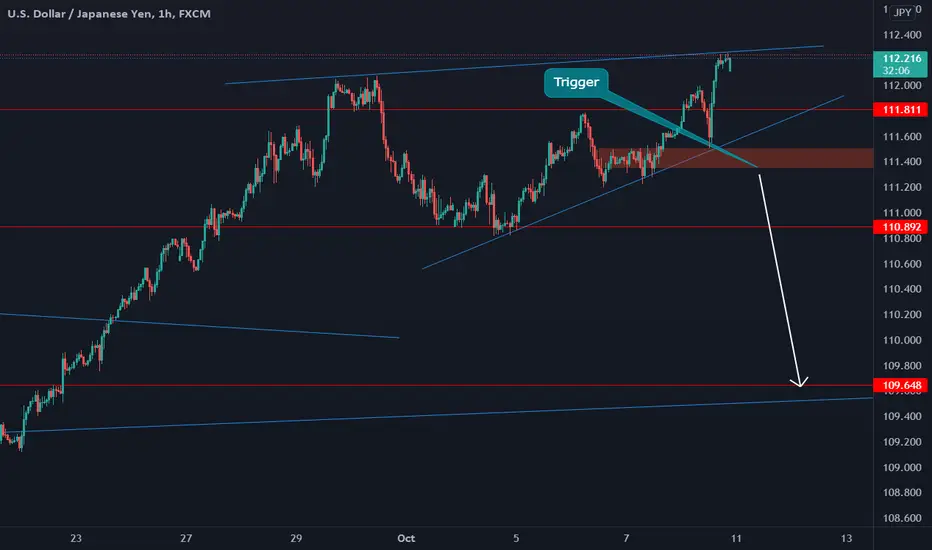
Ending diagonalEnding diagonals are strong reversal patterns and this one might possibly be one. Wait for price to break the trigger before entry
Ending DiagonalEnding diagonals are strong reversal patterns. Please wait for price to break the confirmation level before entering

0x ZRXUSDT - HUGE Rising wedge- ZRX is very bullish on the weekly macro scale.
- We have a rising wedge , that greatly holds support.
- Bullish volume is higher and RSI is prepared for a pump!
- Profit target 1:1 fib extension or top of the wedge
- Check my related idea about 0X vs BTC below!
- For expected duration of the trade, probability, stop loss, profit target, entry price and risk to reward ratio ( RRR ) - please check my signature below ↓
- If you want to see more of these ideas, hit "Like" & "Follow"!

Tron TRXUSD - Huge channel + Elliot Wave- On the chart we can see an incomplete Impulse Elliott Wawe (5th wave).
- Rounding bottom or cup and handle is also printing on the chart.
- Volume is very bullish and also RSI is prepared for another pump!
- Target is 1:1 fib trend-based extension + top of the ascending channel + 5th elliott wave
- For expected duration of the trade, probability, stop loss, profit target, entry price and risk to reward ratio ( RRR ) - please check my signature below ↓
- Huge bullish volume is also one of the positive signs!
- If you want to see more of these ideas, hit "Like" & "Follow"!

$EURUSD - Completion of the correctionHi guys! 👋🏻
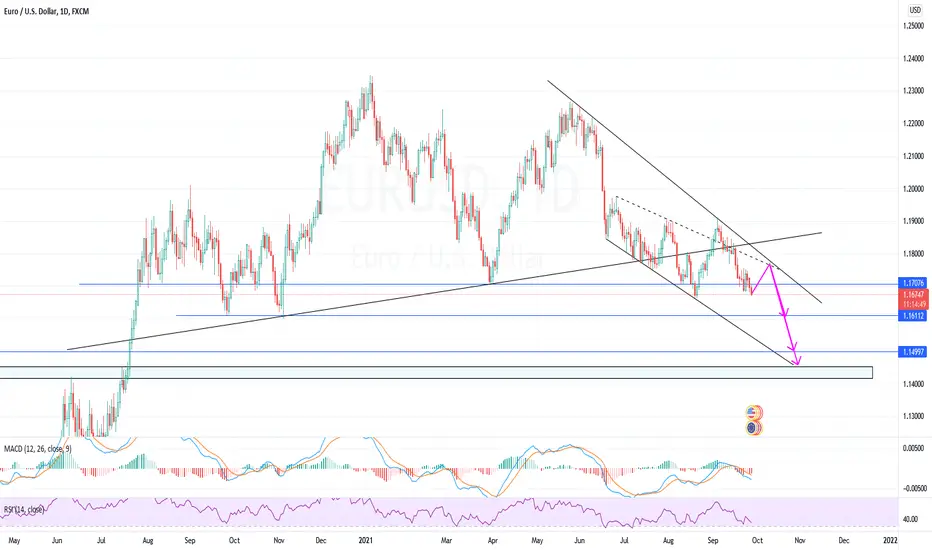
🔔 EUR/USD is traded inside a downtrend channel. The price action of June 25 has formed an expanding ending diagonal pattern, which is yet to complete its formation.
🔔 4H EUR/USD chart, whereas the RSI is near the oversold level, hence to balance the strength, EUR/USD might retest 1.17700 before it continues to proceed downwards to complete the correction.
🔔 Key support levels to watch herein are $1.16150, $1.15000 and an area between $1.14500 and $1.14200. It is important to note that MA100, MA200 and EMA50 are all above the priceline and act as a strong resistance, most importantly the EMA50 is right at $1.17700 which backs the strength of this resistance.
🔔 Last week, the EU and German economic data were mainly red colored as the actual data released was not the same or above the anticipated. This fact weakens the Euro before the US Dollar, as these data clearly state that the ECB economic projections are inaccurate. Last week’s EU and German PMI data were below the anticipated.
🔔 It is pretty much clear that the end of the correction is not yet confirmed and for the Euro to continue the uptrend the economic data from the EU has to follow the projections of the ECB and EUR/USD must close above the upper edge of the downtrend channel. Until then, EUR/USD is bearish.
✊🏻 Good luck with your trades! ✊🏻
If you like the idea hit the 👍🏻 button, follow me for more ideas.
RIpple XRP - Ascending channel- On the chart we can spot an Impulse Elliott Wave and ascending parallel channel!
- As you can see we are currently at the 5th wave to the upside, which can be huge!
- For expected duration of the trade, probability, stop loss, profit target, entry price and risk to reward ratio ( RRR ) - please check my signature below ↓
- The coin started this uptrend by the Head and Shoulders pattern.
- Target is top of the channel or 1:1 fib extension!
- New all time highs are near than you think.
- The volume is decreasing, which means, that a big explosive move is coming!
- If you want to see more of these ideas, hit "Like" & "Follow"!

Cardano ADAUSD - Rounding Bottom! + Elliott Wave- Cardano is currently breaking out to new ALL TIME HIGHS!
- On the chart we can spot a Symmetrical triangle - The price is creating higher lows and lower highs.
- Also, the price is above the ALL TIME HIGH level from 2018, which is very bullish .
- We will experience an acceleration to the upside in a few days!
- Profit target is 0.618 FIB extension, which is around 30 USD - 1000%.
- Cardano made a huge rounding bottom or cup and handle on the weekly time frame.
- For expected duration of the trade, probability, stop loss, profit target, entry price and risk to reward ratio ( RRR ) - please check my signature below ↓
- Due to my Elliott wave count, we are currently at the 5th impulse elliott wave!
- If you want to see more of these ideas, hit "Like" & "Follow"!

Avalanche AVAXUSDT - New ALL TIME HIGH! Very bullish coin!- Avalanche AVAX Rank #11 Coin on coinmarketcap.
- The price is above the All Time High level, which is of course very bullish.
- We have a huge parallel channel, can serve as a resistance on the top.
- For expected duration of the trade, probability, stop loss, profit target, entry price and risk to reward ratio (RRR) - please check my signature below ↓
- If you want to see more of these ideas, hit "Like" & "Follow"!

$CHZUSD - Ending diagonalHello everyone!
Ending diagonal spotted on CHZUSD.
Can enter long now with a low SL.

Link LINKUSD - Ascending channel + 100 USD next wave Link is very bullish on the weekly time frame.
- If you take a look at RSI we can see, that this oscillator is ready for another pump!
- Previous swing high acted as a support + bottom of the channel!
- Target is top of the channel or 0.618 FIB trend-based FIB.
- We can spot an ascending channel forming on the weekly timeframe .
- For expected duration of the trade, probability, stop loss, profit target, entry price and risk to reward ratio ( RRR ) - please check my signature below ↓
- If you want to see more of these ideas, hit "Like" & "Follow"!

Tron TRXUSD - Ascending channel + Elliott Wave- On the chart we can see an incomplete Impulse Elliott Wawe (5th wave).
- Rounding bottom or cup and handle is also printing on the chart.
- Volume is very bullish and also RSI is prepared for another pump!
- Target is 1:1 fib trend-based extension + top of the ascending channel + 5th elliott wave
- For expected duration of the trade, probability, stop loss, profit target, entry price and risk to reward ratio ( RRR ) - please check my signature below ↓
- Huge bullish volume is also one of the positive signs!
- If you want to see more of these ideas, hit "Like" & "Follow"!
