TomoChain TOMOUSDT - Impulse Elliott Wave + Ascending channel- TomoChain TOMO - Rank #277 on coinmarketcap.
- TOMO looks very strong on the weekly time frame.
- We can spot an ascending channel , which provides us with a good support/resistance .
- Due to my Elliott wave count, we are currently in the 5th wave.
- RSI is ready for another pump very soon!
- For expected duration of the trade, probability, stop loss, profit target, entry price and risk to reward ratio ( RRR ) - please check my signature below ↓
- If you want to see more of these ideas, hit "Like" & "Follow"!
Ending Diagonal

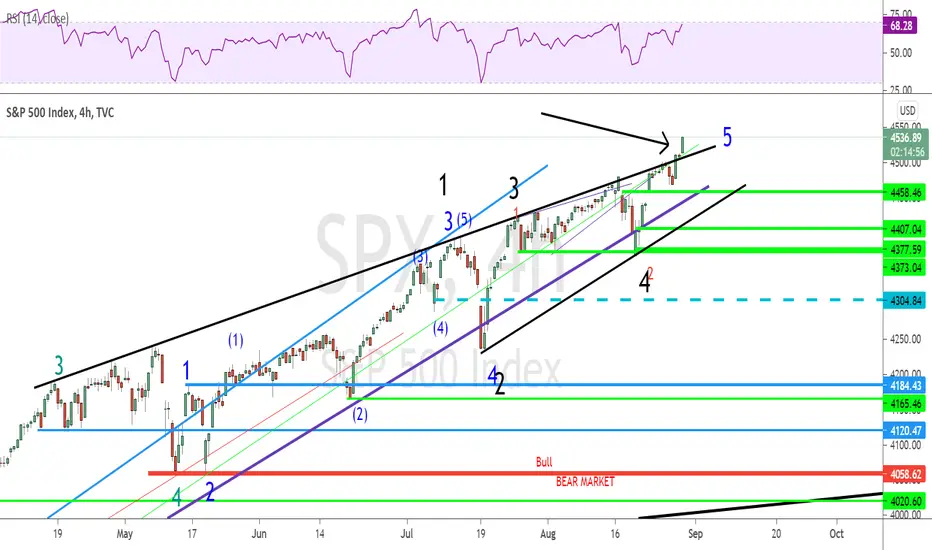
S&P 500 TOPPING PROCESSA simple Elliott wave corrective structure(A,B,C) having a target of A=C= 4613 is about to achieve this week.
Several times I expected (without confirmation) s&p500 to fall in AUGUST
BULL waves will end after forming an ending Diagonal which is nearing to complete.
My previous counts(bearish) are criticised ,BUT NO ONE expected this recovery wave had such an euphoric strength!!
Thanks to internet,young,algo,new trading community those who pulled out this index by loading lots of borrowed money.
The reality comes next in the name of PUNISHMENT for over exaggeration.

Bitcoin Analyze_Road Map🗺️(Update)!!!Hi, We saw an amazing dump yesterday, I expected this movement from before, and finally, it happened. what will happen for Bitcoin ?
for answering the question, I decided to update the road map that I published on Aug 14 , the topic was '' Bitcoin Analyze (Road Map) !!!🗺️''.
Bitcoin Analyze ( BTCUSDT ) Timeframe 8h ⏰
Location 🌊: Bitcoin's Correction has started at around 64200$ . Bitcoin was able to pass the First Main wave of Correction ( Main wave A ) at 28805$ . Wave A had 5 microwaves, so we have to wait for seeing ZigZag (5-3-5) Correction (I am believing that corrective structure hasn't ended).
We passed Main wave B by that dump + The price broke our important uptrend line (verification).
Now, we are sure about starting Main Wave C (90%). The Main wave C hast to have 5 microwaves that they can run on regular 5 impulsive waves (Scenario 1 ) or even run in ending Diagonal Triangle( Scenario 2 ).
If Scenario 1 happens, we can see 3 0000$ - 28800$ until the end of the year (even less).
if Scenario 2 happens, we will not see very low prices, (probably around 37600$ ).
I tried to show you the end of each microwave, let's see where are end of them? (a little hard to predict for now, but I try my luck 😉)
where is the end of microwave 1 of Main Wave C?
Taregts🎯: 44400$ until 42850$
where is the end of microwave 2 of Main Wave C?
Targets🎯: around 46600$ //around 47800$ // around 48914$ // even around 51540$ ( Low possible )
where is the end of microwave 3 of Main Wave C?
Targets🎯: 37600$ until 30800$
where is the end of microwave 4 of Main Wave C?
Targets🎯: 37800$ until 34200$
where is the end of microwave 5 of Main Wave C?
Targets🎯: 30600$ until 28800$ or even less than these.
Note : Over 53000$ my counting waves will fail and probably we are on new 5 impulsive waves for reaching new ATH.
❗️ Sign ❗️: if you remember that when we were at around 36000$ , Bitcoin touched 48168$ on BITCOIN / TETHERUS PERPETUAL FUTURES , and finally price arrived itself to this amount, yesterday we saw the same happens, and Bitcoin dropped down from 52000$ to 42800$ , probably Bitcoin will arrive at 42850$ again👇https://tradingview.sweetlogin.com/x/0DMkFLmW/
Thanks for reading this post, I hope that is useful for all.🌹🙏
My Suggestion : if you have coins, you have to think about taking profits especially on the end of microwave 2 of Main wave C / if you don't have coins, Don't be FOMO , probably time will give you another chance 👍😉.
Do not forget to put Stop loss for your positions (For every position you want to open).
Please follow your strategy , this is just my idea, and I will be glad to see your ideas in this post.
Please do not forget the ✅' like' ✅ button 🙏😊 & Share it with your friends, Thanks, and Trade safe

EOS EOSUSD - Rounding bottom + NEW ATH very soon!- This is my analysis for EOS , a lot of poepole asking about why EOS is not pumping.
- On the chart we can see a rounding bottom or cap and handle formation, which is bullish .
- After a rectangle consolidaton, the price started with an Impulse Elliott wave .
- First target 1:1 / below all time high.
- RSI is ready and volume favors bulls.
- For expected duration of the trade, probability, stop loss, profit target, entry price and risk to reward ratio ( RRR ) - please check my signature below ↓
- If you want to see more of these ideas, hit "Like" & "Follow"!

Elliott Wave Analysis: Dow Jones Is Forming The Wedge PatternHello traders and investors!
Today we will talk about Dow Jones Industrial, in which we see quite clear and very interesting formation. We are talking about an ending diagonal (wedge) pattern.
Well, DJI is rising, but as you can see, it's very slow, so it's obviously running out of steam, which we see it as part of an ending diagonal (wedge) pattern as part of wave 5 of a higher degree wave III.
An ending diagonal pattern is a type of pattern that can occur at the completion of a strong move. It reflects a “calming” of the market sentiment such that price still moves generally in the direction of the larger move, but not strongly enough to produce an impulsive wave. Ending diagonals consist of five waves, labeled 1-2-3-4-5, where each wave subdivides into three legs A-B-C. Waves 1 and 4 overlaps in price, while wave 3 can not be the shortest amongst waves 1, 3, and 5.
Respecting the price action and wave structure, seems like DJI is looking for another jump for wave C of (5) up to 35700 - 36000 area to complete that wedge pattern within a higher degree wave 5 of III and then watch out for a bigger and deeper correction within a higher degree wave IV that can send the price back to 33k support zone.
Trade well!
If you like what we do, then please like and share our idea!
Disclosure: Please be informed that information we provide is NOT a trading recommendation or investment advice. All of our work is for educational purposes only.

Beam BEAMUSDT - Head and Shoulders, new ATH soon!- Beam BEAM Rank #479 - Coin
- The price recently broked out of Head and Shouolders pattern
- We have a succesful retest of the HaS neckline
- Profit target is 1:1 fib extension
- Bullish volume is higher and RSI is prepared for a big pump very soon
- For expected duration of the trade, probability, stop loss, profit target, entry price and risk to reward ratio (RRR) - please check my signature below ↓
- If you want to see more of these ideas, hit "Like" & "Follow"!

ED or breakout?SPX is at an important junction here. If it can sustain the breakout above the upper black TL, then this could accelerate higher going fwd.
If SPX whipsaws the upper black TL and turns back down from here, then the ED (ending diagonal) would be gaining weight. Next few days look key and will set the intermediate term direction.
Trade safe!
Tron TRXUSD - ATH SOON + Ascending channel- On the chart we can see an incomplete Impulse Elliott Wawe (5th wave).
- Rounding bottom or cup and handle is also printing on the chart.
- Volume is very bullish and also RSI is prepared for another pump!
- Target is 1:1 fib trend-based extension + top of the ascending channel + 5th elliott wave
- For expected duration of the trade, probability, stop loss, profit target, entry price and risk to reward ratio ( RRR ) - please check my signature below ↓
- Huge bullish volume is also one of the positive signs!
- If you want to see more of these ideas, hit "Like" & "Follow"!

Axie Infinity AXSUSDT - Warning to all hodlers! Elliott Wave- On the chart we can spot an ending diagonal Elliott Wave.
- The price is at the top of the channel, which acts now as a resistance.
- Is it now good time to sell? Due to technical probably yes.
- There is also a bearish divergence on the RSI indicator!
- For expected duration of the trade, probability, stop loss, profit target, entry price and risk to reward ratio (RRR) - please check my signature below ↓
- If you want to see more of these ideas, hit "Like" & "Follow"!
- Maybe it is a great time to sell this coin, take profits and buy something else.

TomoChain TOMOUSDT - Impulse Elliott Wave + Ascending channel- TomoChain TOMO - Rank #175 on coinmarketcap, Market Cap $224,505,110.
- TOMO looks very strong on the weekly time frame.
- We can spot an ascending channel, which provides us with a good support/resistance.
- Due to my Elliott wave count, we are currently in the 5th wave.
- RSI is ready for another pump very soon!
- For expected duration of the trade, probability, stop loss, profit target, entry price and risk to reward ratio (RRR) - please check my signature below ↓
- If you want to see more of these ideas, hit "Like" & "Follow"!

Tron TRXUSD - Elliott wave + Massive channel!- On the chart we can see an incomplete Impulse Elliott Wawe (5th wave).
- Rounding bottom or cup and handle is also printing on the chart.
- Volume is very bullish and also RSI is prepared for another pump!
- Target is 1:1 fib trend-based extension + top of the ascending channel + 5th elliott wave
- For expected duration of the trade, probability, stop loss, profit target, entry price and risk to reward ratio ( RRR ) - please check my signature below ↓
- Huge bullish volume is also one of the positive signs!
- If you want to see more of these ideas, hit "Like" & "Follow"!

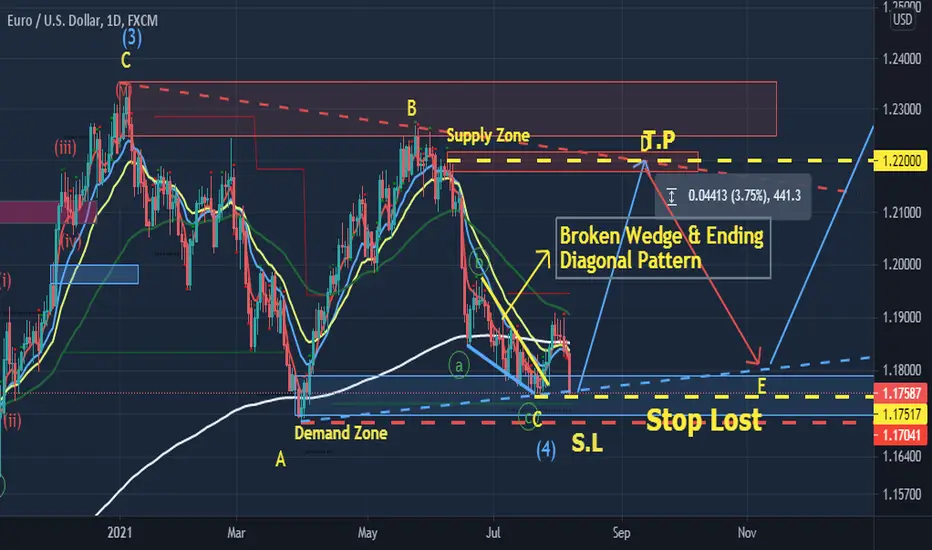
EURUSD < 10pips from Stop Lost with 441.3 pips potential! 8/8/21EURUSD price have broken the wedge pattern with completed ending diagonal pattern. Stop Lost either @ 1.1750 ( less than 10 pips from current 1.17587 level with potential profit of 440 pips . Meant 1.17587 - 1.1750 = 8.7 pips risk . 440 / 8.7 = 50.57/ 1 "Huge!" risk/reward ratio ) or @ 1.1700
Binance BNBUSD - 10 000% is near! + Elliott Wave!- BNB is by far one of the most bullish altcoin out there!
- My impulse Elliott wave is telling me that there will be another pump very soon.
- Parallel channel can act as a support in the future.
- 10 000% is very near!
0.618 trend-based fib extension is the target
- For expected duration of the trade, probability, stop loss, profit target, entry price and risk to reward ratio (RRR) - please check my signature below ↓
- If you want to see more of these ideas, hit "Like" & "Follow"!

Aave AAVEUSDT - Impulse Elliott wave + ALL TIME HIGH soon!- Aave is an Open Source and Non-Custodial protocol to earn interest on deposits and borrow assets.
- Current rank 27 on coinmarketcap + Volume 24h $651,835,502.
- This is my Elliott wave count - we are currently in the Impulse wave to the upside!
- Next target is 0.618 trend-based fib extension for fifth wave.
- For expected duration of the trade, probability, stop loss, profit target, entry price and risk to reward ratio (RRR) - please check my signature below ↓
- If you want to see more of these ideas, hit "Like" & "Follow"!

Elliott Wave Analysis: ICXUSD Can Be Forming Wedge PatternHello Crypto traders!
Today we will talk about ICON cryptocurrency in which we are tracking the final wave C that can be completed within a bigger ending diagonal (wedge) pattern, where ideal support would be around 0.50 - 0.40 area, where we also see 161,8% Fibo. extension target of wave A.
An ending diagonal a.k.a wedge pattern is a type of pattern that can occur at the completion of a strong move. It reflects a “calming” of the market sentiment such that price still moves generally in the direction of the larger move, but not strongly enough to produce an impulsive wave.
Ending diagonals consist of five waves, labeled 1-2-3-4-5, where each wave subdivides into three legs. Waves 1 and 4 overlaps in price, while wave 3 can not be the shortest amongst waves 1, 3, and 5.
As you can see ICXUSD can be trading in final stages of wave "v" of C, but final subwave (c) of "v" is still missing, so watch out for that final drop, maybe even a spike before bulls show up.
Be humble and trade smart!
If you like what we do, then please like and share our idea!
Disclosure: Please be informed that information we provide is NOT a trading recommendation or investment advice. All of our work is for educational purposes only.

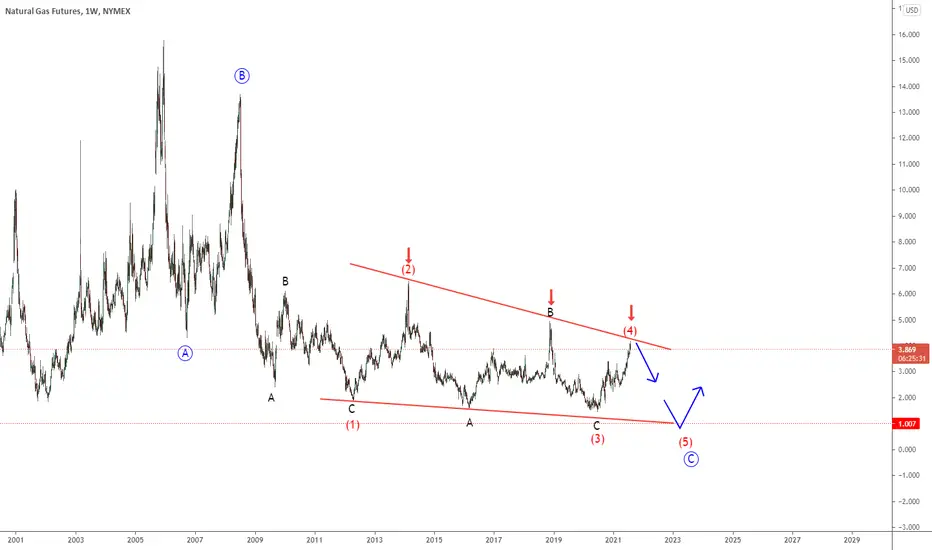
Elliott Wave Analysis: NATURAL GAS Is At The Resistance ZoneHello traders and investors!
Today we will talk about natural gas, its price action from technical point of view and wave structure from Elliott Wave perspective.
As you can see, natural gas is in the downtrend and we are tracking a big weekly A-B-C decline, where wave C is in progress since 2008 and it looks like a big ending diagonal (wedge) pattern.
Ending diagonals a.k.a wedge patterns consist of five waves, labeled 1-2-3-4-5, where each wave subdivides into three legs. Waves 1 and 4 overlaps in price, while wave 3 can not be the shortest amongst waves 1, 3, and 5.
Well, current recovery on natural gas looks slow, choppy and overlapped, so we believe that it belongs to a wave (4), which can stop here in the 4.x area and at the strong weekly upper ending diagonal line.
So, in case if natural gas starts sharply and impulsively falling, then be aware of a bearish continuation within the final wave (5) that can send the price back to lows and 1.0 area before it finds the bottom.
All the best and have a nice weekend!
If you like what we do, then please like and share our idea!
Disclosure: Please be informed that information we provide is NOT a trading recommendation or investment advice. All of our work is for educational purposes only.
Dollar Ending diagonalHere we see an ending diagonal at a major resistance level indicating a bearish wave coming fourth. Key features are the extended fifth wave, overlapping the triangle, as well as a double top, indicating the reversal.
Good luck and follow me for more !

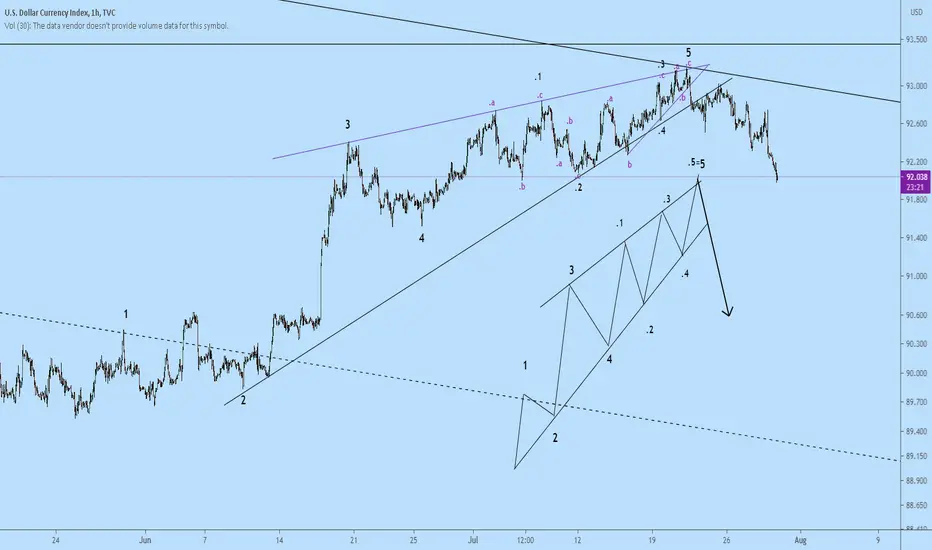
Pattern recognition: Ending Diagonal Triangle. The recent price action of the US Dollar Index (DXY) appears to me to be a excellent example of what in EWT is called an Ending Diagonal Triangle. In EWT normally the 5th wave is composed of 5 sub-waves that do not overlap. (Which in this example I have labeled .1,.2,.3,.4,.5). But in this type of ascending triangle formation they do overlap and each sub-wave often has an a-b-c appearance i.e. composed of 3 waves.
For more information see the pattern expert Thomas Bulkoski:
thepatternsite.com
Grasim - Elliott wave analysis - ending diagonal It seems like the 5th wave ending diagonal is finished or may take little time to finish. It will go bearish below 1461 level and expected to go up to 1350-1250 zone.

EURUSD - Elliott wave – update – minute wave ((a)) ended
Ending diagonal in wave (v) is over - minute wave ((a)) ended
minute wave ((b)) should follow in a 3 wave zigzag/flat
ALT: minute wave ((a)) is not over yet
critical price area
previous daily close 1.1801
PP 1.1790 UP

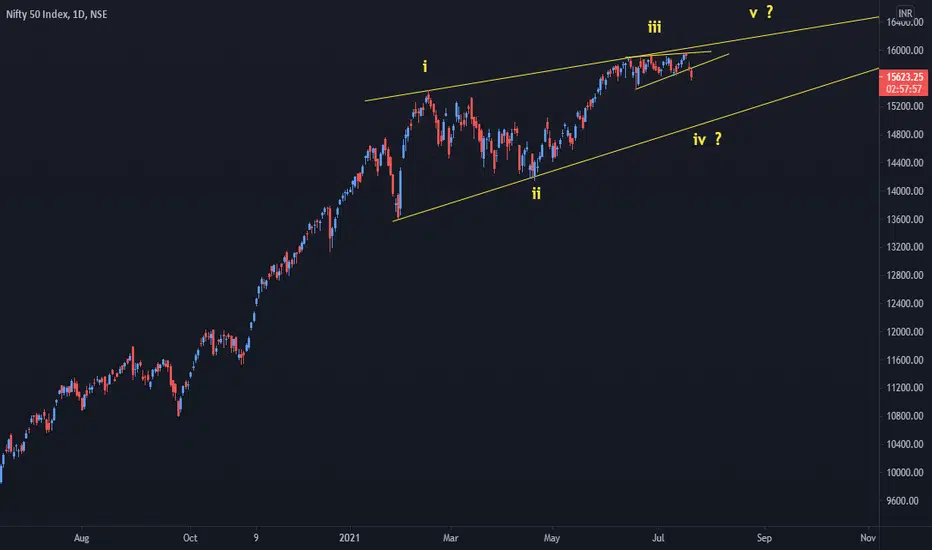
Nifty : Ending Diagonal in FormationNifty in formation of Ending Diagonal and it seems like we nearing to end of up trend
Elliott Wave: a rare Expandeing Ending Diagonal?It's a very rare wave pattern, let's wait for the following wave to unfold
For the aggressive traders may try to short at the current level, but the risk is high, so the stop level should be very tight

GBPAUD, 4hr tf, broadening wedge pattern
I do respect the idea that GBPAUD might drop along with EURAUD. We're also near the horizontal weekly resistance right now.
If i draw a trend line connecting the low and high of GBPAUD recent movement. It will look like a broadening wedge pattern.
In terms of Elliott Wave, this is a broadening ending diagonal.
Sell GBPAUD 1.8610
Stop loss 1.8670
Take profit 1.8410 (3.3R)
Use only 1-2% risk
Good luck
