Energy Commodities
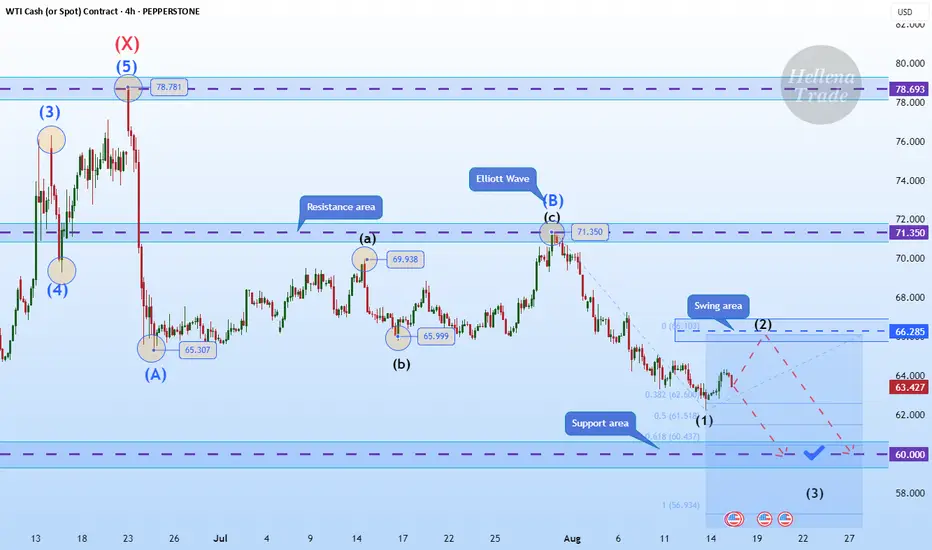
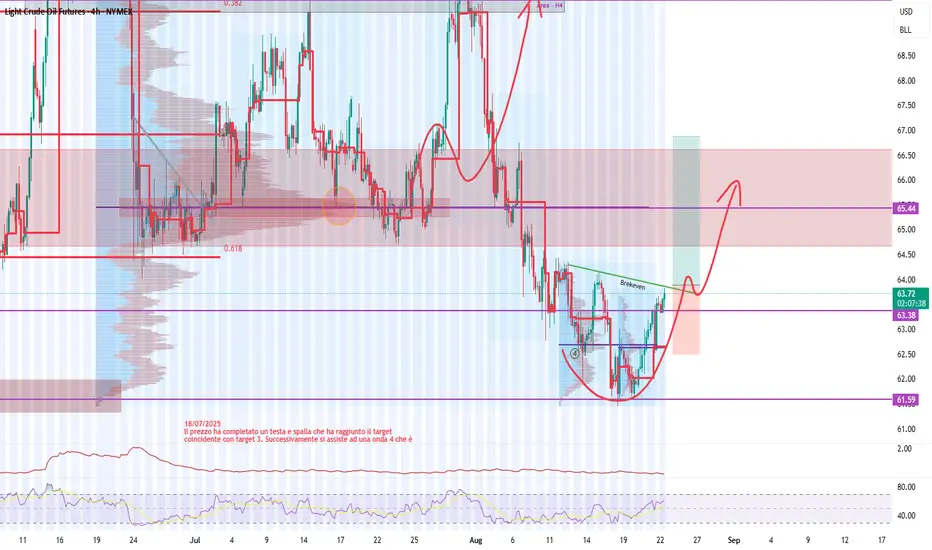
Hellena | Oil (4H): SHORT to support area of 60 (Wave "3").Wave “C” continues to develop in a five-wave movement. Right now, I think wave “1” has just ended and we will see a small correction to the 66,280 area (wave ‘2’), after which I expect wave “3” to develop, which should go further than the 60 support level, but this is a fairly strong psychological level at which it would be good to take profits.
Manage your capital correctly and competently! Only enter trades based on reliable patterns!
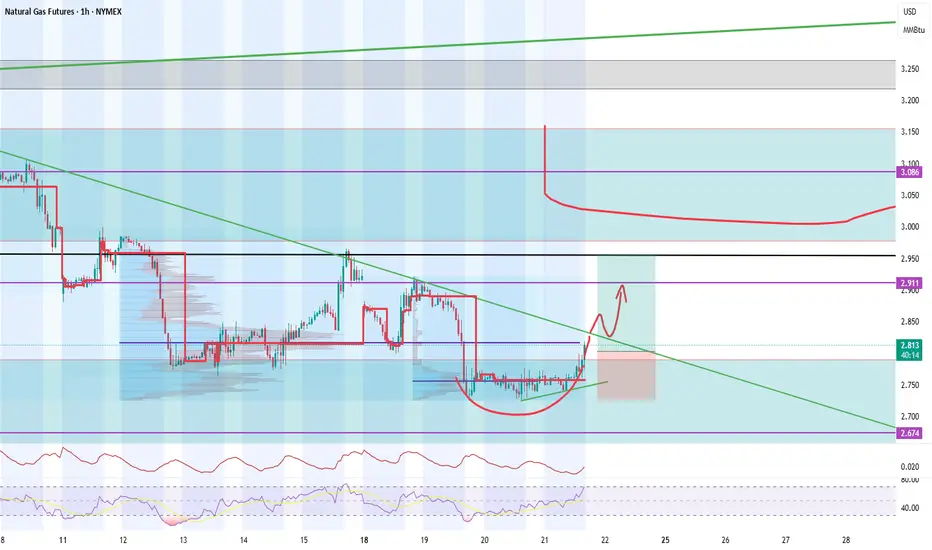
NATGAS - Potential UPI notice a support with a potential accumulation patter for a new phase UP until 3$
USCrudeOil| Inventory Draw Lifts Prices Fed Geopolitics in Focus🛢️ USCRUDE OIL – Overview
Oil edges higher amid U.S. stock draw
WTI crude oil futures rose to $63.45 per barrel on Thursday, extending gains from the previous session after U.S. crude inventories posted a bigger-than-expected draw.
📊 EIA data showed stockpiles fell by 6 million barrels to 420.7 million, compared to expectations for a 1.3 million-barrel draw, providing short-term support for prices.
At the same time, markets are watching closely for progress in the Russia-Ukraine peace talks, brokered by U.S. President Donald Trump. Any breakthrough that results in easing sanctions on Russian crude exports could shift global supply dynamics.
Despite the latest rebound, crude prices remain down over 10% year-to-date, pressured by expectations of oversupply as OPEC+ restores output and tariff concerns weigh on demand outlook.
🔎 Technical Outlook
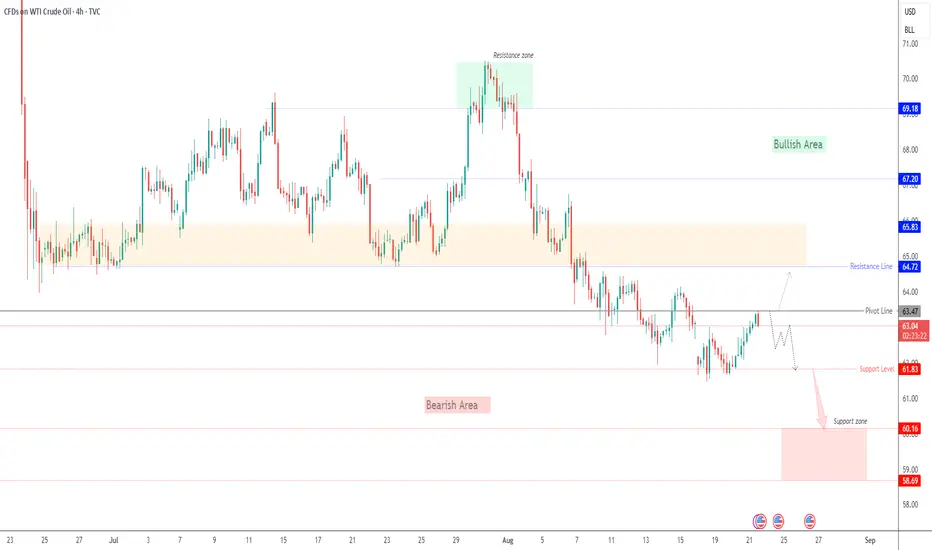
Bearish Scenario:
As long as price trades below the pivot line at 63.47, downside targets are seen at 61.83, and a break lower could extend losses toward 60.16.
Bullish Scenario:
A 4H candle close above 63.47 would open the way toward 64.72, with further upside potential toward 65.80 – 67.20.
📍 Key Levels
Pivot: 63.47
Support: 62.25 – 61.85 – 60.20
Resistance: 64.70 – 65.80 – 67.20
⚠️ Crude remains highly sensitive to geopolitical headlines and inventory data — expect volatility around key supply developments.
Previous idea:
USOIL Is Going Down! Sell!
Please, check our technical outlook for USOIL.
Time Frame: 1h
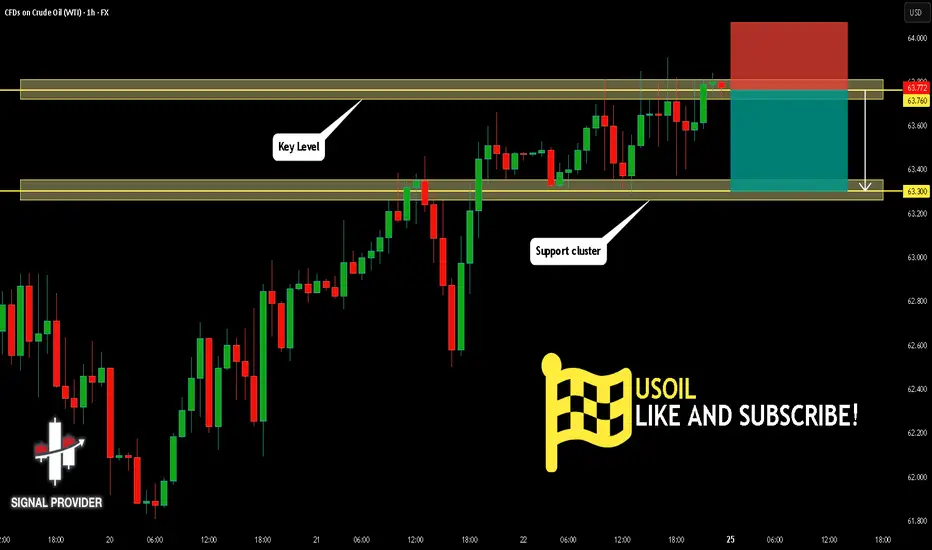
Current Trend: Bearish
Sentiment: Overbought (based on 7-period RSI)
Forecast: Bearish
The market is approaching a significant resistance area 63.760.
Due to the fact that we see a positive bearish reaction from the underlined area, I strongly believe that sellers will manage to push the price all the way down to 63.300 level.
P.S
Overbought describes a period of time where there has been a significant and consistent upward move in price over a period of time without much pullback.
Disclosure: I am part of Trade Nation's Influencer program and receive a monthly fee for using their TradingView charts in my analysis.
Like and subscribe and comment my ideas if you enjoy them!
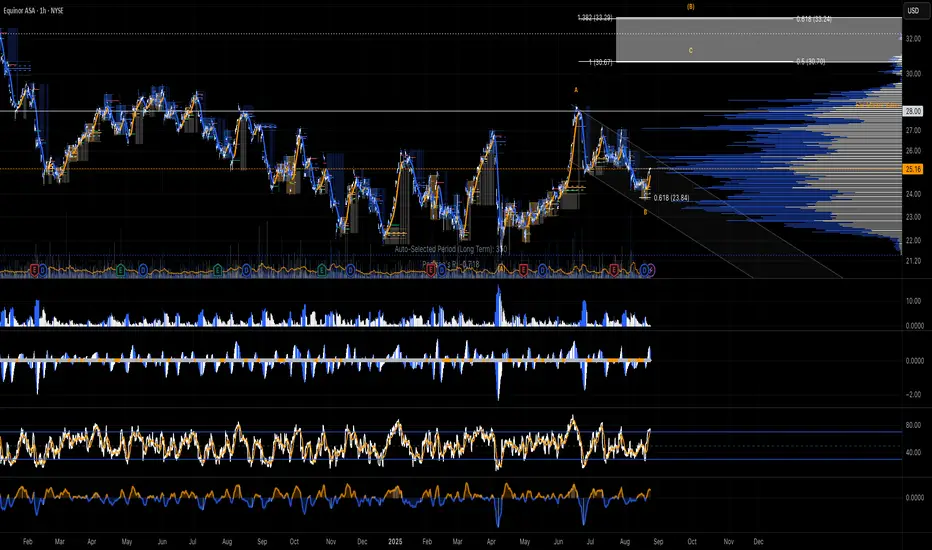
Equinor ASA ($EQNR) ~ Beautiful WaVes...Business Summary
Equinor ASA, formerly Statoil ASA is a Norway-based international energy company. The Company’s purpose is to turn natural resources into energy. Equinor sells crude oil and delivers natural gas to the European market. It is also engaged in processing, refining, offshore wind and carbon capture and storage activities. Equinor ASA has five reporting segments: Exploration & Production Norway (E&P Norway), Exploration & Production International (E&P International), Exploration & Production USA (E&P USA), Marketing, Midstream & Processing (MMP) and Renewables (REN). The Company has several subsidiaries such as Equinor Nigeria Energy Company Ltd, Equinor Wind Power AS, Equinor International Netherlands BV and Equinor Brasil Energia Ltda. EQNR 1.15%↑
Financial Summary
BRIEF: For the six months ended 30 June 2025, Equinor ASA (ADR) revenues increased 8% to $54.51B. Net income decreased 13% to $3.94B. Revenues reflect Marketing, Processing and Renewable Energy segment increase from $25.14B to $53.86B, Exploration and Production - International segment increase of 90% to $308M. Net income was offset by REN segment loss increase from $90M to $1.26B, Marketing.
CRUDE OIL SHORT FROM RESISTANCE|
✅CRUDE OIL is going up now
But a strong resistance level is ahead at 64.50$
Thus I am expecting a pullback
And a move down towards the target of 63.33$
SHORT🔥
✅Like and subscribe to never miss a new idea!✅

Crude oil: Sell around 64.00, target 62.00-60.00.Crude Oil Market Analysis:
Crude oil has rebounded over the past two days, with the daily chart closing in a doji pattern for two consecutive days. This rebound presents another opportunity to sell. Our outlook for crude oil remains bearish, and we continue to monitor resistance at 64.00 and 65.00. Both levels present selling opportunities, and the daily chart is unlikely to change its selling pattern in the short term.
Fundamental Analysis:
The recent positive developments in the Russia-Ukraine situation are weighing on gold. The Federal Reserve's monetary policy, in line with market expectations, is also weighing on gold. Fundamentals suggest that neither is very bullish for gold.
Trading Recommendations:
Crude oil: Sell around 64.00, target 62.00-60.00.
Crude oil - Potential UPThe break of breakeven must be give a push UP of price until next resistence area
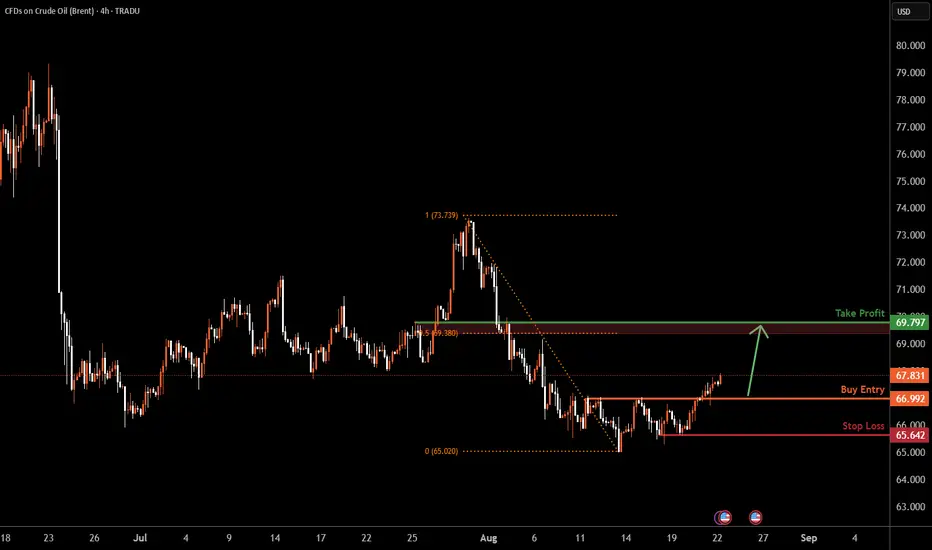
UKOIL H4 | Bullish riseUKOIL is falling towards the buy entry which is a pullback support and could bounce from this level to the upside.
Buy entry is at 66.99
Stop loss is at 65.64
Take profit is at 69.79
High Risk Investment Warning
Trading Forex/CFDs on margin carries a high level of risk and may not be suitable for all investors. Leverage can work against you.
Stratos Markets Limited (tradu.com ):
CFDs are complex instruments and come with a high risk of losing money rapidly due to leverage. 65% of retail investor accounts lose money when trading CFDs with this provider. You should consider whether you understand how CFDs work and whether you can afford to take the high risk of losing your money.
Stratos Europe Ltd (tradu.com ):
CFDs are complex instruments and come with a high risk of losing money rapidly due to leverage. 66% of retail investor accounts lose money when trading CFDs with this provider. You should consider whether you understand how CFDs work and whether you can afford to take the high risk of losing your money.
Stratos Global LLC (tradu.com ):
Losses can exceed deposits.
Please be advised that the information presented on TradingView is provided to Tradu (‘Company’, ‘we’) by a third-party provider (‘TFA Global Pte Ltd’). Please be reminded that you are solely responsible for the trading decisions on your account. There is a very high degree of risk involved in trading. Any information and/or content is intended entirely for research, educational and informational purposes only and does not constitute investment or consultation advice or investment strategy. The information is not tailored to the investment needs of any specific person and therefore does not involve a consideration of any of the investment objectives, financial situation or needs of any viewer that may receive it. Kindly also note that past performance is not a reliable indicator of future results. Actual results may differ materially from those anticipated in forward-looking or past performance statements. We assume no liability as to the accuracy or completeness of any of the information and/or content provided herein and the Company cannot be held responsible for any omission, mistake nor for any loss or damage including without limitation to any loss of profit which may arise from reliance on any information supplied by TFA Global Pte Ltd.
The speaker(s) is neither an employee, agent nor representative of Tradu and is therefore acting independently. The opinions given are their own, constitute general market commentary, and do not constitute the opinion or advice of Tradu or any form of personal or investment advice. Tradu neither endorses nor guarantees offerings of third-party speakers, nor is Tradu responsible for the content, veracity or opinions of third-party speakers, presenters or participants.
WTI Bull setupSwing trade
Bull points
- RSI div
- Wait for trend reversal
Put Buy stop on last Lower High or wait for HH and HL or reversal
RRR 1:1
Go for 1:2 manage your risk first...
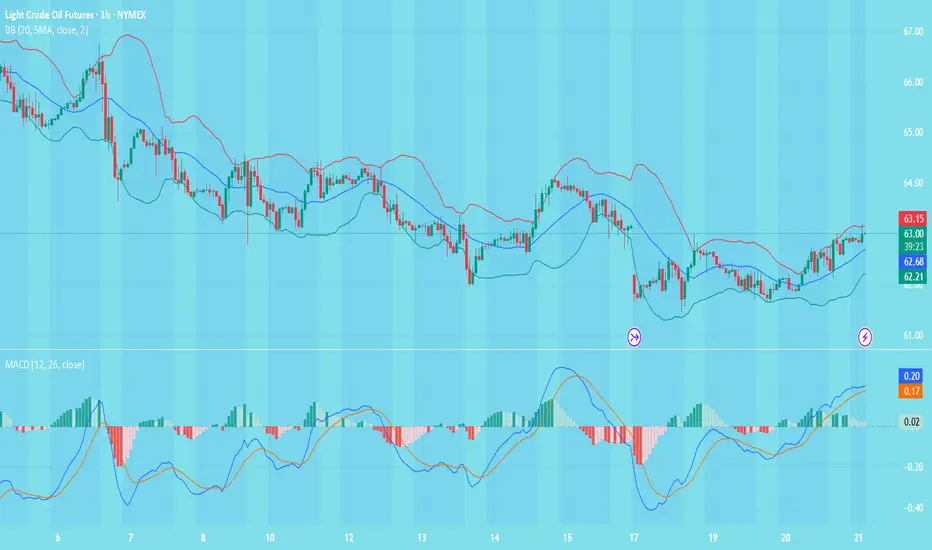
WTI(20250821)Today's AnalysisMarket Update:
This week, central bankers from around the world gathered in Jackson Hole, Wyoming, for the annual global central bank meeting. They planned not only to exchange research and enjoy the beautiful mountain scenery, but also to defend Federal Reserve Chairman Jerome Powell. Powell has come under sustained attack from US President Trump for his refusal to cut interest rates. Trump has also promised to replace Powell with a more compliant candidate after his term ends next year. This offensive has unnerved global policymakers, who worry that central bank independence, seen as key to controlling inflation, could be undermined.
Technical Analysis:
Today's Buy/Sell Levels:
62.47
Support and Resistance Levels:
63.64
63.21
62.92
62.02
61.74
61.30
Trading Strategy:
On the upside, consider buying on a breakout above 62.92, with the first target at 63.21.
On the downside, consider selling on a breakout above 62.47, with the first target at 62.02.
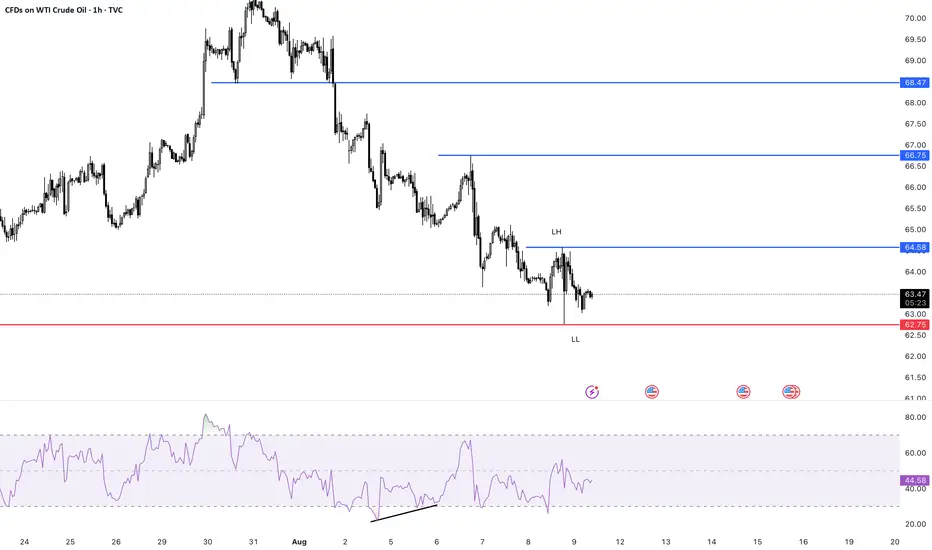
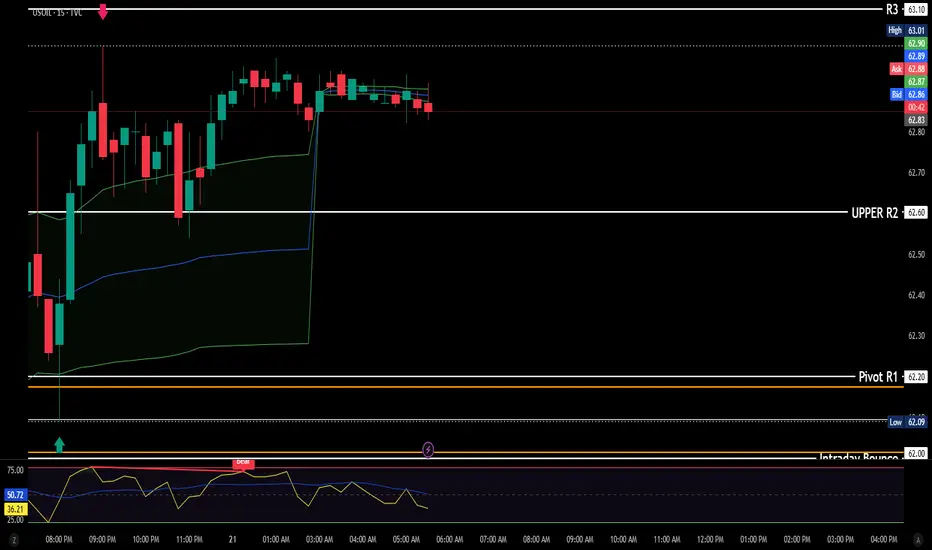
USOIL - intradayPrice has been hovering under ~63 I was hoping we get a break in the Asian session but as always it's chop city.
Now price breaking below VWAP is what I am watching, no confirmation yet but volume efficiency is suggesting bears are slightly in control right now.
NFA
Natural Gas Equities Showing Relative StrengthNatural Gas was briefly red today but saw a bit of a bullish recovery.
Price action came very close to filling the weekly downside gap but just missed it.
Inventories are set to be released tomorrow at 10:30am
Interestingly, Nat Gas stocks like NYSE:AR & NYSE:EQT showed great relative strength in the market today.
Is this signaling a pop in Nat Gas price tomorrow?
We are long NYSE:AR calls from yesterday.

Oil; War or supply and demandOil is preparing for a strong upward move and is in the buying range marked with blue lines and will move at least to the ceiling range if confirmed.
Will the war in the Middle East or US economic policies or supply and demand of OPEC and other producers cause this move?
We have to wait and see
Stay with me and be profitable
Do you have any questions? Ask me in the comments
Don't forget to introduce me to your friends so that we can all profit together?
What do you have in mind that I should analyze for you? Comment for me.
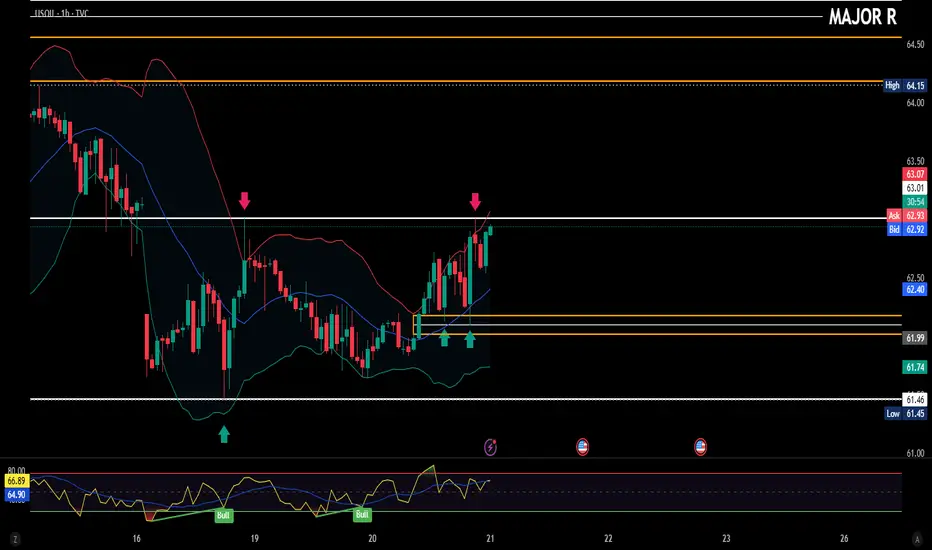
USOIL - 1HMarket hovering around ~63 which validates my earlier post.
Now considering if bulls can keep the momentum going, next target is ~64-64.2 right into resistance.
Earlier price rejected at 62.6-7 area few times only to fill the FVG below and break above 62.7 shows bulls weren't playing around.
Now I am skeptical since we have our friend Jerry speaking tomorrow to ruin our lives, I am betting bulls will keep the momentum going till Jerry speaks.
If he's dovish we make a break above 64, if he's hawkish we will see bearish momentum continuing till 60 IMO.
NFA
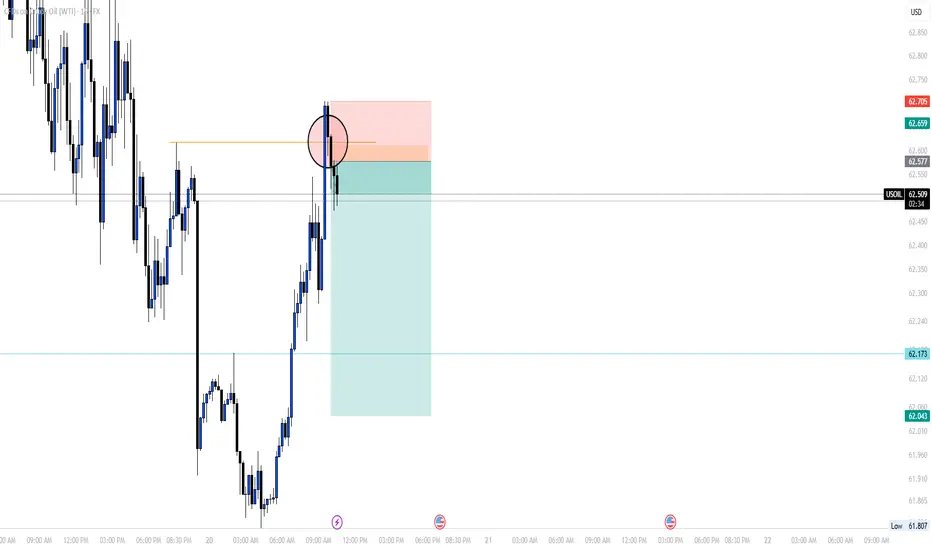
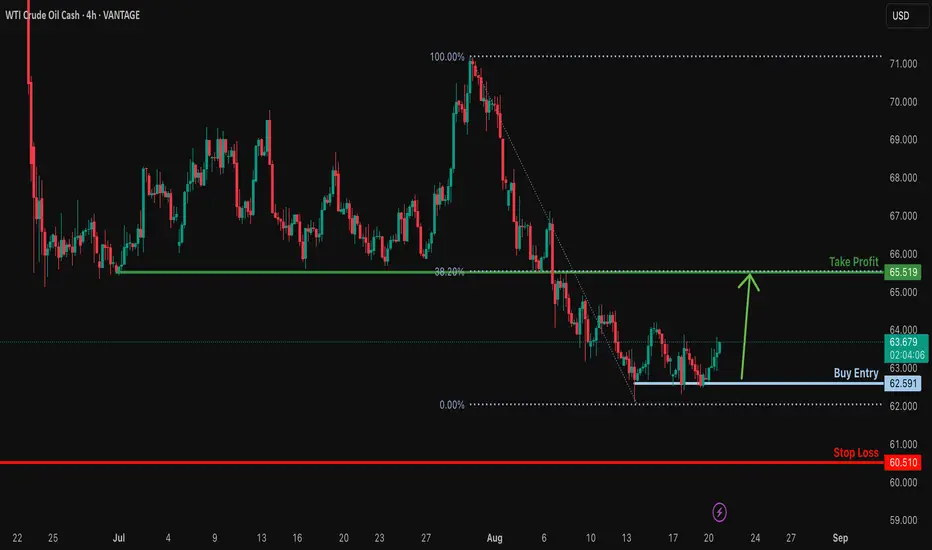
Bullish reversal off pullback support?USO/USD has bounced off the support level, which is a pullback support, and could potentially rise from this level to our take profit.
Entry: 62.59
Why we like it:
There is a pullback support level.
Stop loss: 60.51
Why we lik eit:
There is a multi swing low support.
Take profit: 65.51
Why we like it:
There is a pullback resistance level that lines up witht he 38.2% Fibonacci retracement.
Enjoying your TradingView experience? Review us!
Please be advised that the information presented on TradingView is provided to Vantage (‘Vantage Global Limited’, ‘we’) by a third-party provider (‘Everest Fortune Group’). Please be reminded that you are solely responsible for the trading decisions on your account. There is a very high degree of risk involved in trading. Any information and/or content is intended entirely for research, educational and informational purposes only and does not constitute investment or consultation advice or investment strategy. The information is not tailored to the investment needs of any specific person and therefore does not involve a consideration of any of the investment objectives, financial situation or needs of any viewer that may receive it. Kindly also note that past performance is not a reliable indicator of future results. Actual results may differ materially from those anticipated in forward-looking or past performance statements. We assume no liability as to the accuracy or completeness of any of the information and/or content provided herein and the Company cannot be held responsible for any omission, mistake nor for any loss or damage including without limitation to any loss of profit which may arise from reliance on any information supplied by Everest Fortune Group.
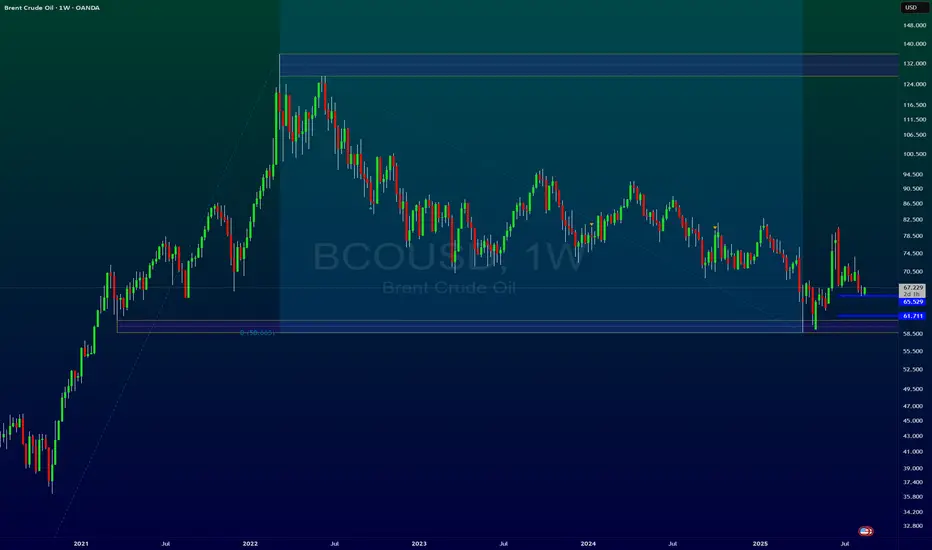
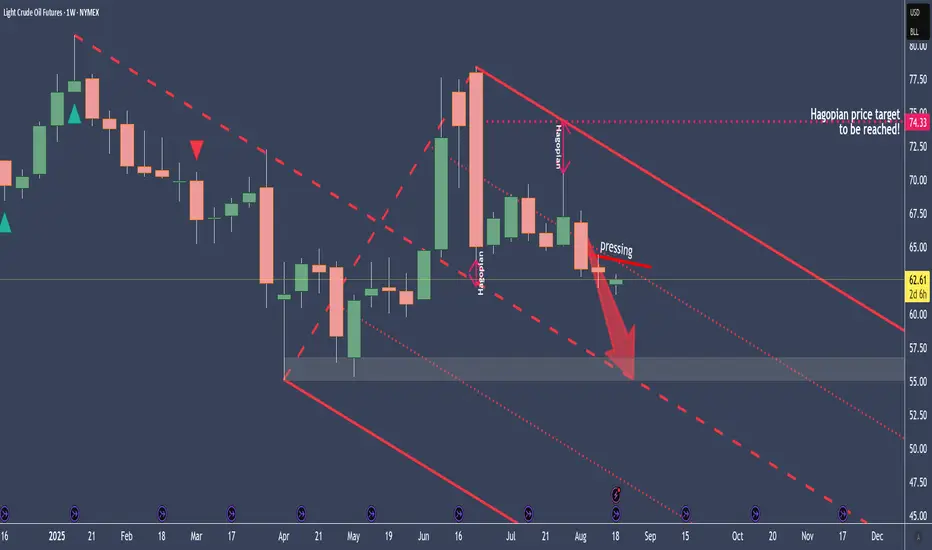
Crude Oil - Why I see it at $56 in the coming weeksCrude is trading below the centerline.
The pressing shows that the “election whales” don’t want higher prices at the moment.
Why?
No idea, and it doesn’t matter either.
All I’m interested in is where I can find a good entry to short crude. For example, a pullback to the pressure line, with a money management stop, or behind one of the weekly candles. It’s all a question of how much risk you’re allowed to take according to risk management.
Let’s see if we get an entry to join the sleigh ride down to the centerline.
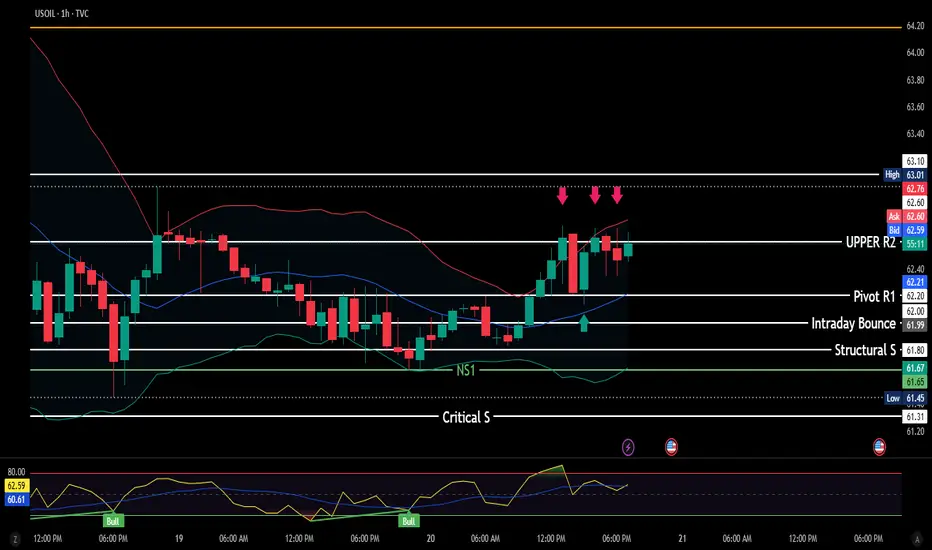
USOIL - lookoutMultiple rejections at R2 on 1H as marked, however price bounced back from the R1 pivot.
It seems traders are trying to hold price in anticipation of the EIA data tomorrow.
Personally I feel R3 will be hit, but I would trade cautiously, if you're like me and missed the move. Wait for confirmations, don't just jump in.
NFA
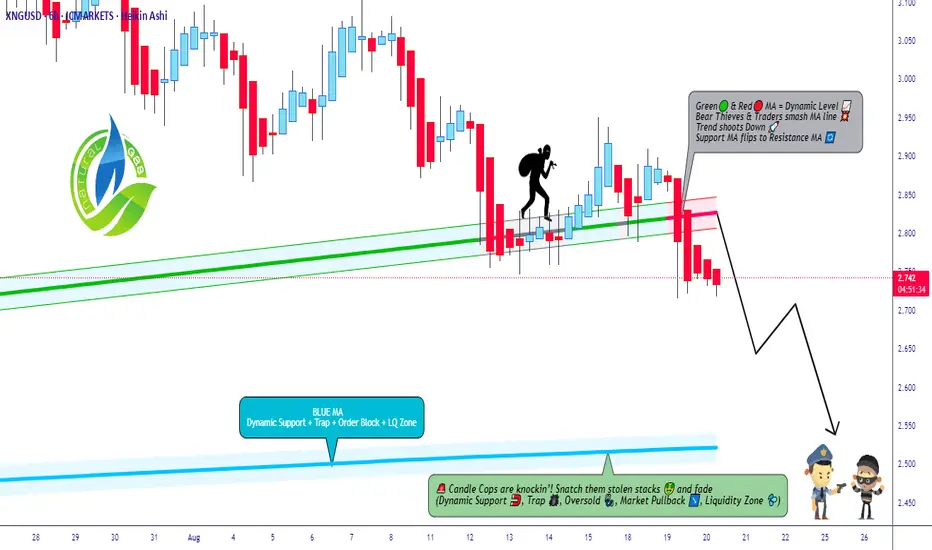
Natural Gas: The Bearish Raid is On! Are You In?🌟 ATTENTION ALL BLACK MARKET TRADERS & NINJA THIEVES! 🌟
(XNG/USD Natural Gas Heist Plan - Bearish Swing/Scalping)
Yo! 🐱👤🤑 The vault doors are creaking open on Natural Gas, and it's time for a BEARISH HEIST! Our intel suggests the big dump is coming. Police ain't around, so let's move! 🚓💨
🦹♂️ THE MASTER HEIST PLAN (BEARISH EDITION)
Asset: XNG/USD (Natural Gas) | Trade Type: Swing / Scalping Heist
Overall Bias: BEARISH 📉👊 (We're stealing on the way DOWN!)
🎯 ENTRY PROTOCOL: THE "LAYER" HEIST
For the OG Thieves who understand patience and precision. We're not chasing; we're setting traps!
🎪 ENTRY: Any price level is a gift! But for the pros, we're setting MULTIPLE SELL LIMIT ORDERS to layer our entry like a true market ninja.
🧨 LAYER 1: 2.740
🧨 LAYER 2: 2.770
🧨 LAYER 3: 2.800
Pro Tip: You can add more layers based on your own capital. More layers, more loot! 💰💰💰
🚨 STOP LOSS (The Getaway Car Engine)
This is where we bail if the cops show up. Don't be a hero.
🛑 THIEF S.L.: @2.950
📢 OG ANNOUNCEMENT: Dear Ladies & Gentleman of the shadow markets, adjust your SL based on your own risk appetite and strategy! Protect your capital! 🛡️
🏁 TARGET (The Escape Route)
The police barricade is set up down below. Our goal is to escape with the stolen money before we hit it!
🎯 T/P 1 (CASH OUT): @2.550 🚗💨
🚧 POLICE BARRICADE: @2.450 (Danger! Avoid this area!)
🔪 SCALPERS, LISTEN UP! 👂
If you're in and out quick, only scalp on the SHORT side. Ride those little downtrends for quick cash. Use a tight trailing stop to protect your mini-loot! 🏃♂️💵
⚠️ HEIST ALERT: NEWS LOCKDOWN 🚫📰
Big news = cops everywhere! It creates chaos and volatility. To avoid getting caught:
AVOID new trades during high-impact news.
USE Trailing Stops to lock in profits on running heists.
STAY STEALTHY. 🐱👤
💣 BOOST THIS IDEA! 💣
It fuels our underground network and helps us find the next perfect heist! Let's drain this market dry together! 🤑🤝❤️🎉
I'll see you in the shadows with the next score. Stay sharp! 🙈🙉🙊
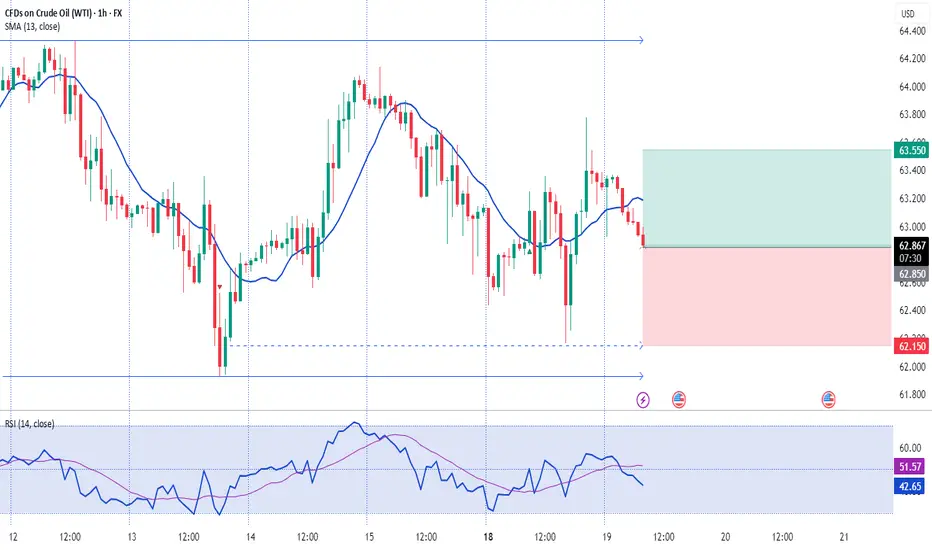
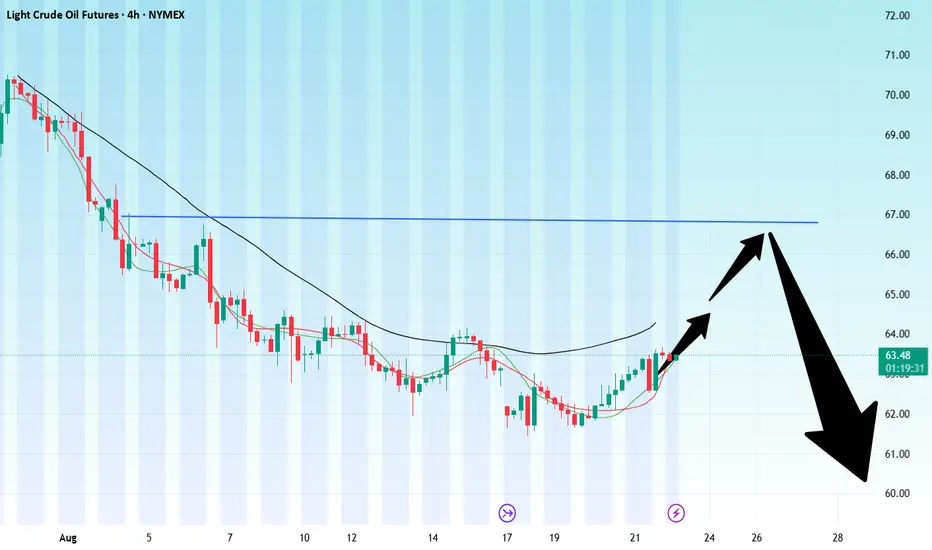
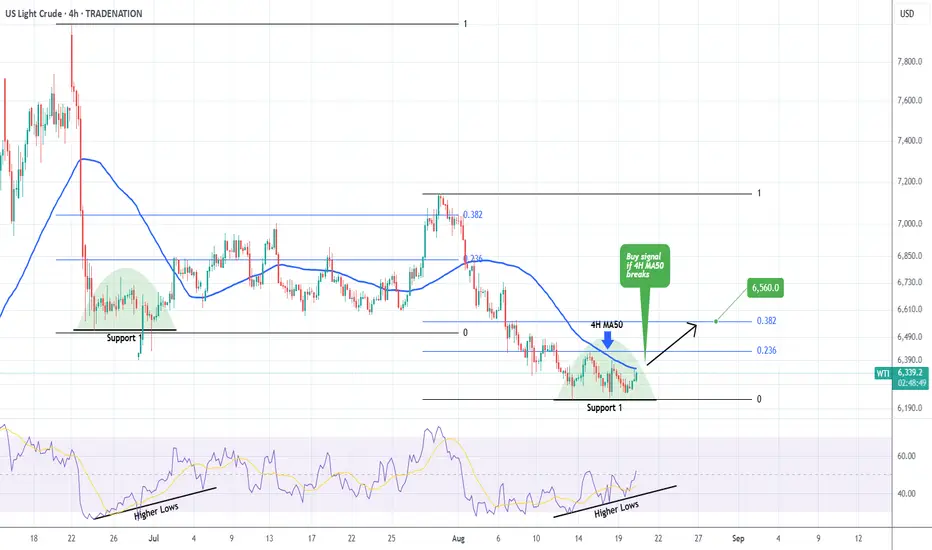
WTI OIL Buy signal if the 4H MA50 breaks.WTI Oil (USOIL) appears to have found short-term Support since the August 13 Low, turning sideways, with its 4H RSI however on Higher Lows, thus displaying a Bullish Divergence.
This is similar to the June 24 - July 02 Bullish Divergence, which once it broke above the 4H MA50 (blue trend-line), it topped a little over the 0.382 Fibonacci retracement level.
As a result, we will be waiting for the 4H MA50 bullish break-out signal to target $65.60 (Fib 0.382).
-------------------------------------------------------------------------------
** Please LIKE 👍, FOLLOW ✅, SHARE 🙌 and COMMENT ✍ if you enjoy this idea! Also share your ideas and charts in the comments section below! This is best way to keep it relevant, support us, keep the content here free and allow the idea to reach as many people as possible. **
-------------------------------------------------------------------------------
Disclosure: I am part of Trade Nation's Influencer program and receive a monthly fee for using their TradingView charts in my analysis.
💸💸💸💸💸💸
👇 👇 👇 👇 👇 👇
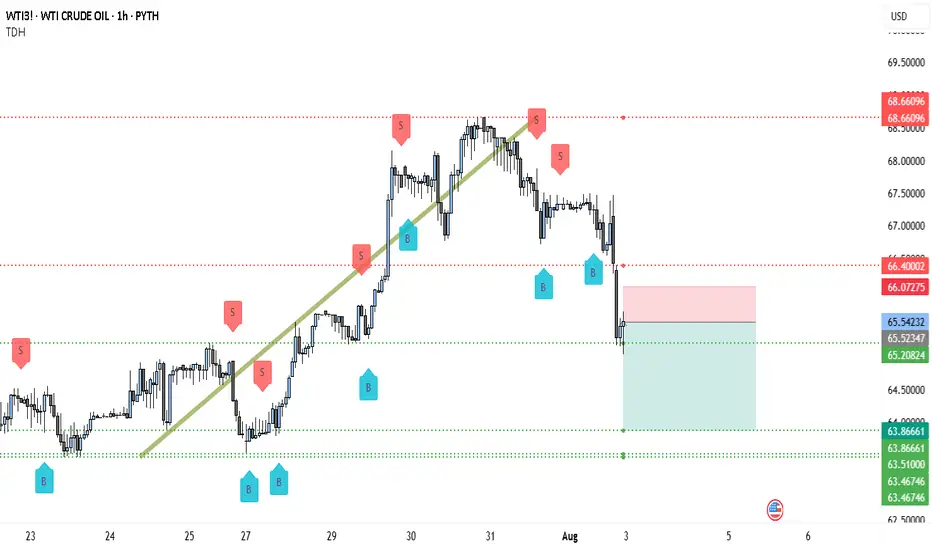
Crude Oil Warning $66.40 Flip Signals $63.86 TargetWTI rolled over after failing near $68.66096 (top red dashed line). The breakdown through $66.40002 turned that level into resistance 🚧. After a sharp selloff, price is now hovering around the $65.54 area (thin entry line labeled 65.54232), just beneath the minor pivot band at 65.54 / 65.52 / 65.21 (green dashed cluster labeled 65.54232 • 65.52347 • 65.20824). The structure is lower-high → lower-low, which keeps momentum bearish while price holds below $66.40. If sellers keep control, the next magnet is the confluence support around $63.86661 (first lower green dashed line), with extension into $63.51000–$63.46746 if momentum accelerates.
You can also see repeated “S” tags on the push down from the high and into the mid-range, while the “B” tags cluster only at pullback lows—classic distribution behavior. Any spikes toward $66.07 (label 66.07275) and especially $66.40 should attract supply unless bulls reclaim and hold above that zone.
Trade setup 🎯 (from the chart):
• Entry: $65.54232 (≈ $65.54)
• Stop-loss: $66.07275 (≈ $66.07), conservative SL above $66.40002 if you prefer more room
• Targets: $63.86661 first take-profit; stretch targets $63.51000 → $63.46746
This offers a solid bearish R:R while price stays capped beneath $66.40. As it moves your way, book small profits 💰 at each objective, trail stops 🔒 (e.g., to $65.52 once under $65.21), and size the position to your own risk tolerance—WTI can spike on headlines.
Invalidation: A sustained reclaim and hold above $66.40 would neutralize the immediate bearish bias and open room back toward $68.66. Until then, the path of least resistance remains down 📉.
SELL USOILOur trade for today is on OIL as usual, in which we're going short after that the market grabbed the liquidity and gave us a clean entry to take.
Follow for more!