OIL: THE CHART THAT COULD TIP THE WORLDWTI Crude just bounced hard off the $65 channel support, tagging resistance at $76 — and what happens next isn’t just about price. It’s about power.
Zoom into this chart:
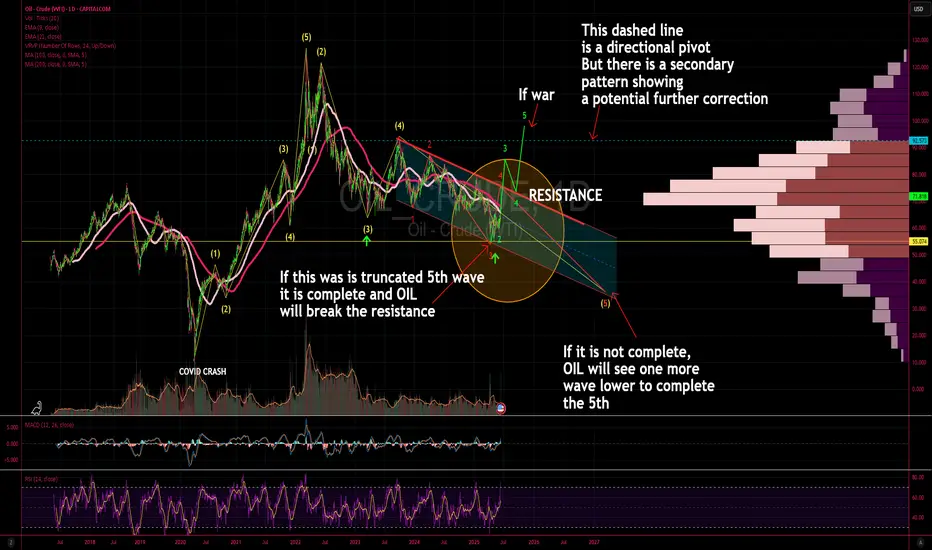
We're sitting at a directional pivot with two possible outcomes:
1️⃣ If this was a truncated 5th wave, the structure is complete. Any further war escalation could be the catalyst for oil to break resistance — dragging down risk assets, including CRYPTOCAP:BTC and equities.
2️⃣ If wave 5 isn’t done, we’ll likely see one more sharp leg down before oil launches. Either way, this is a high-stakes Elliott Wave setup with global macro consequences.
Chart with FIB Levels:
You'll see the wave I’ve marked (3) is messy, and on lower timeframes, that may hint at a truncated move worth watching.
Why this matters:
Over 20% of global oil flows through the Strait of Hormuz, a critical chokepoint controlled by Iran. If conflict escalates, that line gets squeezed… and oil price explodes.
Price to watch:
$76 resistance.
If oil breaks, the markets will react fast.
If it fails, we might get one more correction and maybe some relief from the sideways pain we’ve seen across risk assets.
Remember the COVID Crash?
Oil literally went below zero in April 2020. That wasn't just a chart anomaly, it was a global demand collapse. Traders were paying to get rid of oil because there was nowhere to store it. That moment marked a generational low, and what followed was a powerful multi-year 5 wave up.
Now look where we are:
That same COVID low helped form the base of the current Elliott Wave structure. The fact we’re back testing levels that once sparked global panic is no coincidence.
If you’ve been here before, you’ll see the signs. The charts always leave traces. And if this is the end of wave 5, it could be the start of a whole new macro move.
TLDR:
Stop trading headlines.
Trade the structure.
This chart is telling us everything.
Energy Commodities
Trump’s “ambiguous” statement, where will oil prices go?
💡Message Strategy
Trump's remarks are repeated, and the geopolitical premium still limits the downward space of oil prices
Trump said that the United States "may or may not" join Israel's actions against Iran. Analysts pointed out that if the United States is officially involved in the conflict, oil prices may rise by $5; if peace talks are launched, they may fall by the same amount.
The geopolitical focus is still on the Strait of Hormuz
Iran produces 3.3 million barrels of oil per day, but more importantly, about 19 million barrels of crude oil are transported through the Strait of Hormuz. The escalation of the conflict may threaten the safety of the waterway.
The Fed's policy turn to dovish failed to effectively support oil prices
Although the Fed hinted that it may cut interest rates twice this year, Chairman Powell emphasized that the decision still depends on inflation data, and Trump's upcoming new round of import tariffs may push up prices and limit the boost in oil demand brought about by loose policies.
📊Technical aspects
From the daily chart level, crude oil prices in the medium term broke through the upper resistance of the range and tested a new high of 75.50. The moving average system is in a bullish arrangement, and the medium-term objective trend is in the direction.
The current trend is in the upward rhythm of the main trend. The MACD indicator fast and slow lines overlap with the bullish column above the zero axis, indicating that the bullish momentum is currently full, and it is expected that the medium-term trend is expected to usher in a wave of rising rhythm.
💰Strategy Package
Long Position:73.00-73.50,SL:72.50
The first target is around 75.50
The second target is around 76.50
If the situation in the Middle East escalates, the room for crude oil to rise will be enlarged

Weekly Market Forecast: Wait To Buy S&P, NAS, & OIL!In this Weekly Market Forecast, we will analyze the S&P 500, NASDAQ, DOW JONES, Gold and Silver futures, for the week of June 22-28th.
The tensions in the Middle East take center stage, as Iran has signaled they are willing to discuss limitations on there Uranium enrichment program. This could allow outflows from safe havens and inflows to risk assets.
Keep and eye on Silver for shorts, in the near term, though.
Let's see if the market tilts its hand early next week. Monday should bring clarity.
Wait for confirmations before entering trades. A break of structure would be ideal! Enter on the pullback to that structure point.
Enjoy!
May profits be upon you.
Leave any questions or comments in the comment section.
I appreciate any feedback from my viewers!
Like and/or subscribe if you want more accurate analysis.
Thank you so much!
Disclaimer:
I do not provide personal investment advice and I am not a qualified licensed investment advisor.
All information found here, including any ideas, opinions, views, predictions, forecasts, commentaries, suggestions, expressed or implied herein, are for informational, entertainment or educational purposes only and should not be construed as personal investment advice. While the information provided is believed to be accurate, it may include errors or inaccuracies.
I will not and cannot be held liable for any actions you take as a result of anything you read here.
Conduct your own due diligence, or consult a licensed financial advisor or broker before making any and all investment decisions. Any investments, trades, speculations, or decisions made on the basis of any information found on this channel, expressed or implied herein, are committed at your own risk, financial or otherwise.

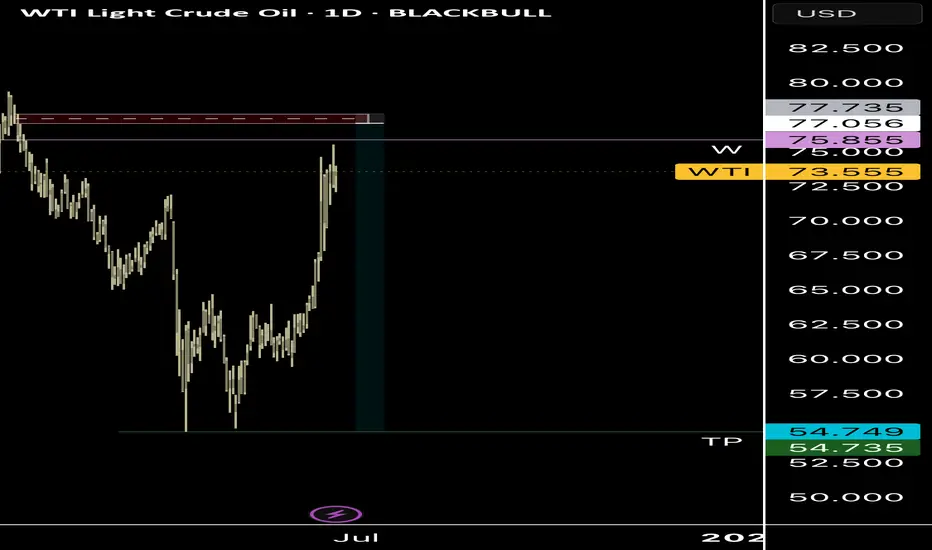
WTI Short PositionBelieve stability within the Middle East market will bring the price down so it could rebound back up once liquidity has been cleared
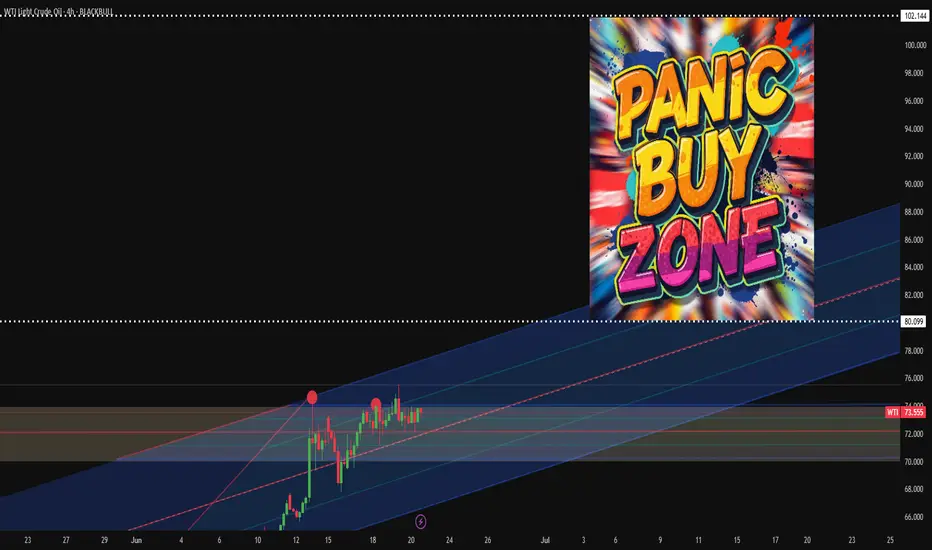
Oil panic buying after Iran Strikes?President Donald Trump has confirmed that the U.S., in coordination with Israel, has conducted three strikes on Iranian nuclear facilities.
Will there be panic buying of WTI and Brent at the open?
In response, Iran’s parliament has approved a proposal to close the Strait of Hormuz, a key global oil shipping route. The final decision lies with Iran’s Supreme National Security Council and Supreme Leader Ayatollah Ali Khamenei.
If a blockade is enforced, oil prices could rise sharply. ClearView Energy Partners estimates a short-term closure could add between $8 and $31 per barrel. JP Morgan has suggested that a full-scale conflict and complete shutdown could drive prices to $130.
Natural Gas | Oil | Dollar | Silver | Gold Price Forecast.Natural Gas | Oil | Dollar | Silver | Gold Price Forecast.
NYMEX:NG1! NYMEX:CL1! COMEX:GC1! COMEX:SI1!

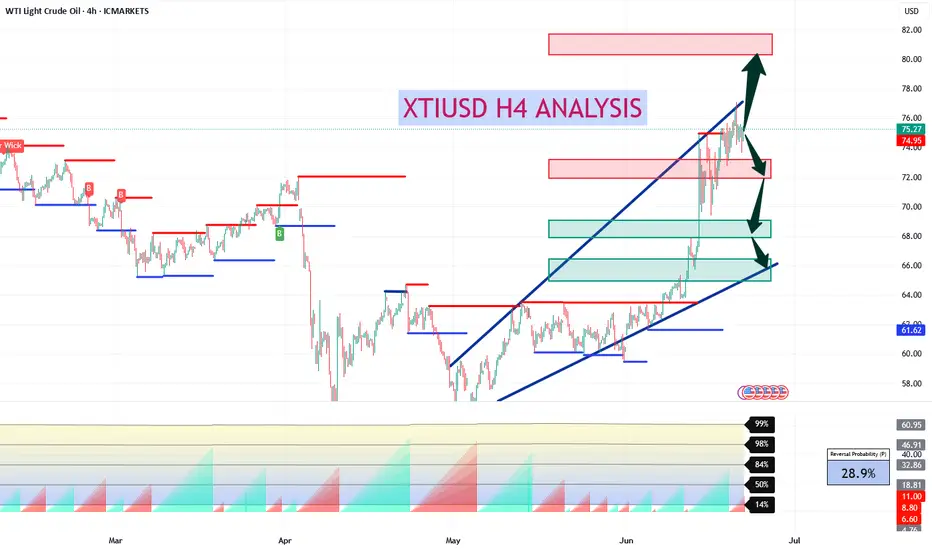
XTIUSD H4 AnalysisXTIUSD Showing a bearish Flag. If it breaks this zone above, Most probably can fly upto 81.00 and higher. If no, Can rally between 72, 68 or even 66. Trading Analysis from 23-06-25 to 27-06-25. Take your risk under control and wait for market to break support or resistance on smaller time frame. Best of luck everyone and happy trading.🤗
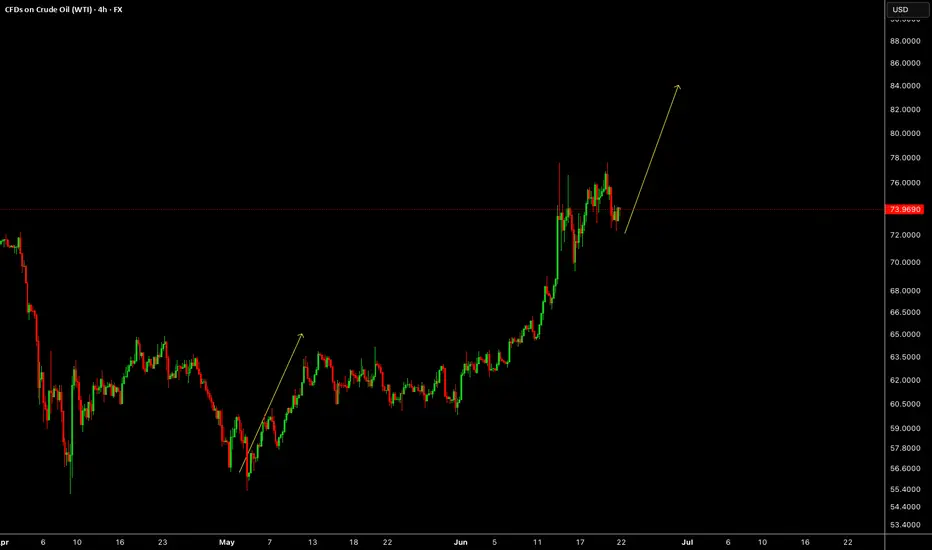
US-Oil will further push upside After Testing TrendlineHello Traders
In This Chart XTIUSD HOURLY Forex Forecast By FOREX PLANET
today XTIUSD analysis 👆
🟢This Chart includes_ (XTIUSD market update)
🟢What is The Next Opportunity on XTIUSD Market
🟢how to Enter to the Valid Entry With Assurance Profit
This CHART is For Trader's that Want to Improve Their Technical Analysis Skills and Their Trading By Understanding How To Analyze The Market Using Multiple Timeframes and Understanding The Bigger Picture on the Charts
Missiles Flying! Buy OIL, GOLD! Sell the Stock Indices!In this Weekly Market Forecast, we will analyze the S&P 500, NASDAQ, DOW JONES, Gold and Silver futures, for the week of June 22-28th.
This is a revision of the Weekly Forecast I posted yesterday! With the latest US strikes into Iran nuke sites, the fundamentals go from zero to a hundred! Risk on turns immediately to risk off, and gap opens are likely to present themselves.
Look to long the safe havens and short the equities until tensions ease.
Enjoy!
May profits be upon you.
Leave any questions or comments in the comment section.
I appreciate any feedback from my viewers!
Like and/or subscribe if you want more accurate analysis.
Thank you so much!
Disclaimer:
I do not provide personal investment advice and I am not a qualified licensed investment advisor.
All information found here, including any ideas, opinions, views, predictions, forecasts, commentaries, suggestions, expressed or implied herein, are for informational, entertainment or educational purposes only and should not be construed as personal investment advice. While the information provided is believed to be accurate, it may include errors or inaccuracies.
I will not and cannot be held liable for any actions you take as a result of anything you read here.
Conduct your own due diligence, or consult a licensed financial advisor or broker before making any and all investment decisions. Any investments, trades, speculations, or decisions made on the basis of any information found on this channel, expressed or implied herein, are committed at your own risk, financial or otherwise.

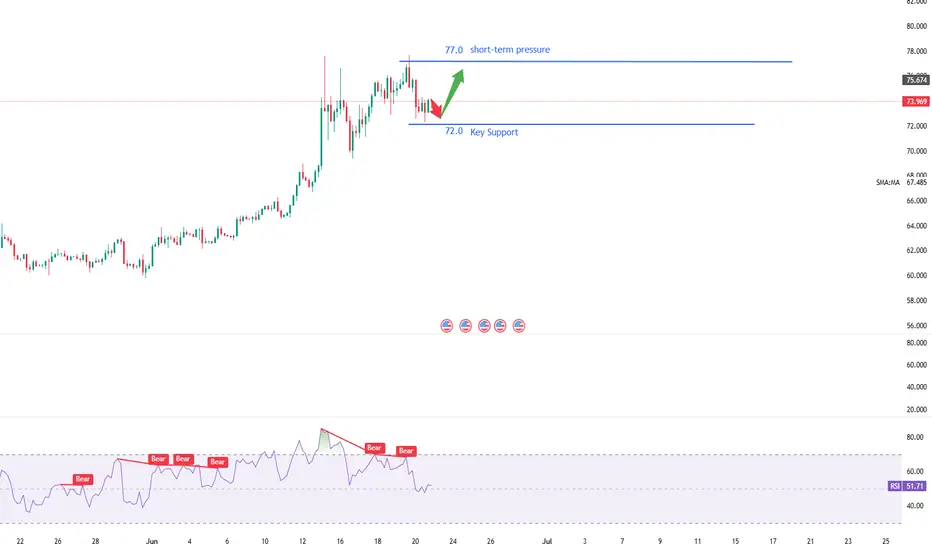
Crude Oil Market Trend Forecast for Next WeekThe oil price continued its upward trend this week, despite a brief correction on Friday. As of Friday's Asian session, Brent crude oil futures dropped by $1.57, or 2%, to $77.28 per barrel. However, the cumulative weekly gain reached 3.9%, marking three consecutive weekly increases. Geopolitical risks continued to fuel market sentiment. Oil prices surged nearly 3% on Thursday after Israel bombed Iranian nuclear targets, following Iran's missile strikes on Israel after its earlier missile attack on an Israeli hospital. The focus of the current crude oil market has shifted entirely from supply-demand fundamentals to geopolitical risks. Although Iran's crude oil exports have not been substantially disrupted, investors have started to price in the worst-case scenario. If the situation further deteriorates and affects shipping routes through the Strait of Hormuz, global energy prices may face a new round of sharp volatility.
In the short term, oil prices still exhibit upward potential, with the current trend maintaining an overall upward trajectory. The MACD indicator's fast and slow lines overlap with bullish bars above the zero axis, signaling robust bullish momentum. This suggests that the medium-term trend is expected to usher in an upward rally.
you are currently struggling with losses,or are unsure which of the numerous trading strategies to follow,You have the option to join our VIP program. I will assist you and provide you with accurate trading signals, enabling you to navigate the financial markets with greater confidence and potentially achieve optimal trading results.
Trading Strategy:
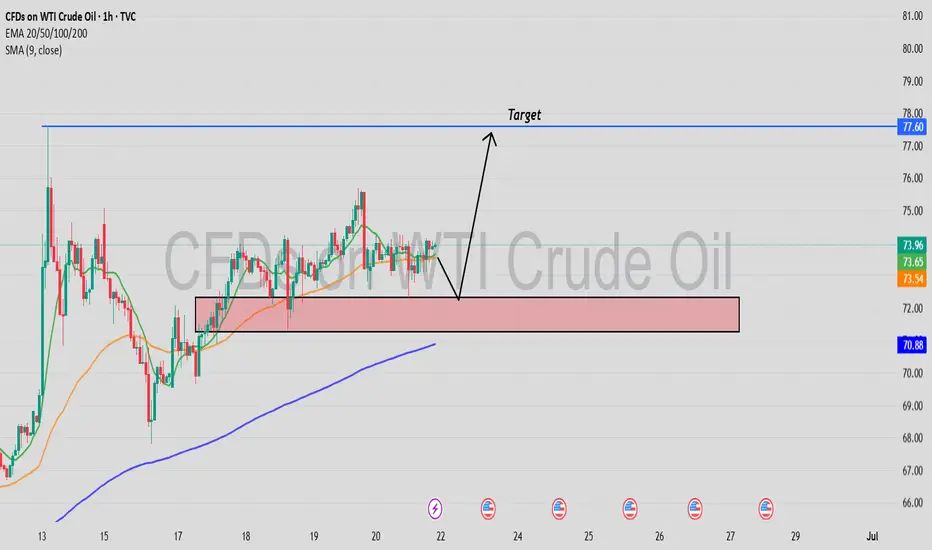
buy@72.0-72.5
TP:75.0-75.5
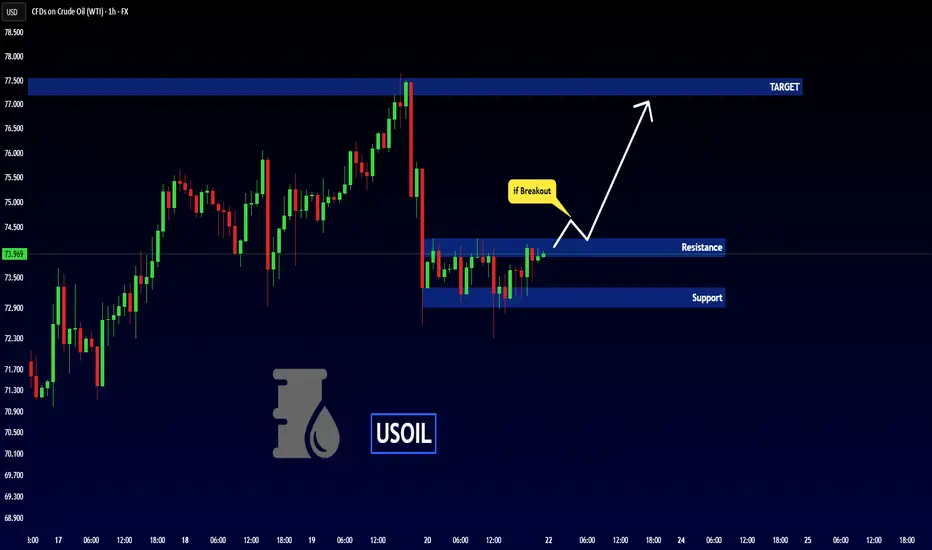
USOIL - Another Bullish Move!Hello Traders !
Amid escalating tensions between Iran and Israel and following US strikes on Iranian nuclear sites, the Iranian parliament has approved the closure of the Strait of Hormuz.
So, I expect another bullish move in USOIL price🚀
______________
TARGET: 77.200🎯
USOILUSOIL will be bullish this week due to geopolitics and especially Iran/Israel War and Hormuz Strait closure.
Disclosure: We are part of Trade Nation's Influencer program and receive a monthly fee for using their TradingView charts in our analysis.
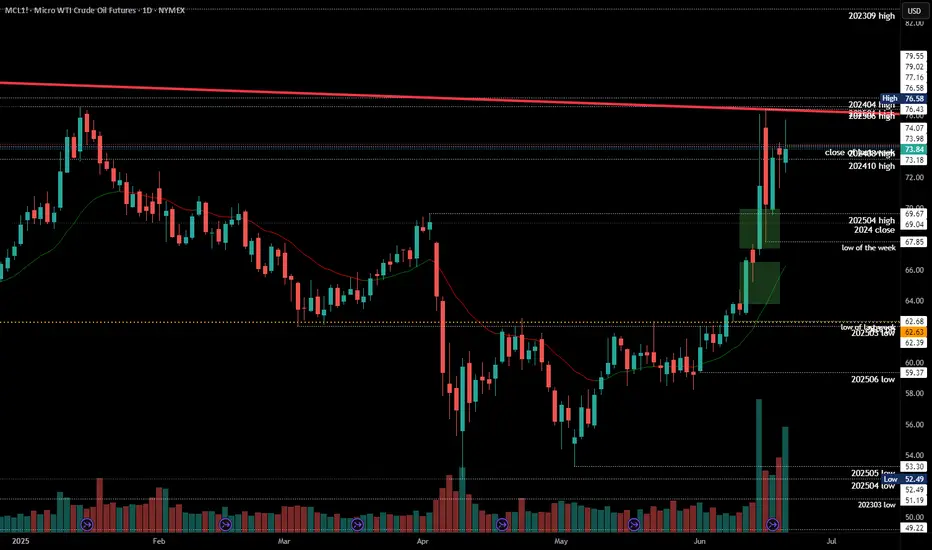
#202525 - priceactiontds - weekly update - wti crude oilGood Day and I hope you are well.
comment: Many gaps on different time frames and I only marked the ones from the daily. Next targets above for the bulls are 80 and the 2023-09 high at 82.91. I think we can see a futures gap up above 81 and then another huge pullback. Supply shock for Oil is still not there or we would not see the market pull back that much. Given the current macro risk we can only expect higher prices but the swings are too wild for me tbh.
current market cycle: bull trend but trading range on 1h tf
key levels: 67 - 83
bull case: Bulls have all the arguments on their side. Their only issue is that we are still seeing 5-10% intraday swings to both sides and only if the pull backs become smaller and we leave gaps behind, can we go meaningful higher and stay there. We have two open gaps on the daily chart but market would have to stay above 70 now to confirm them. 77 is the next target for the bulls which would be a higher high above the 2024-04 high.
Invalidation is below 70 - if we drop below, we most likely continue sideways inside the big range until we maybe get another big breakout above
bear case: US bombs on Iran. Interesting to see if we stay below 77 and move sideways. I can not see it but I obviously did not saw the 11% pullback on Monday as well. That was insane. Best bears can hope for is to move sideways and continue with the deep pullbacks. Bears can also make big money on these wild swings, which is not something seen in strong bull trends.
Invalidation is above 77
short term: Bullish but too cautious to trade it. Future gap ups were sold heavily and market has not found acceptance above 73 for the entire week. Still expecting 77 to get hit and there is no reason why we can’t see 80$ on oil over next 2 weeks.
medium-long term - Update from 2025-06-22: No bigger opinion other than “don’t be a bear here”. No idea if market can sustain the buying and stay above 70 for longer or even 80 for that matter. Too many big risks which will move the market big time.
Oil potential bull runOil has taken out a long term liquidity level and had a market shift, the growing tensions between Israel and Iran may fuel a demand for oil as well as oil being under valued when all other markets had been inflated due to inflation. We will see how this market moved but it is very interesting to have a look out for bullish opportunities to the upside.
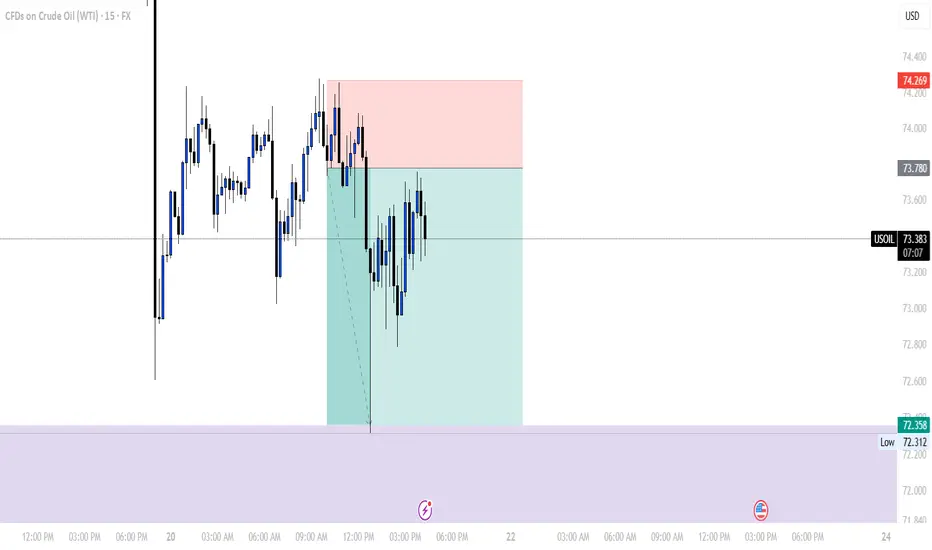
USOIL: Strong Bearish Sentiment! Short!
My dear friends,
Today we will analyse USOIL together☺️
The in-trend continuation seems likely as the current long-term trend appears to be strong, and price is holding below a key level of 73.969 So a bearish continuation seems plausible, targeting the next low. We should enter on confirmation, and place a stop-loss beyond the recent swing level.
❤️Sending you lots of Love and Hugs❤️
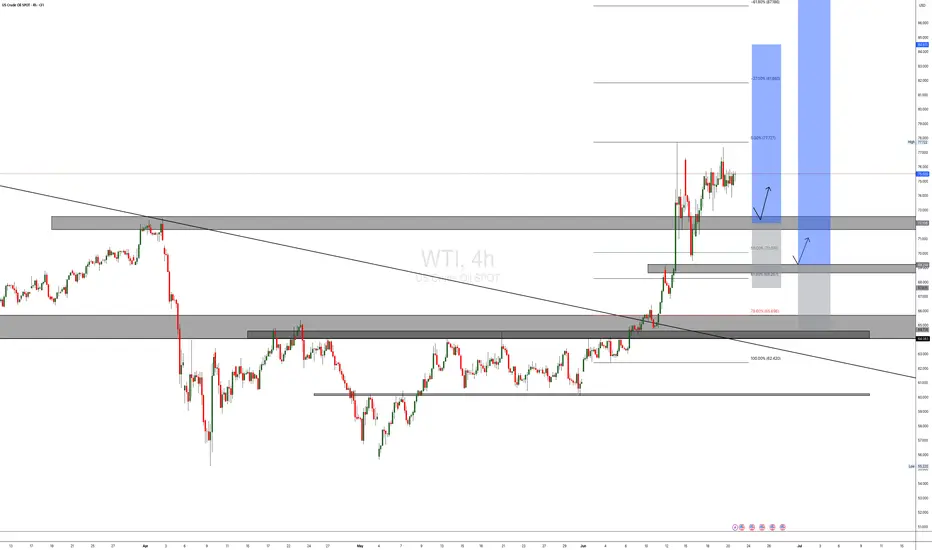
WTI POSSIBLE TRADE SETUPPotential Trade Setup on WTI
WTI has been on a strong 2-week rally, following the geopolitical escalation where Israel launched a preemptive attack on Iran. This event sparked a 2% surge, keeping prices hovering around $77 for the past two weeks.
Despite the bullish momentum, I am anticipating a healthy pullback before looking to engage.
My eyes are on two key zones:
- April High Region (Previous resistance turned support)
- 50% Fibonacci Retracement (Measured from recent rally low to high)
🧭 Trading Plan:
1. BUY: is currently the only play, and as I anticipate for a two-level of pullback on the 4H chart.
🟢 Risk-to-Reward:
Targeting 1:3 R/R on either entry.
BRIEFING Week #25 : Heading into Summer ModeHere's your weekly update ! Brought to you each weekend with years of track-record history..
Don't forget to hit the like/follow button if you feel like this post deserves it ;)
That's the best way to support me and help pushing this content to other users.
Kindly,
Phil

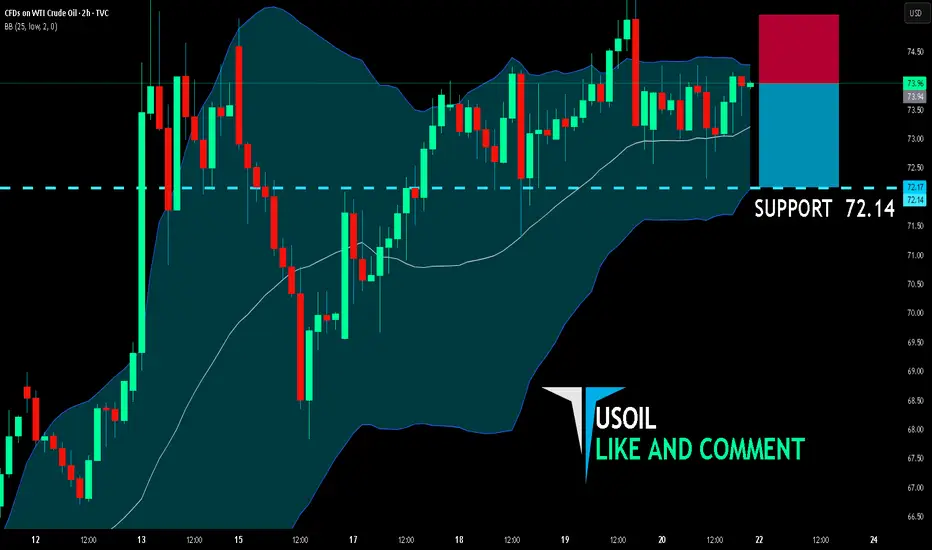
USOIL BEST PLACE TO SELL FROM|SHORT
USOIL SIGNAL
Trade Direction: short
Entry Level: 73.94
Target Level: 72.14
Stop Loss: 75.12
RISK PROFILE
Risk level: medium
Suggested risk: 1%
Timeframe: 2h
Disclosure: I am part of Trade Nation's Influencer program and receive a monthly fee for using their TradingView charts in my analysis.
✅LIKE AND COMMENT MY IDEAS✅
Navigating a Pullback in Natural GasNatural gas prices have been on a wild ride lately, with a recent pullback raising questions about the future of this energy source. This video provides insights into navigating this market volatility, offering actionable strategies for live trading in the midst of uncertainty.
Current weather forecasts for the U.S. show neither extreme heat nor cold—limiting heating or cooling demand. This typical spring-to-summer lull supports low prices .
Although rig counts in the U.S. are falling—the latest count shows an 8‑week decline—production remains ample. Storage levels remain healthy, and oversupply worries persist .
Natural gas rallied earlier today but faced resistance at the $4/mmBtu mark—a major psychological barrier. After hitting that ceiling, prices gave back gains, a typical sign of "rally exhaustion"

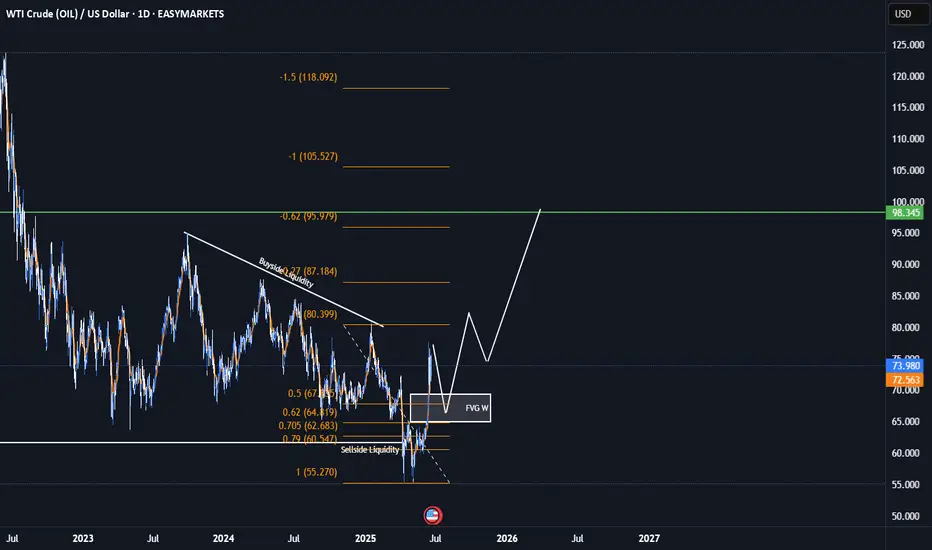
$100 a barrel coming soon for Crude oil futures In this video we focus on the current accumulation in the oil chart and the prospect of higher prices ahead .
I highlight how the respect of the previous quinquennial pivots gave us a 45% move to the upside in the past 8 weeks .
Looking ahead on the monthly timeframe we have the following confluences above the current price of $75 .
Above the current pa we have the point of control at $ 88 and the avwap at $97, if we can reclaim the poc I think we will continue to push up to the fib levels that I have mentioned in the video.
In addition to the above we also have the decennial pivots at $107/$112 alongside the value area high .
All of this validates for me why oil will be pushing back up throughout the course of the year .
Tools used in the video
Tr pocket , pivots , fived range volume profile and fib expansion

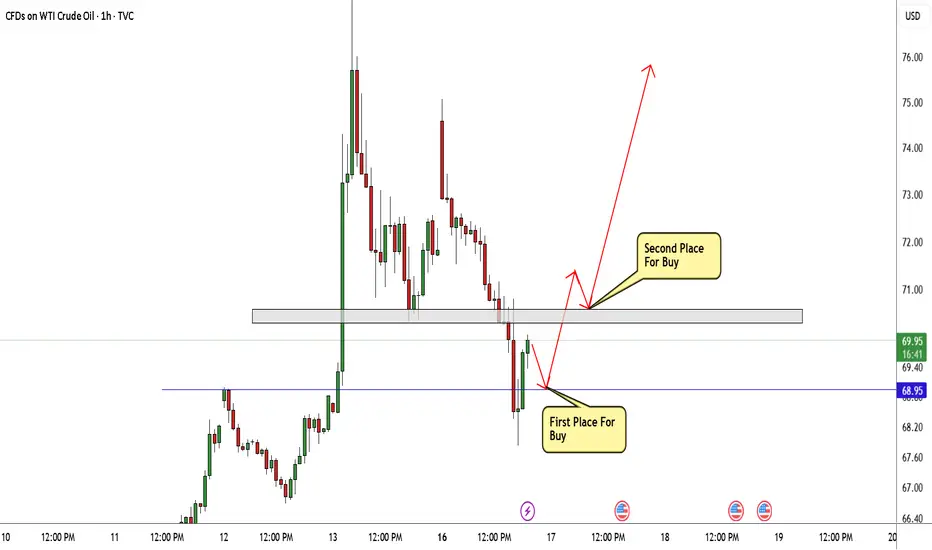
OIL 2 Best Places For Buy Very Clear , Don`t Miss This 1000 PipsHere is my opinion on oil , we have a very aggressive movement to upside and this is normal right now , i`m looking to buy this Pair if the price go back to retest my support and this will be the best place to buy it for me , and if the price moved directly without retest it i will wait the price to break the other res and then i can enter a buy trade and targeting the highest level the price touch it , also if the price go back to retest my support and go up and closed above the other res i will add one more entry with the same target.
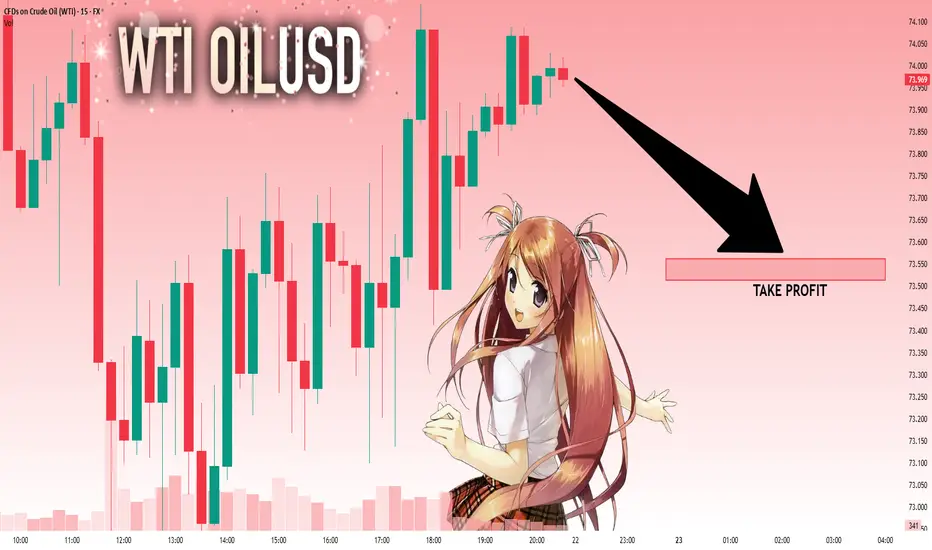
TP REACHED ON OUR TRADE ON OILThis morning I posted to sell on Crude Oil, and our TP got filled to close the week with 5 profitable days strike.
Follow for more!
Middle East Tension: Read This Before You Trade today⚔️🕊️💣 Middle East Tension: Read This Before Markets close for the Weekend 🌍🔥✌️
Video:
Hey traders,
Today’s landscape is delicate and raw: we stand between a possible US strike on Iran and a chance for leaders to step back from the edge. Many are asking: Should I bet on gold? Should I short the indices? Should I buy oil?
Here’s my honest read, straight from today’s video (which I highly recommend you watch for full context 📺):
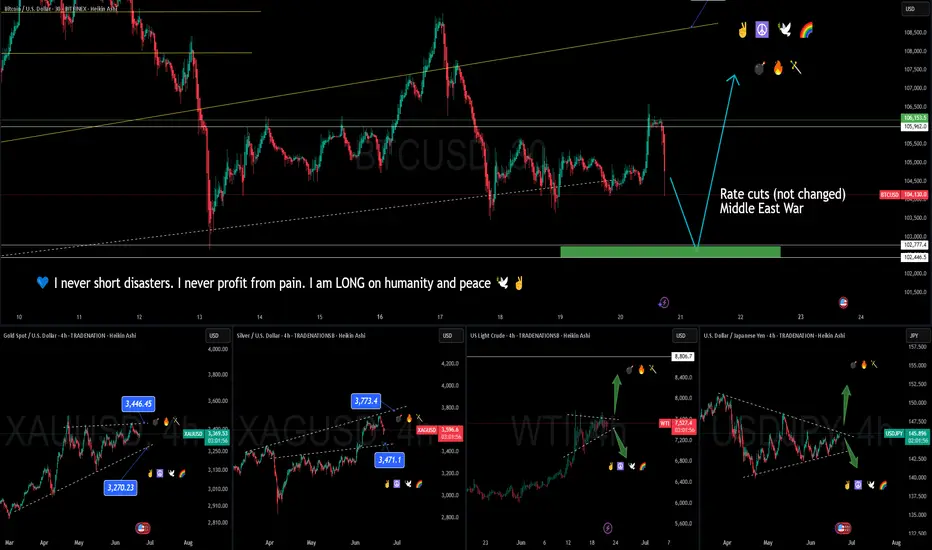
👉 Bitcoin (BTC)
Still ranging sideways. The last move hit my resistance zone perfectly. For now, BTC keeps its cool — but watch out: global fear can spark sudden moves, or the opposite, a liquidity crunch.
👉 Gold & Silver
Yes, they’re classic safe havens — but don’t fall for the textbook trap. When true chaos strikes, big players often sell profitable gold positions to cover losses elsewhere. So an initial spike is possible, but deep pockets can reverse it fast. This is why I’m cautious: I do not expect a guaranteed pump on gold or silver.
👉 Crude Oil (WTI)
The chart says it all: any strike in the Middle East fuels oil prices fast. But as I’ve always said — I do not long oil during human tragedy. Ethics over easy pips.
👉 Indices & USDJPY
Gaps are likely. Risk assets may get hammered if bombs fall. If leaders choose dialogue instead, expect a risk-on rebound. The USD stays a wildcard: trust in the US remains, but shocks test that trust.
👉 Airlines Pausing Flights?
Yes — major airlines are avoiding the Gulf. That alone signals how real this risk is.
✅ My plan is clear:
I never short disasters. I never profit from pain. I am LONG on humanity and peace. I’d rather lose a trade than wish for blood in the streets.
I do have some carefully calculated positions open tonight — fully risk-managed and small-sized. If Monday gaps bless me, fine. If peace wins and my trades lose? Even better.
👉 Watch the full video for my live charts, context, and unfiltered thoughts.
This text is just a recap — the full idea is already posted as a video.
Stay sharp. Stay ethical. Protect your capital and your soul — one good trade is never worth your humanity.
One Love,
The FXPROFESSOR 💙
Disclosure: I am happy to be part of the Trade Nation's Influencer program and receive a monthly fee for using their TradingView charts in my analysis. Awesome broker, where the trader really comes first! 🌟🤝📈