SELL USOILOur trade for today is on OIL as usual, in which we're going short after that the market grabbed the liquidity and gave us a clean entry to take.
Follow for more!
Energy Commodities
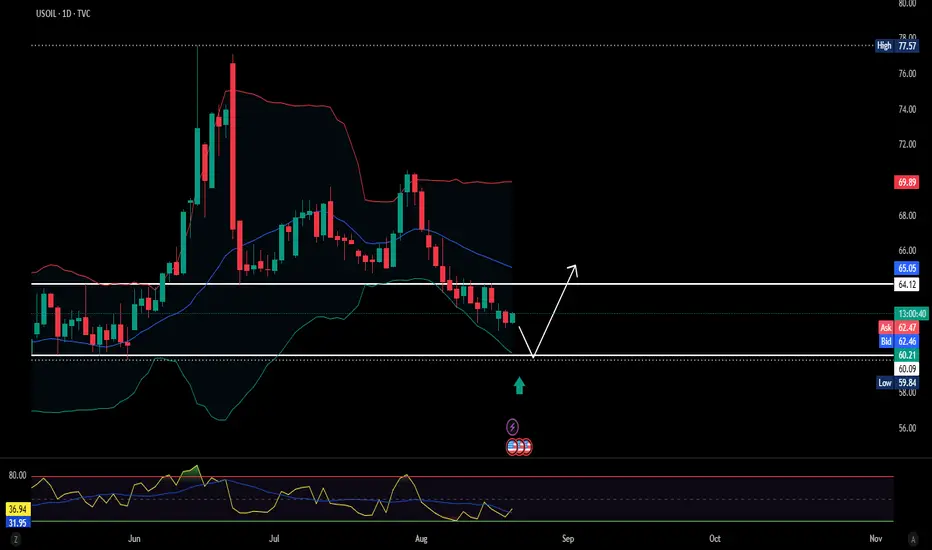
USOIL - Swing IdeaSo I am just speculating, price is kind of rangebound for now but hear me out.
The Asskonhole tomorrow with the lizard people may or may not provide the fuel for the price to revisit ~60 area and we could see a nice bounce.
I mean I don't see why we can't revisit ~64-65 earlier but we would need some sort of war news or supply shock.
this is purely speculation and NFA
New Bear Market? Heavy Tech SelloffToday the markets were shattered by weakness in mega cap tech.
All major leading companies in the QQQ were severely down.
We saw the majority of the S&P 500 sectors green with health care leading the charge.
Despite all indices closing negative this was not a full fledge market sell.
Commodities were hit across the board. Gold, Nat gas, Oil, Uranium, Silver were all down.
It seems the market is de risking into J Powell Jackson Hole meeting on Thursday / Friday.
Today we closed out NASDAQ:MSFT NASDAQ:PLTR short & trimmed AMEX:MSOS puts for over 105%
We were very active on the option and swing trading side of the market.

India’s Andaman Sea Oil Prospect: A Strategic Inflection PointThe Discovery: Unprecedented Potential
In mid‑June 2025, India’s Union Petroleum and Natural Gas Minister, Hardeep Singh Puri, announced that India might be on the threshold of discovering a Guyana‑scale oil field in the Andaman Sea, with estimated reserves of around 184,440 crore litres (approximately 1.844 trillion litres) of crude oil. Should exploration confirm commercial viability, Puri suggested this find could elevate India to a $20 trillion economy—a bold leap from its current size of approximately $3.7 trillion.
Economic Leverage: What a Discovery Could Unlock
A discovery of this magnitude has several transformative implications:
Energy Independence: India imports roughly 90% of its oil and about 50% of its natural gas, a dependency that strains foreign exchange reserves. Indigenous production from Andaman could significantly reduce this reliance.
Boost to GDP Growth: At face value, such reserves could be seen as a catalyst for exponential GDP growth—hence the “$20 trillion economy” projection. However, this estimate is largely speculative, hinging on assumptions around extraction timelines, global oil demand, reinvestment, and economic multipliers.
Fiscal and Credit Gains: Lowering oil import bills may free up fiscal resources, strengthen the current account, and improve sovereign credit metrics.
Strategic Fit in India’s Energy Transition Strategy
India’s broader energy goals are shifting:
Deepwater Exploration Initiative: As recently as August 2025, Prime Minister Modi highlighted a policy push towards deep‑sea oil exploration and nuclear expansion to reduce dependence on imports and enhance energy security.
Diversification: Even if oil demand plateaus or declines—as argued by experts due to the global shift to renewables—the discovery still represents strategic insurance during the transition period.
Strategic Geography and Infrastructure Implications
Geopolitical Leverage: The Andaman Sea and the adjoining Andaman and Nicobar Islands control key shipping lanes such as the Ten Degree Channel, which connects to the Malacca and Singapore Straits—a major chokepoint through which global trade passes.
Infrastructure Synergy: The ongoing Great Nicobar Island Development Project, with plans for ports, airports, and power infrastructure, could complement energy ambitions by improving access and logistics in the region.
Challenges and Caveats
A host of practical and theoretical hurdles remain:
Exploration Costs & Viability: Deep‑sea drilling is capital‑intensive, with execution risks and regulatory complexities.
Market Uncertainty: Long‑term oil demand may taper as renewables gain traction. The economic upside depends on effective commercialization and resource reinvestment.
Environmental Sensitivities: The Andaman region harbours rich marine ecosystems and tribal communities. Infrastructure expansion may generate ecological and social pushback (echoed in debates around the Great Nicobar development).
Infrastructure Readiness: Transport, refining capacity, export pipelines, and port facilities will need substantial enhancement to process and deliver oil to markets efficiently.
Strategic Outlook and Policy Imperatives
For India to translate this potential oil bounty into sustainable growth:
Rigorous Verification: Prioritize economic feasibility studies, environmental impact assessments, and phased exploration.
Balanced Energy Policy: Use revenues to fund renewables, reduce carbon footprint, and build resilience—rather than doubling down solely on hydrocarbons.
Infrastructure Investment: Expand refining capability, logistics, and export terminals in an eco-sensitive, inclusive manner.
Regional Development: Harness this momentum to boost local economies—creating jobs, improving connectivity, and uplifting communities in the Andaman and Nicobar region.
Geostrategic Positioning: Take advantage of Andaman’s location to secure sea lanes and enhance India’s Indo-Pacific posture.
While headlines envisioning a fivefold GDP surge remain speculative, the preliminary discovery in the Andaman Sea represents a promising and strategically significant opportunity. If proven commercially viable and paired with thoughtful policy, infrastructure, and environmental stewardship, it could be a cornerstone in India’s quest for energy independence and economic transformation. But prudent, phased, and balanced planning will be essential to realize this potential responsibly.
------------------------------------------------------------------------
The article and the data is for general information use only, not advice!
Risk Disclaimer!
General Risk Warning: Trading on the Financial Markets, Stock Exchange and all its asset derivatives is highly speculative and may not be suitable for all investors. Only invest with money you can afford to lose and ensure that you fully understand the risks involved. It is important that you understand how Trading and Investing on the stock exchange works and that you consider whether you can afford the high risk of loss.
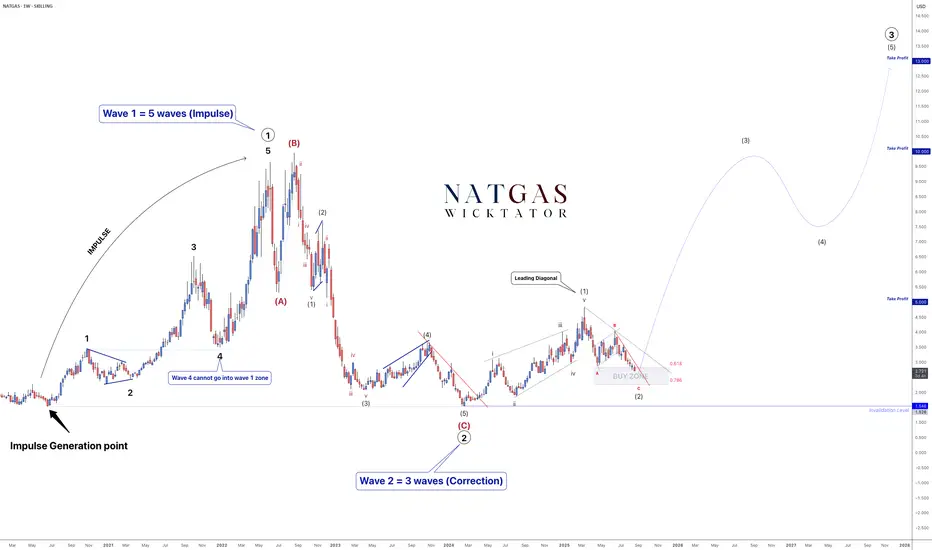
NATGAS - Catch The Impulse!As Wave Traders, our job is to spot corrections and catch the impulse, because that’s where the biggest moves happen.
On NATGAS, we completed Wave 1 with a leading diagonal, and are now finishing Wave 2 (an ABC correction). Once corrections are done, the next phase is Wave 3 - historically the longest and strongest wave in Elliott Wave Theory.
We've almost completed wave 2 and looking for a breakout for wave 3, which is the longest wave.
Trade Idea:
- Watch for break of the red trendline to indicate the start of wave 3
- enter with stops below breakout or below invalidation
- Targets: 5, 10, 13
NATGAS 12H Chart:
We'll be looking to enter on break of the red trendline with stops below breakout.
This setup is a textbook example of how Elliott Wave helps us prepare - not chase - the market.
Goodluck and as always, trade safe!
Devon Energy: A High-Dividend Setup Worth WatchingA shale specialist with big dividends, when the price is right.
Devon Energy is a U.S.-based oil and gas company focused on domestic shale production, particularly in the Delaware Basin, one of the most cost-efficient regions. It’s known for paying a “variable dividend”, meaning payouts rise when profits rise, and shrink when oil prices fall.
With its smaller size, Devon is more volatile than oil giants, but also more agile when prices are strong.
✅ Key Strengths:
- High dividends when oil prices are elevated.
- Efficient, low-cost production in the Delaware Basin.
- Strong upside when Brent crude rises.
⚠️ Potential Risks:
- Dividends decrease sharply if oil prices fall.
- More price swings due to smaller market cap and higher sensitivity.
📈 Technical View
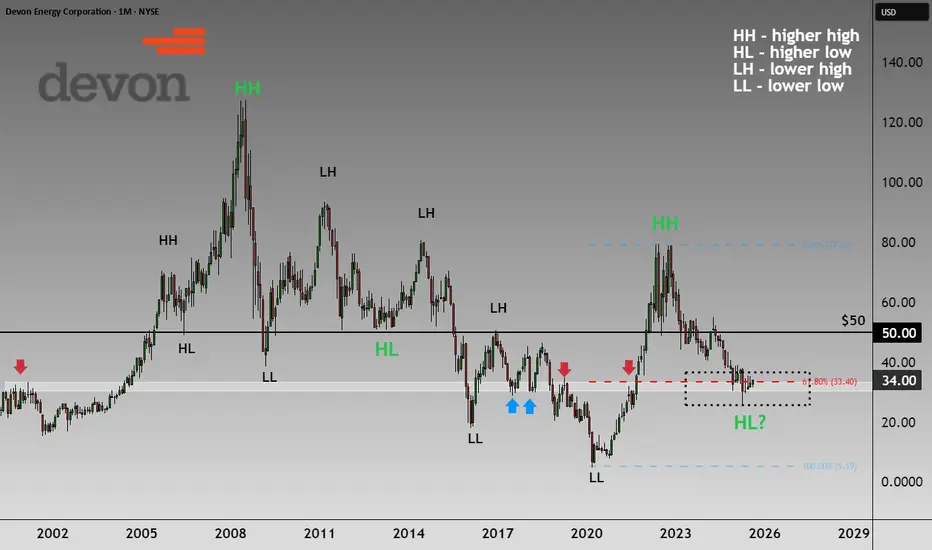
As someone who appreciates structure in technical analysis, I have to say: this chart is a gem. Clean movements, clear tops and visually logical price behaviors.
Let me break it down:
From its all-time high in 2008, DVN went through a long downtrend — making a series of lower highs (LH) and lower lows (LL). For over a decade, buyers couldn’t gain control, even for short-term higher highs.
But that changed in 2020.
That rally brought a long-awaited structural shift: a higher high (HH), meaning buyers finally pushed the price above a previous high. The trend reversed, and the sentiment flipped.
Now what?
The stock has done a textbook pullback, a normal retracement after a strong move.
It currently sits at a critical technical confluence zone:
- The 61.8% Fibonacci retracement (often referred to as the “golden ratio”)
- A well-defined horizontal support level
- Structurally healthy trend
- Clear prior breakout
👉 Technically, this is a sound setup: structure + support + healthy trend. If buyers defend here, upside potential is strong.
Regards,
Vaido
This post is for educational purposes only and reflects my personal opinion, not investment advice.
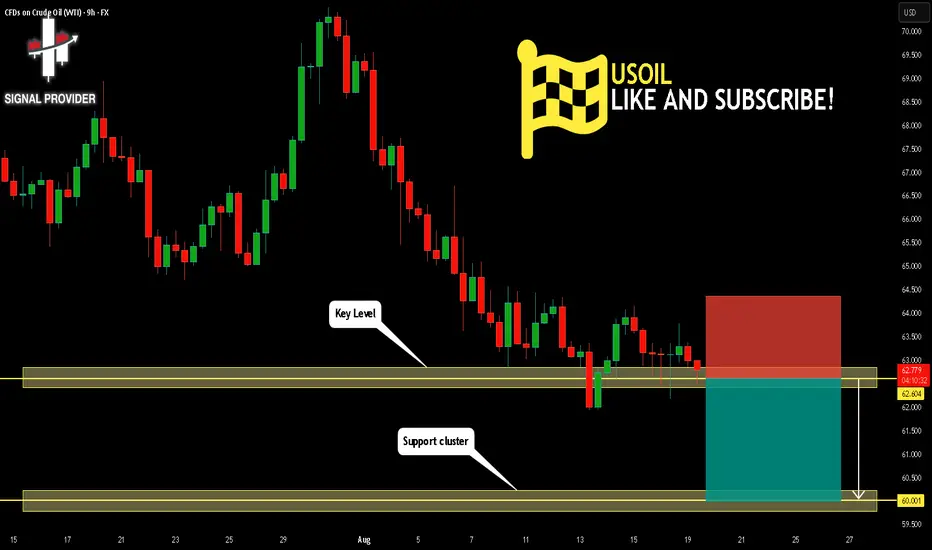
USOIL Will Move Lower! Sell!
Please, check our technical outlook for USOIL.
Time Frame: 9h
Current Trend: Bearish
Sentiment: Overbought (based on 7-period RSI)
Forecast: Bearish
The market is trading around a solid horizontal structure 62.604.
The above observations make me that the market will inevitably achieve 60.001 level.
P.S
We determine oversold/overbought condition with RSI indicator.
When it drops below 30 - the market is considered to be oversold.
When it bounces above 70 - the market is considered to be overbought.
Disclosure: I am part of Trade Nation's Influencer program and receive a monthly fee for using their TradingView charts in my analysis.
Like and subscribe and comment my ideas if you enjoy them!
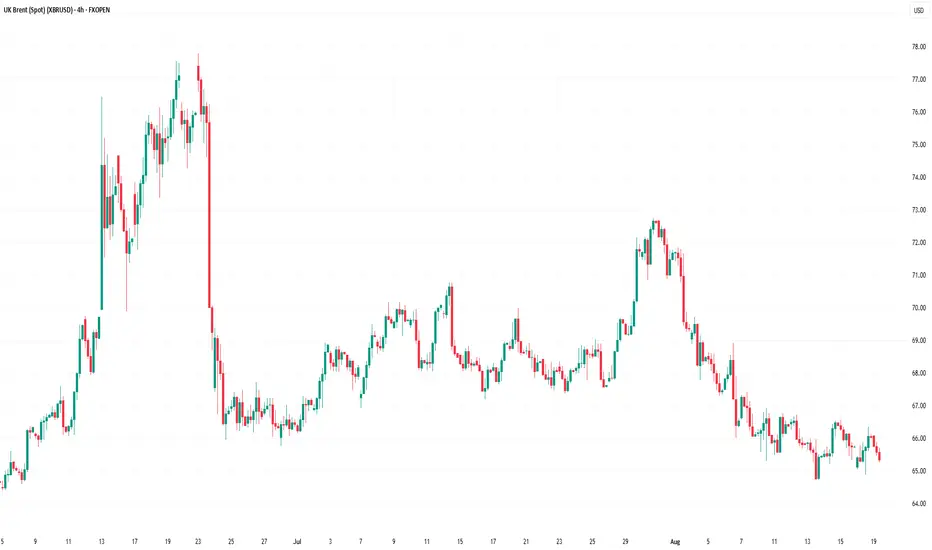
XBR/USD Chart Analysis: Brent Crude Nears Its Lowest LevelXBR/USD Chart Analysis: Brent Crude Nears Its Lowest Level Since Early Summer
According to the XBR/USD chart, this morning (19 August) Brent crude oil price is showing bearish momentum, moving towards its lowest level since early summer (set last week). The key bearish drivers in the market include:
→ OPEC+ policy aimed at increasing production;
→ expectations that negotiations to end the war in Ukraine could lead to the lifting of sanctions on Russian oil exports, which would further expand global supply.
Technical Analysis of the XBR/USD Chart
In our analysis on 5 August, we noted that:
→ Brent crude had fallen to an important support level (marked in blue), which held throughout July;
→ a bearish breakout attempt below the blue support line was possible.
Indeed, in early August the price confirmed a bearish breakout of the blue line, accompanied by signs of rising volatility – the line subsequently reversed its role from support to resistance (as indicated by the arrows on the left-hand side of the chart).
Bears then consolidated their position, continuing to apply pressure and forming a downward channel (shown in red). The question now is whether Brent prices can continue their decline.
From a bullish perspective, there are grounds for demand to strengthen around the key support level at $65.00 (as indicated by the arrows on the right-hand side of the chart):
→ during an attempt to move lower, the chart formed a bullish harami reversal pattern;
→ this level acted as support following the bearish gap at this week’s market opening;
→ yesterday’s long lower shadow highlights aggressive buying activity.
From a bearish perspective, August’s downtrend remains intact – though it may be losing momentum. Note the RSI indicator, which is gradually leaning towards the 50 level (if bears were still firmly in control, it would remain closer to oversold territory).
This suggests that bulls may attempt to seize the initiative and challenge the upper boundary of the descending channel, seeking to offset at least part of Brent’s nearly 10% decline since late July. In this scenario, the $67.40 level – where bears previously demonstrated strong control – could become a critical test of demand resilience.
Tomorrow’s key releases could significantly influence price action: crude oil inventories (15:30 GMT+3) and the FOMC minutes (21:00 GMT+3).
This article represents the opinion of the Companies operating under the FXOpen brand only. It is not to be construed as an offer, solicitation, or recommendation with respect to products and services provided by the Companies operating under the FXOpen brand, nor is it to be considered financial advice.
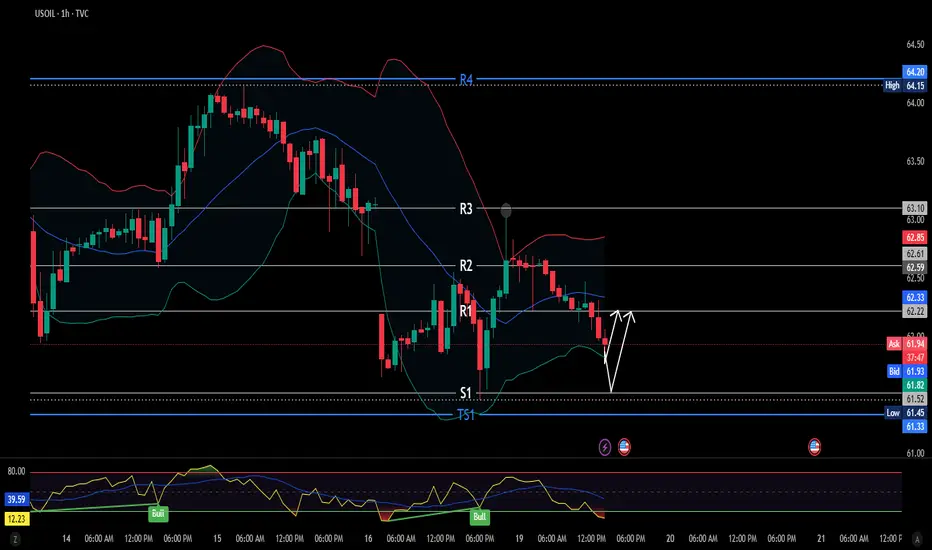
USOIL price reactionFVG on 15 min filled, now price could react here and we get a bounce to R1, 1H lower BB is essentially the bottom of the 15min FVG.
If price doesn't hold the 61.8-62 area, price could retrace to S1.
RSI on oversold 1H, 15 min
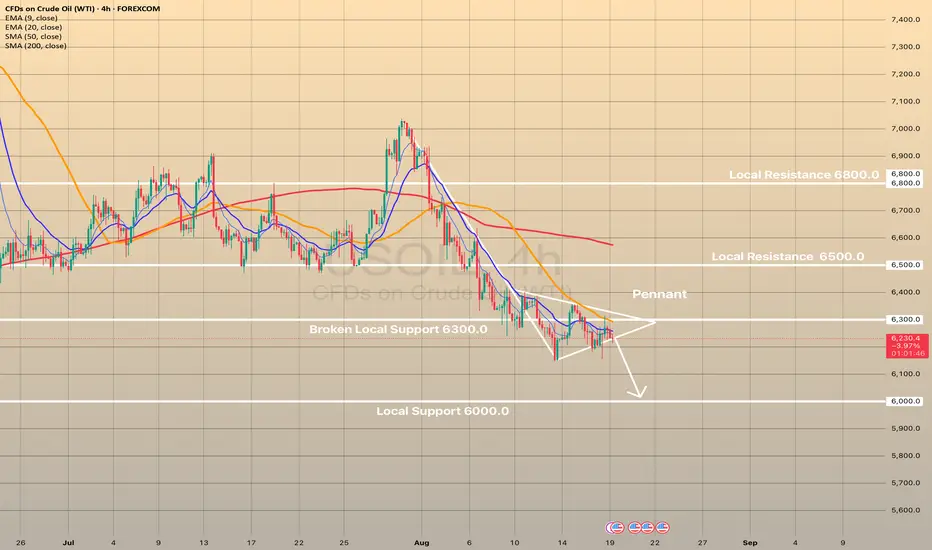
Oil Prices Drop on Russia-Ukraine Talks HopeOil prices decline in anticipation of potential negotiations between Russia and Ukraine
U.S. President Donald Trump announced plans to facilitate a meeting between Ukrainian President Volodymyr Zelenskiy and Russian President Vladimir Putin, following his Monday summit with Zelenskiy and European leaders. Zelenskiy called the talks with Trump “very productive,” highlighting discussions on U.S. security assurances for Ukraine. A resolution to the Russia-Ukraine conflict could lift sanctions on Russian energy exports, freeing up crude oil trade. Oil prices have dropped around 10% this month due to trade tensions and increased OPEC+ production.
Technically the price consolidates below the intermediate 6,300.00, forming the bearish pennant. Price is getting ready to decline. Here, the first target will be the major level of 6,000.00.
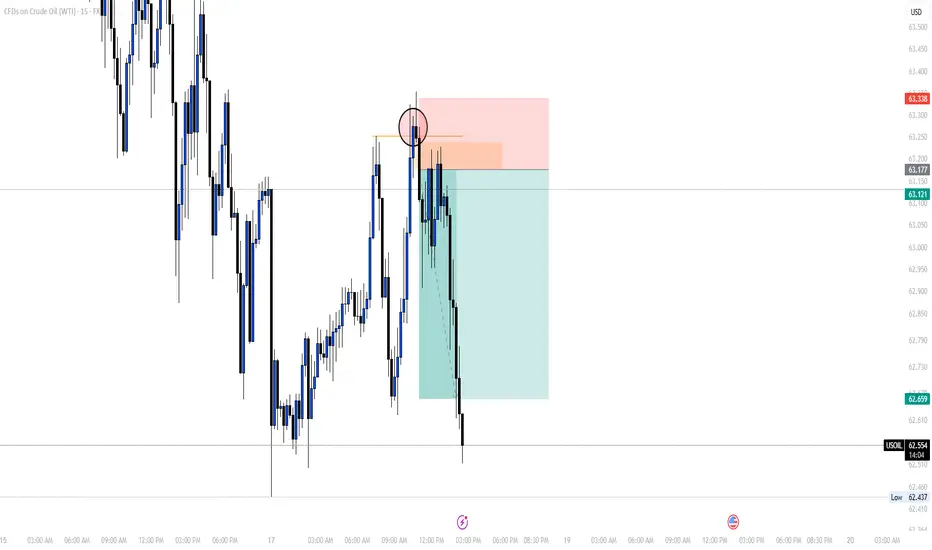
TP REACHED2h ago, I posted to sell on USOIL, the price has reached our target 15min ago.
A good trade for the beginning of the week!
Follow for more!
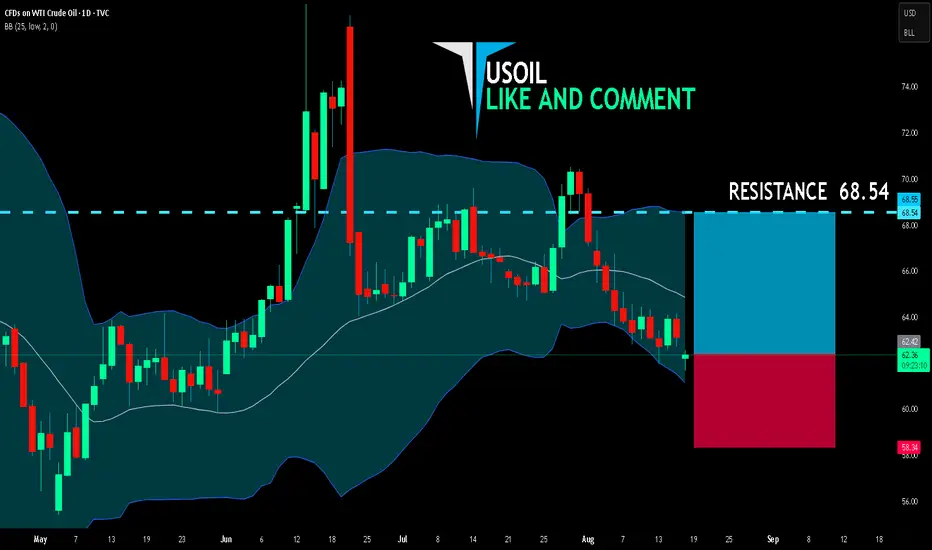
USOIL BULLS ARE STRONG HERE|LONG
USOIL SIGNAL
Trade Direction: long
Entry Level: 62.42
Target Level: 68.54
Stop Loss: 58.34
RISK PROFILE
Risk level: medium
Suggested risk: 1%
Timeframe: 1D
Disclosure: I am part of Trade Nation's Influencer program and receive a monthly fee for using their TradingView charts in my analysis.
✅LIKE AND COMMENT MY IDEAS✅
SELL USOILHere we are again with a new trade on USOIL, in which u=you can sell following the same levels as mine.
We sold after that the price did grab the liquidity and gave us a FVG to enter based on.
Follow for more!
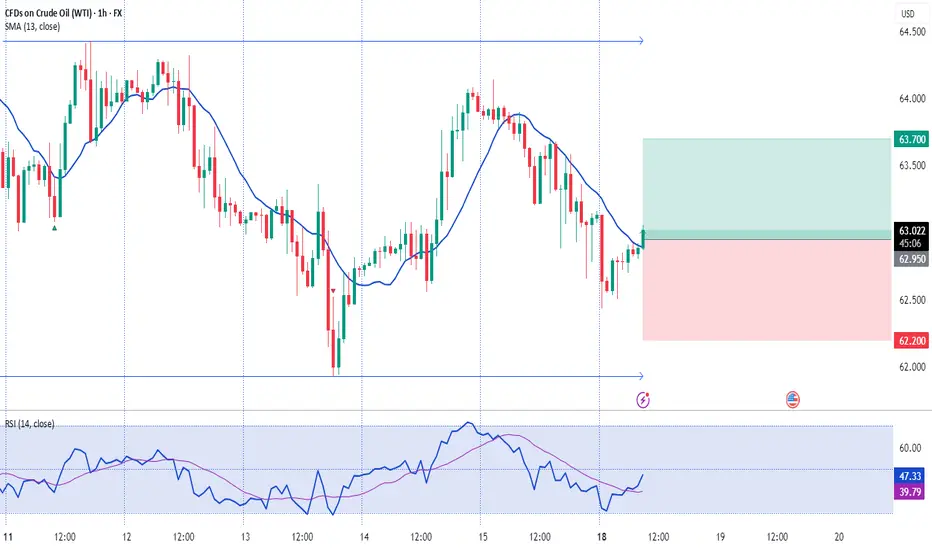
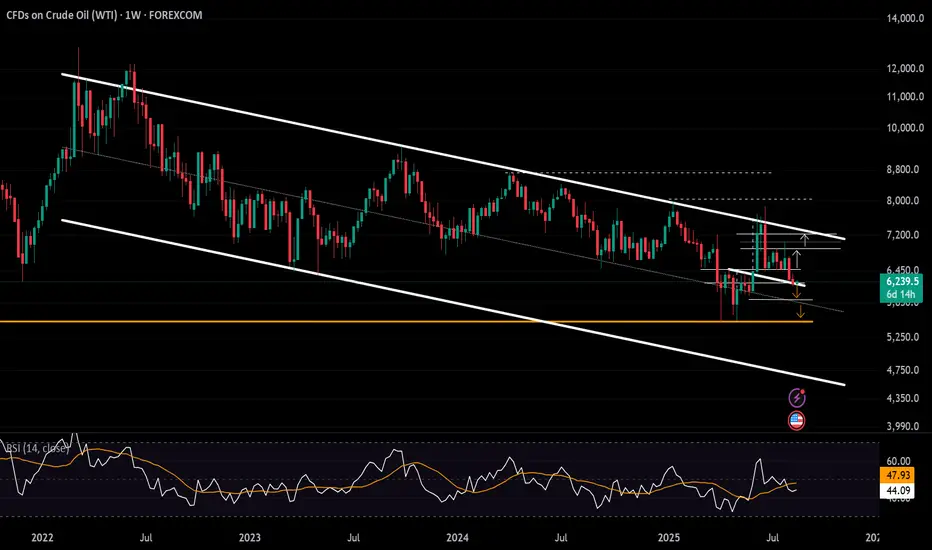
WTI Holds 62 Support Ahead of Washington TalksFriday’s meeting in Alaska set the stage for a potential shift in U.S.–Russia relations. Putin’s terms, discussed privately, are expected to be presented today in Washington during talks between Trump, Zelensky, and EU allies toward a possible ceasefire.
WTI’s latest drop is currently holding at the 0.618 Fibonacci retracement of the May–June uptrend, and precisely at the neckline of the inverted head and shoulders pattern around the $62 level. The Fibonacci retracement was applied from the $55 low to the $77.80 close, filtering out breakout noise beyond the upper border of the 3-year down trending channel.
• If 62 breaks, downside risks may accelerate toward the mid-zone of the channel, with key levels in sight at 61.40, 59.40, and 55.20, respectively.
• If 62.60 holds, and WTI reclaims ground above 65, we could see a recovery toward the upper edge with next resistance levels at 68.00, 70.00, 71.40, and 72.70.
Written by Razan Hilal, CMT
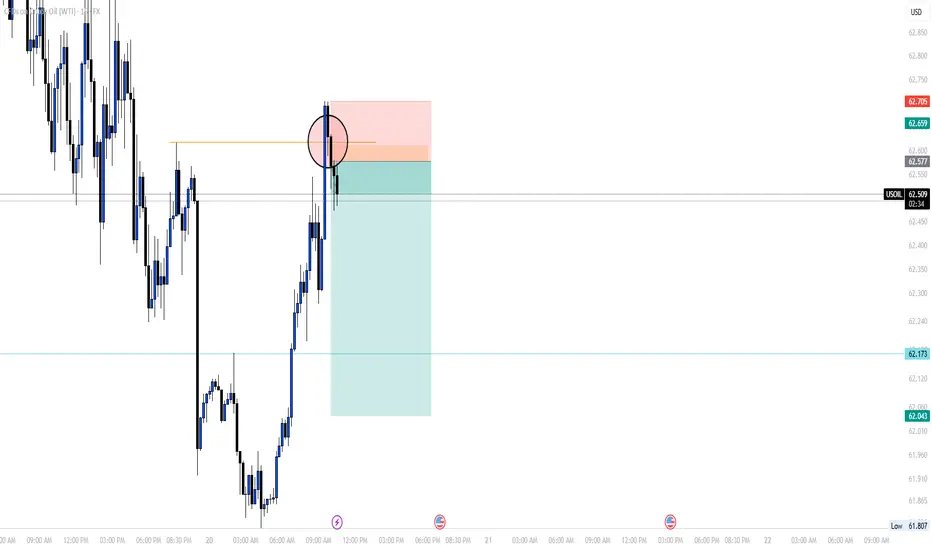
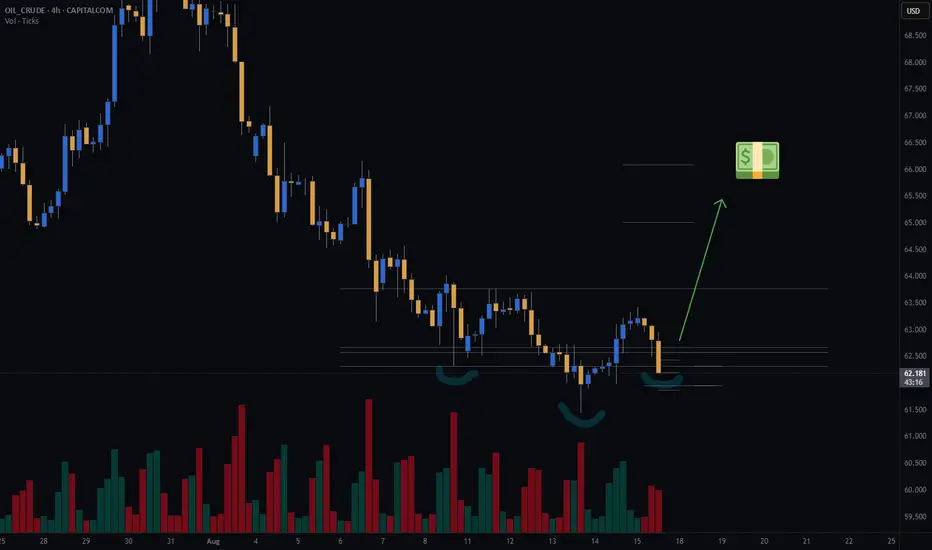
Oil - Potential long with inverse and shouldersWatching Oil for a potential long entry. There appears to be an inverse head and shoulders forming on the 4-hour chart.
If the 4-hour candle closes within the expected range and 3 of my other variables are met, I’ll consider entering a long position.
Trade Details:
📊 Risk/Reward: 3.8
🎯 Entry: 62.658
🛑 Stop Loss: 61.941
💰 Take Profit 1 (50%): 65
💰 Take Profit 2 (50%): 66.08
#GTradingMethod Tip: Predefine and accept your risk before entering a trade.
Thanks for checking out my post! Make sure to follow me to catch the next update. If you found this helpful, give it a like 👍 and share your thoughts 💬 — I’d love to hear what you think!
Please note: This is not financial advice. This content is to track my trading journey and for educational purposes only.
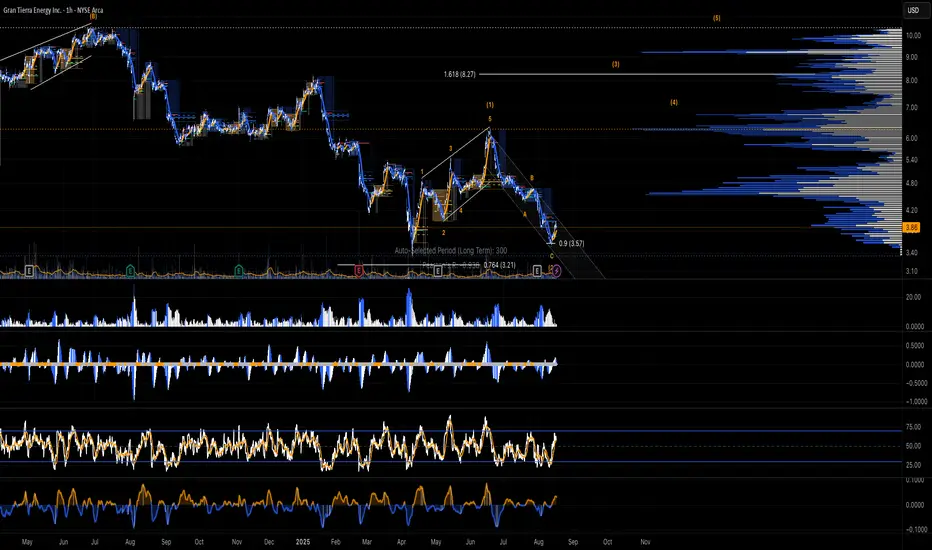
Gran Tierra Energy, Inc $GTE ~ Bullish...Gran Tierra Energy, Inc engages in the exploration and production of oil and natural gas in Colombia and Ecuador. It holds interests in the assets located in the Middle Magdalena Valley and Putumayo Basins. The company was founded on June 6, 2003 and is headquartered in Calgary, Canada. AMEX:GTE
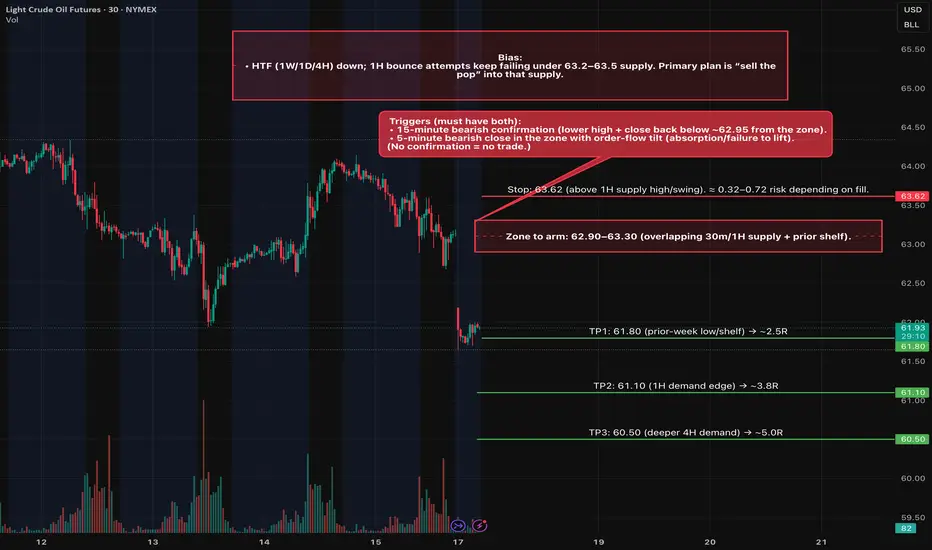
CL (Oil Futures) Short Trade Idea 08/17Setup
• Type: Rejection of 4H/1H supply → continuation lower.
• Zone to arm: 62.90–63.30 (overlapping 30m/1H supply + prior shelf).
• Triggers (must have both):
• 15-minute bearish confirmation (lower high + close back below ~62.95 from the zone).
• 5-minute bearish close in the zone with order-flow tilt (absorption/failure to lift).
(No confirmation = no trade.)
Entry & Risk
• Entry: MOS on the confirming 5m close within 62.90–63.30.
• Stop: 63.62 (above 1H supply high/swing). ≈ 0.32–0.72 risk depending on fill.
• Size: Calibrate so full-stop loss = ≤ 1R of your plan.
Targets (R:R from 63.10 mid-entry, 0.52 stop)
• TP1: 61.80 (prior-week low/shelf) → ~2.5R
• TP2: 61.10 (1H demand edge) → ~3.8R
• TP3: 60.50 (deeper 4H demand) → ~5.0R
Management
• Scale 1/2 at TP1; trail above last 5m swing after a fresh LL or hold for TP2.
• If price tags 63.30–63.50 and closes 15m above 63.50, invalidate the short idea until structure resets.
• Avoid fresh risk within ~10–15 min of EIA Wed 10:30 ET; re-arm after the first post-release 15m bar closes.
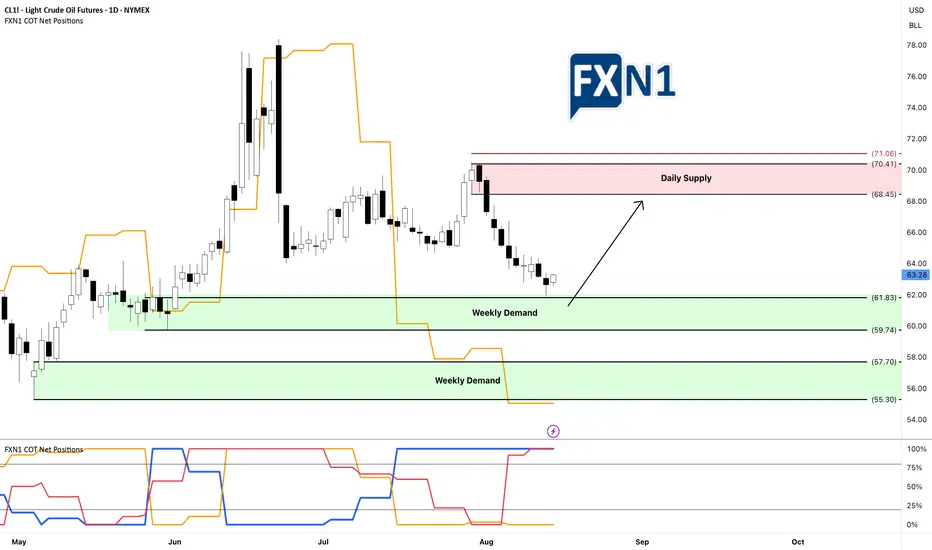
Oil Market Insights: Demand Zones and Future FundamentalsYesterday, CL1! oil tested and rebounded from my weekly demand zone without triggering my entry, resulting in a missed opportunity for several points. This suggests to me that there is buying interest at this level, regardless of the fact that non-commercial traders are short. I am now looking for a retest of this area—if I'm fortunate—to enter a long position. I am also awaiting the new COT data tomorrow to assess any potential shifts in fundamentals. Additionally, I am considering the presence of a stronger demand zone below, which appears even more promising. We'll see how it unfolds.
✅ Please share your thoughts about CL1! in the comments section below and HIT LIKE if you appreciate my analysis. Don't forget to FOLLOW ME; you will help us a lot with this small contribution.
Gold | Oil | Dollar | Silver | Natural Gas Price ForecastGold | Oil | Dollar | Silver | Natural Gas Price Forecast
COMEX:GC1! COMEX:SI1! AMEX:UNG NYMEX:CL1!

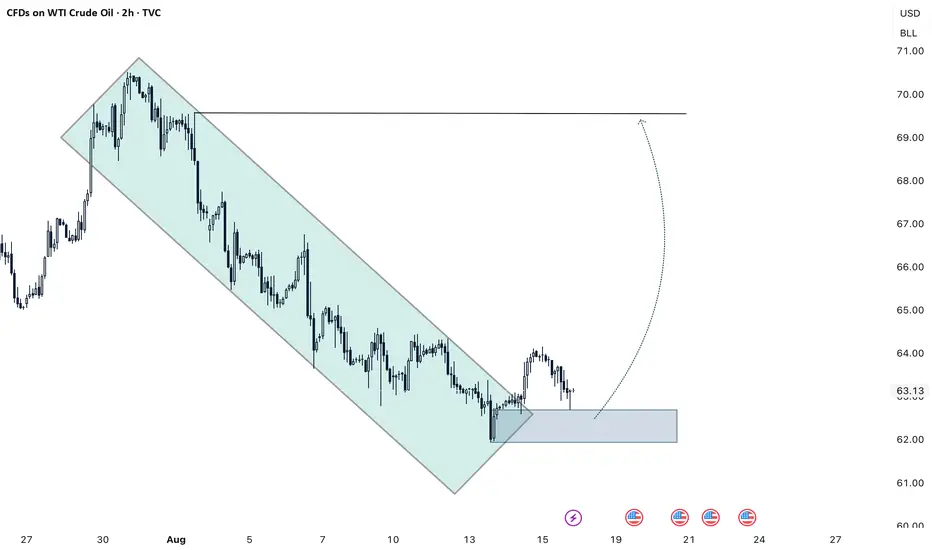
USOIL H2 BEARISH CHANNEL BREAKOUT Usoil H2 Bearsih Channel Breakout
Price From Break The Channel : 63.0
We Are Looking For A Bullish Moment At Entry 63.0 / 60.0
Targeting Area Buy Side Liquidity Area 70.0
Manage Your Trade Properly And Follow Us For More Trades
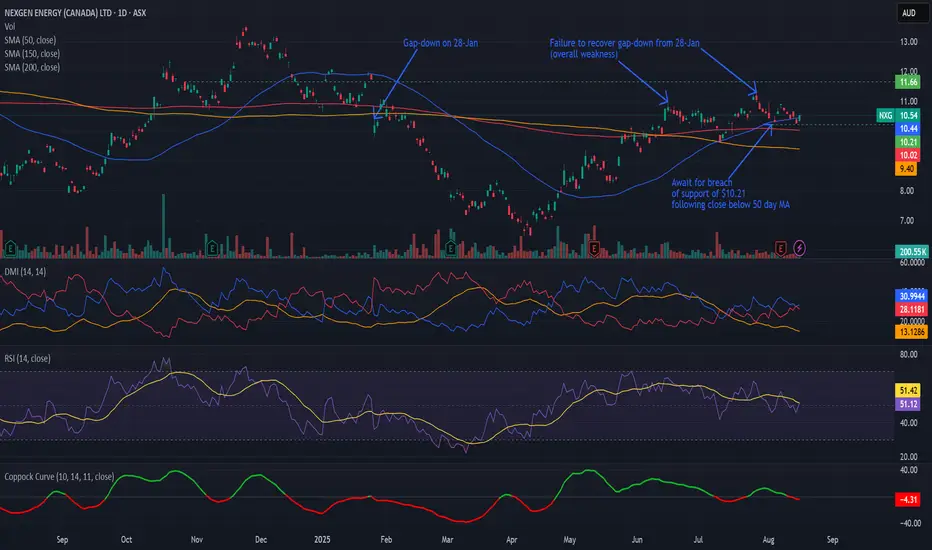
Bearish potential detected for NXGEntry conditions:
(i) lower share price for ASX:NXG along with swing of DMI indicator towards bearishness and RSI downwards, and
(ii) observing market reaction around the share price of $10.21 (open of 4th August).
Stop loss for the trade, depending on risk tolerance, would be:
(i) above the recent swing high of $10.92 of 7th August, or
(ii) above the potential prior resistance of $11.18 from the open of 28th July, or
(iii) above the potential prior resistance of $11.66 from the open of 28th October 2024.
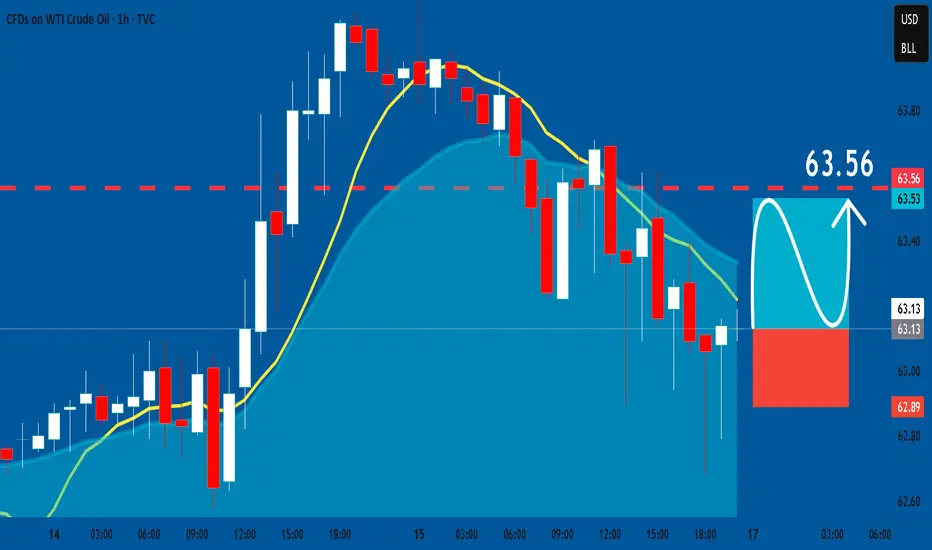
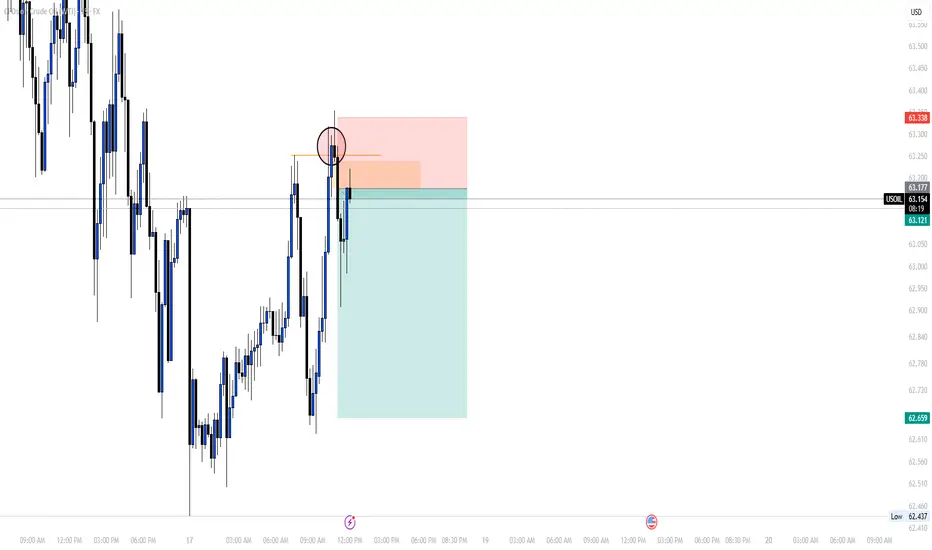
USOIL: Long Signal Explained
USOIL
- Classic bullish formation
- Our team expects growth
SUGGESTED TRADE:
Swing Trade
Buy USOIL
Entry Level - 63.13
Sl - 62.89
Tp - 63.56
Our Risk - 1%
Start protection of your profits from lower levels
Disclosure: I am part of Trade Nation's Influencer program and receive a monthly fee for using their TradingView charts in my analysis.
❤️ Please, support our work with like & comment! ❤️