USOIL Will Explode! BUY!
My dear friends,
USOIL looks like it will make a good move, and here are the details:
The market is trading on 63.13 pivot level.
Bias - Bullish
Technical Indicators: Supper Trend generates a clear long signal while Pivot Point HL is currently determining the overall Bullish trend of the market.
Goal - 63.56
Recommended Stop Loss - 62.88
About Used Indicators:
Pivot points are a great way to identify areas of support and resistance, but they work best when combined with other kinds of technical analysis
Disclosure: I am part of Trade Nation's Influencer program and receive a monthly fee for using their TradingView charts in my analysis.
———————————
WISH YOU ALL LUCK
Energy Commodities
BRIEFING Week #33 : Status Quo... for nowHere's your weekly update ! Brought to you each weekend with years of track-record history..
Don't forget to hit the like/follow button if you feel like this post deserves it ;)
That's the best way to support me and help pushing this content to other users.
Kindly,
Phil

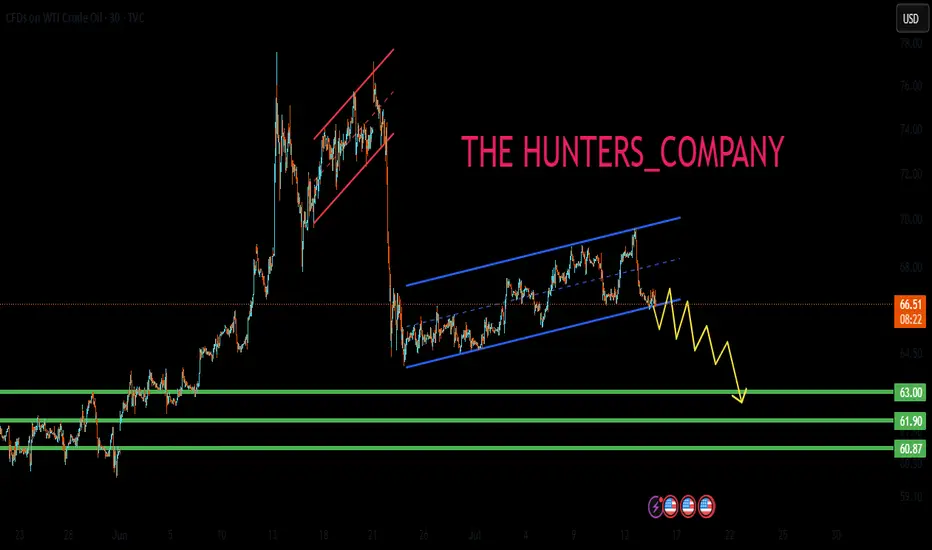
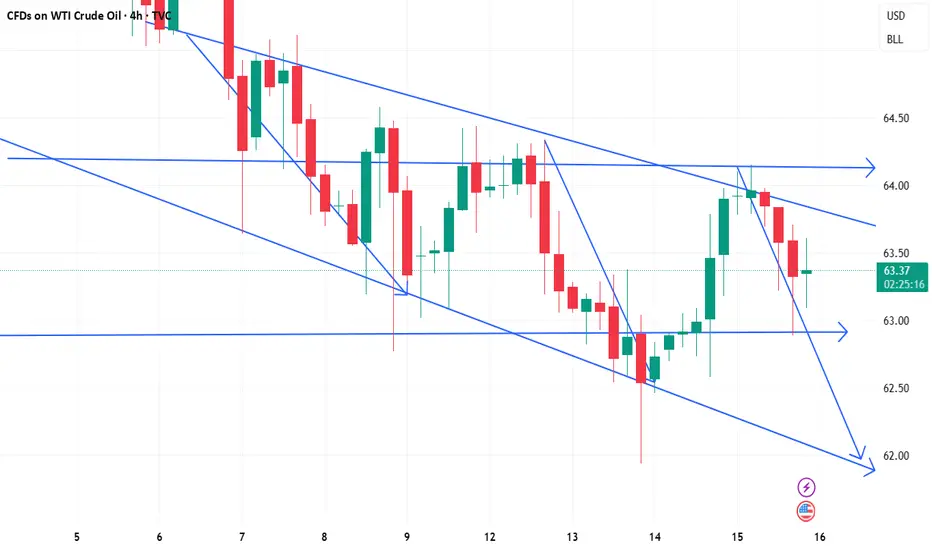
US OIL SELL...Hello friends🙌
🔊As you can see, this chart works well in forming a channel, and now that
we have witnessed a price drop, the price has reached the bottom of the channel, and given the previous heavy drop, the channel shows that the power is currently in the hands of sellers and it is likely that the specified targets will move.
🔥Follow us for more signals🔥
Trade safely with us
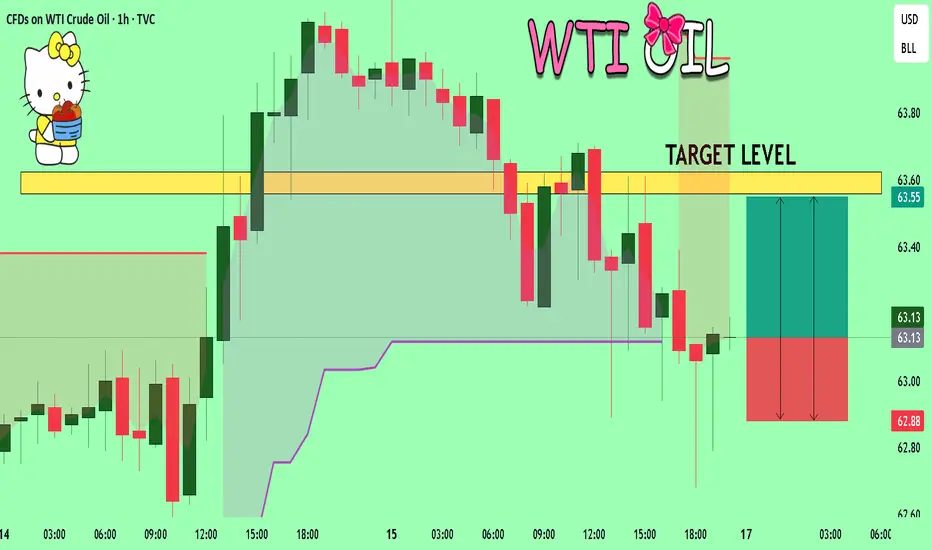
USOIL Is Bullish! Long!
Here is our detailed technical review for USOIL.
Time Frame: 12h
Current Trend: Bullish
Sentiment: Oversold (based on 7-period RSI)
Forecast: Bullish
The market is on a crucial zone of demand 63.116.
The oversold market condition in a combination with key structure gives us a relatively strong bullish signal with goal 65.546 level.
P.S
Please, note that an oversold/overbought condition can last for a long time, and therefore being oversold/overbought doesn't mean a price rally will come soon, or at all.
Disclosure: I am part of Trade Nation's Influencer program and receive a monthly fee for using their TradingView charts in my analysis.
Like and subscribe and comment my ideas if you enjoy them!
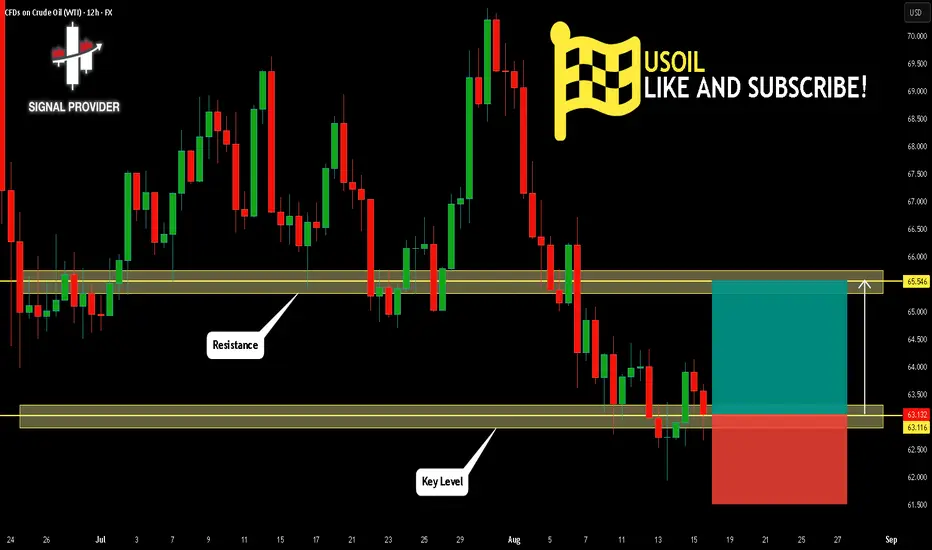
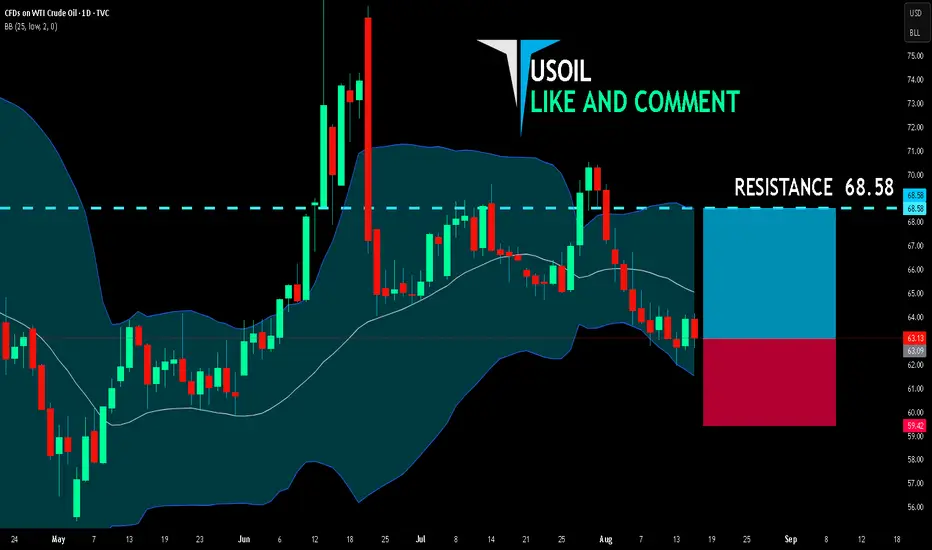
USOIL BULLISH BIAS RIGHT NOW| LONG
USOIL SIGNAL
Trade Direction: long
Entry Level: 63.09
Target Level: 68.58
Stop Loss: 59.42
RISK PROFILE
Risk level: medium
Suggested risk: 1%
Timeframe: 1D
Disclosure: I am part of Trade Nation's Influencer program and receive a monthly fee for using their TradingView charts in my analysis.
✅LIKE AND COMMENT MY IDEAS✅
Gold and crude oil are about to fall below supportToday is Friday, and this week's market is drawing to a close. Gold plunged sharply on Monday, and then fluctuated and corrected from Tuesday to Thursday. Short-term bears are essentially dominating the market. Gold has repeatedly hit new highs before falling, suggesting bulls are digging a hole to bury their enemies. Our current strategy remains bearish, and we should continue to prioritize short positions. The reason is simple: the daily candlestick closed in a bearish pattern. A tombstone candlestick pattern is a bearish signal. Furthermore, all moving averages have been broken, clearly indicating bearish momentum. The only caveat is that 3330 hasn't been broken yet. A break of this level, the bottom of this week, would open up new downside potential.
Support lies at 3330 and 3320, resistance at 3349 and 3360, strong resistance at 3375, and the dividing line between strength and weakness at 3349.
Crude Oil Market Analysis
It's correct to maintain a bearish outlook on crude oil recently. Both the daily and 4H charts are bearish. Yesterday's rebound was a normal technical rebound, providing another opportunity for short positions. Today, we should continue to focus on the 64.50 level. The daily moving average has begun to decline and has already broken through. Barring any unexpected events, we'll soon see the 60.00 level.
Fundamental Analysis
Keep an eye on the US national debt. The current debt has reached a historical high and is expected to have a market impact in the coming weeks.
Gold: Buy short positions around 3348, target 3330-3320
Crude Oil: Buy short positions around 64.00, target 62.00-60.00
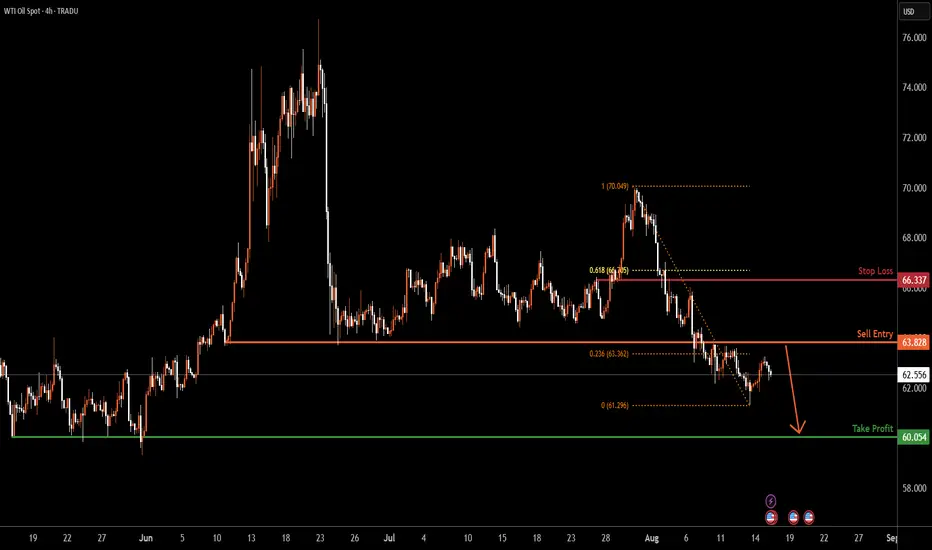
USOIL H4 | Bearish reversal off pullback resistanceBased on the H4 chart analysis, we could see the price rise to the sell entry, which is pullback resistance that is slightly above the 23.6% Fibonacci retracement and could drop from this level to the take profit.
Sell entry is at 63.82, which is a pullback resistance that is slightly above the 23.6% Fibonacci retracement.
Stop loss is at 66.33, which is a pullback resistance that is slightly below the 61.8% Fibonacci retracement.
Take profit is at 60.05, which is a multi swing low support.
High Risk Investment Warning
Trading Forex/CFDs on margin carries a high level of risk and may not be suitable for all investors. Leverage can work against you.
Stratos Markets Limited (tradu.com ):
CFDs are complex instruments and come with a high risk of losing money rapidly due to leverage. 65% of retail investor accounts lose money when trading CFDs with this provider. You should consider whether you understand how CFDs work and whether you can afford to take the high risk of losing your money.
Stratos Europe Ltd (tradu.com ):
CFDs are complex instruments and come with a high risk of losing money rapidly due to leverage. 66% of retail investor accounts lose money when trading CFDs with this provider. You should consider whether you understand how CFDs work and whether you can afford to take the high risk of losing your money.
Stratos Global LLC (tradu.com ):
Losses can exceed deposits.
Please be advised that the information presented on TradingView is provided to Tradu (‘Company’, ‘we’) by a third-party provider (‘TFA Global Pte Ltd’). Please be reminded that you are solely responsible for the trading decisions on your account. There is a very high degree of risk involved in trading. Any information and/or content is intended entirely for research, educational and informational purposes only and does not constitute investment or consultation advice or investment strategy. The information is not tailored to the investment needs of any specific person and therefore does not involve a consideration of any of the investment objectives, financial situation or needs of any viewer that may receive it. Kindly also note that past performance is not a reliable indicator of future results. Actual results may differ materially from those anticipated in forward-looking or past performance statements. We assume no liability as to the accuracy or completeness of any of the information and/or content provided herein and the Company cannot be held responsible for any omission, mistake nor for any loss or damage including without limitation to any loss of profit which may arise from reliance on any information supplied by TFA Global Pte Ltd.
The speaker(s) is neither an employee, agent nor representative of Tradu and is therefore acting independently. The opinions given are their own, constitute general market commentary, and do not constitute the opinion or advice of Tradu or any form of personal or investment advice. Tradu neither endorses nor guarantees offerings of third-party speakers, nor is Tradu responsible for the content, veracity or opinions of third-party speakers, presenters or participants.
CRUDE OIL Short From Resistance! Sell!
Hello,Traders!
CRUDE OIL is making a
Pullback and will soon hit
A horizontal resistance
Of 64.50$ and as we are
Bearish biased and we will
Be expecting a local
Bearish pullback
Sell!
Comment and subscribe to help us grow!
Check out other forecasts below too!
Disclosure: I am part of Trade Nation's Influencer program and receive a monthly fee for using their TradingView charts in my analysis.
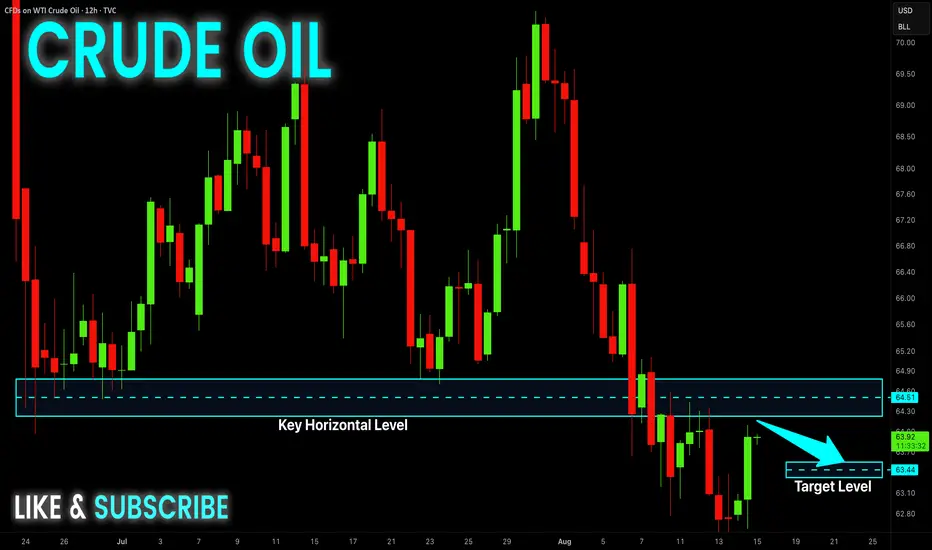
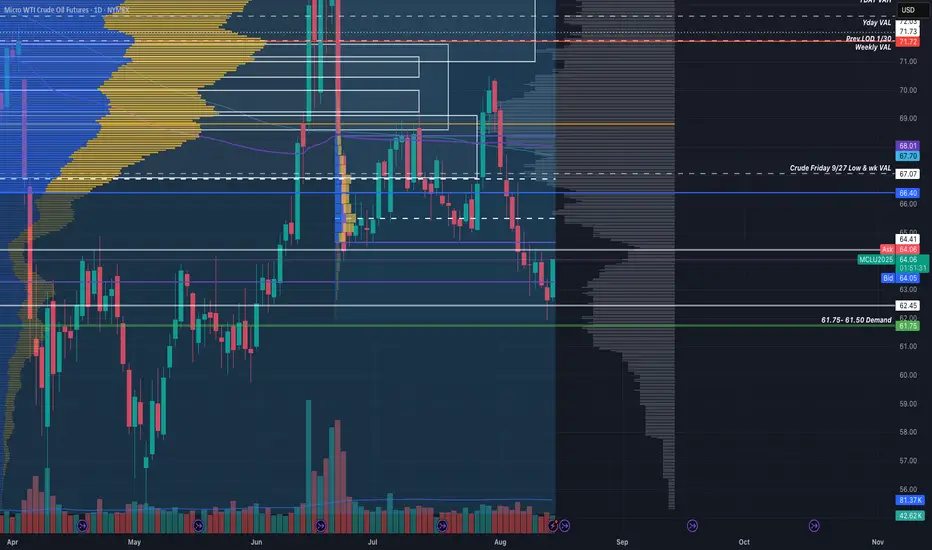
Crude Levels (Non-Updated but still reactive)Just wanted to share my crude levels. Drew alot of these months ago and haven't adjusted alot of them...especially the boxes but general areas identified still seem to be reactive.
Will update these eventually, but not sure this will be a living chart once published.
~The Villain
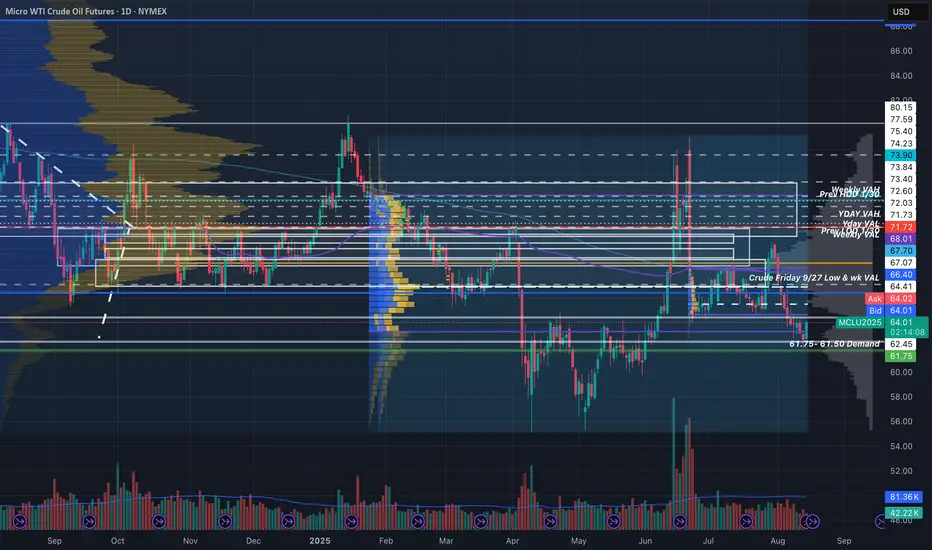
Crude Levels (Non-Updated but still reactive)Just wanted to share my crude levels. Drew alot of these months ago and haven't adjusted alot of them...especially the boxes but general areas identified still seem to be reactive.
~The Villain
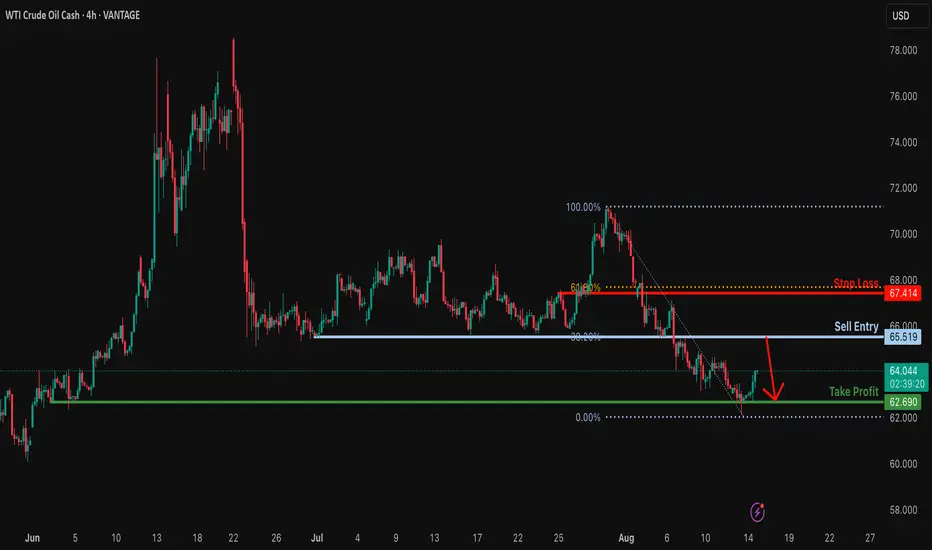
Heading into 38.2% Fibonacci resistance?USO/USD is rising towards the resistance level which is a pullback resistance that lines up with the 38.2% Fibonacci retracement and could drop from this levl ot our take profit.
Entry: 65.51
Why we like it:
There is a pullback resistance that lines up with the 38.25 Fibonacci retracement.
Stop loss: 67.41
Why we like it:
There is a pullback resistance that aligns with the 61.8% Fibonacci retracement.
Take profit: 62.69
Why we like it:
There is a pullback support.
Enjoying your TradingView experience? Review us!
Please be advised that the information presented on TradingView is provided to Vantage (‘Vantage Global Limited’, ‘we’) by a third-party provider (‘Everest Fortune Group’). Please be reminded that you are solely responsible for the trading decisions on your account. There is a very high degree of risk involved in trading. Any information and/or content is intended entirely for research, educational and informational purposes only and does not constitute investment or consultation advice or investment strategy. The information is not tailored to the investment needs of any specific person and therefore does not involve a consideration of any of the investment objectives, financial situation or needs of any viewer that may receive it. Kindly also note that past performance is not a reliable indicator of future results. Actual results may differ materially from those anticipated in forward-looking or past performance statements. We assume no liability as to the accuracy or completeness of any of the information and/or content provided herein and the Company cannot be held responsible for any omission, mistake nor for any loss or damage including without limitation to any loss of profit which may arise from reliance on any information supplied by Everest Fortune Group.
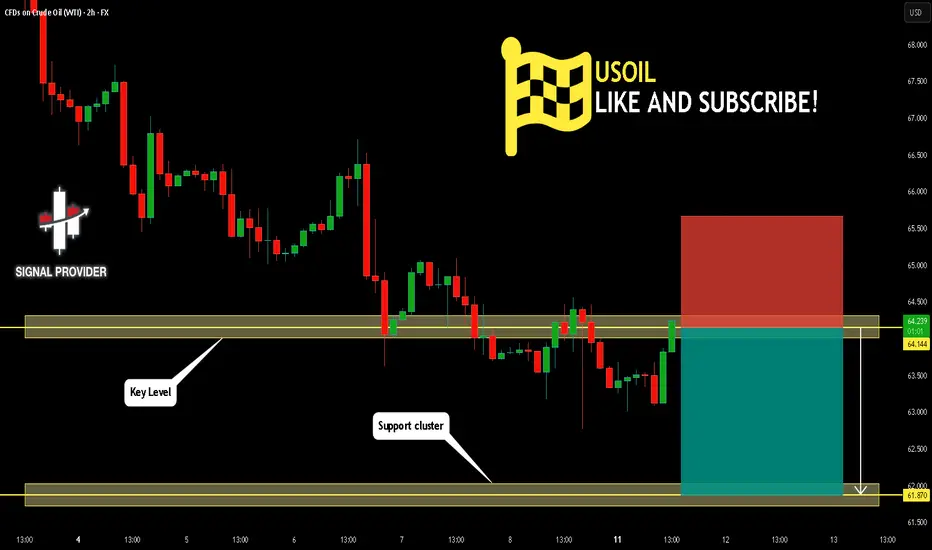
USOIL Is Going Down! Sell!
Take a look at our analysis for USOIL.
Time Frame: 2h
Current Trend: Bearish
Sentiment: Overbought (based on 7-period RSI)
Forecast: Bearish
The price is testing a key resistance 64.144.
Taking into consideration the current market trend & overbought RSI, chances will be high to see a bearish movement to the downside at least to 61.870 level.
P.S
Overbought describes a period of time where there has been a significant and consistent upward move in price over a period of time without much pullback.
Disclosure: I am part of Trade Nation's Influencer program and receive a monthly fee for using their TradingView charts in my analysis.
Like and subscribe and comment my ideas if you enjoy them!
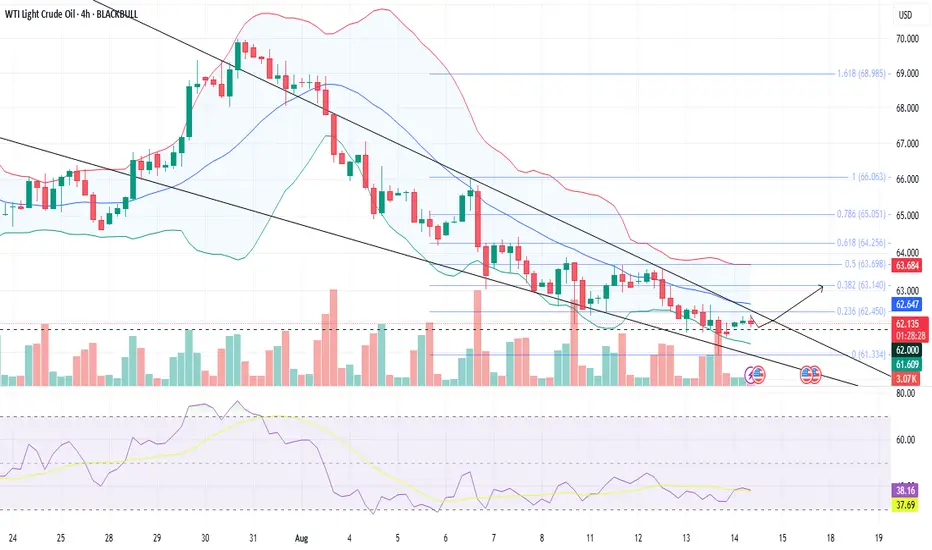
US OILS Detailed AnalysisTechnical Summary:
The primary trend of WTI is bearish, and the prices on a 4H chart also continue their downtrend within a declining wedge pattern.
However, prices are retracing after testing the lower fib level 0.0 (61.33) and are currently trending above a crucial psychological & historically tested support of 62.00.
If prices remain able to sustain higher, then it might test important resistance at 63.00, with a near hurdle at the fib level 0.236 (63.45).
Indicator Interpretation:
The prices are rising after testing the lower Bollinger band, signaling a bullish reversal.
Alternate Scenario
If crude oil breaks the crucial support zone between 62.0 - 61.8, then it could signal rising bearish pressure.
Key Levels
Resistance
R1 = 62.45
R2 = 63.15
Support
S1 = 62.00
S2 = 61.30
Facts & Figures:
The world produces about 95–100 million barrels of crude oil per day, with major producers including the U.S., Saudi Arabia, Russia, and Canada.
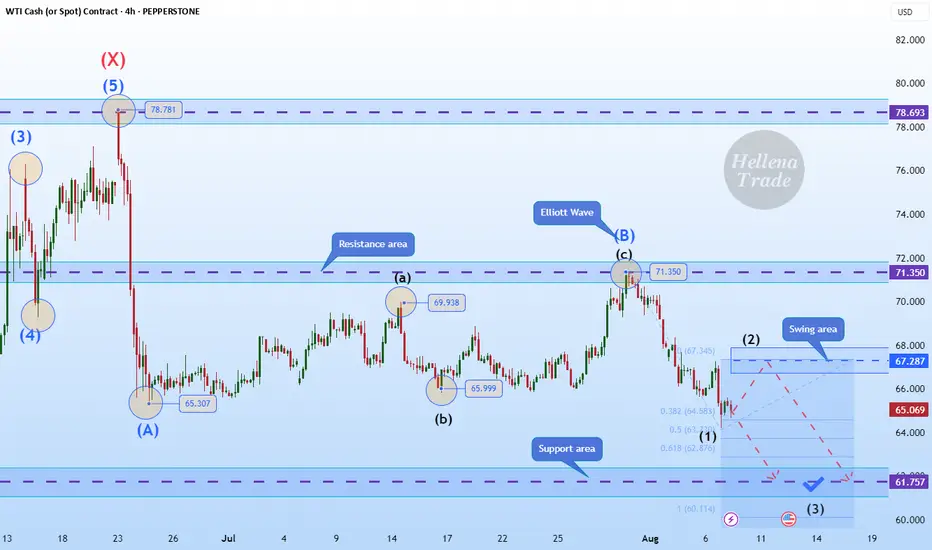
Hellena | Oil (4H): SHORT to support area of 61.937 (Fibo lvl).Hello, colleagues!
Well, I think that the previous scenario is still relevant and the “ABC” correction is developing according to the scenario.
At the moment, I see a five-wave structure in the downward wave “C”. I expect a small correction to the area of 67.287, then a continuation of the downward movement to the area between 61.8% and 100% of the levels of Fibonacci extension - the support area of 61.937.
Manage your capital correctly and competently! Only enter trades based on reliable patterns!
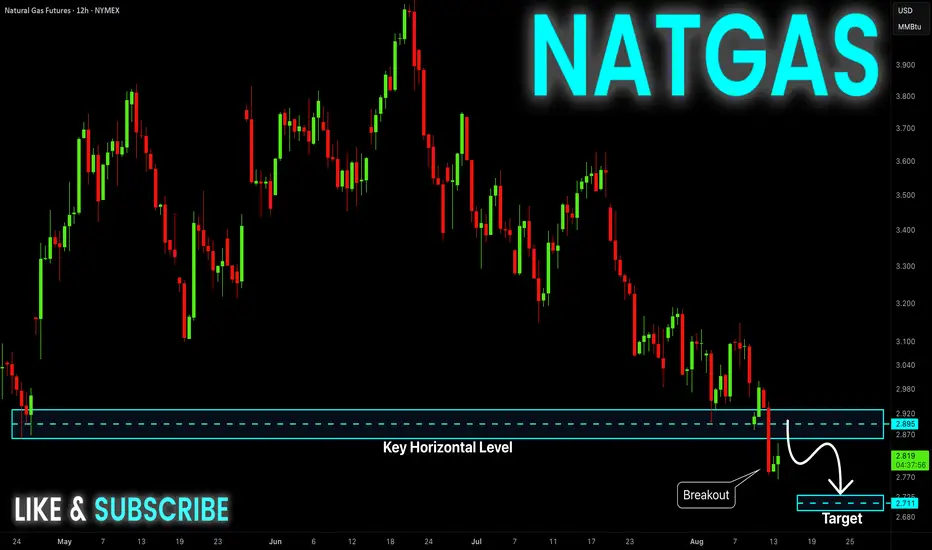
NATGAS Swing Short! Sell!
Hello,Traders!
NATGAS made a bearish
Breakout of the key horizontal
Level of 2.895$ while trading
In a downtrend so we are
Bearish biased and we will
Be expecting a further
Bearish continuation
Sell!
Comment and subscribe to help us grow!
Check out other forecasts below too!
Disclosure: I am part of Trade Nation's Influencer program and receive a monthly fee for using their TradingView charts in my analysis.
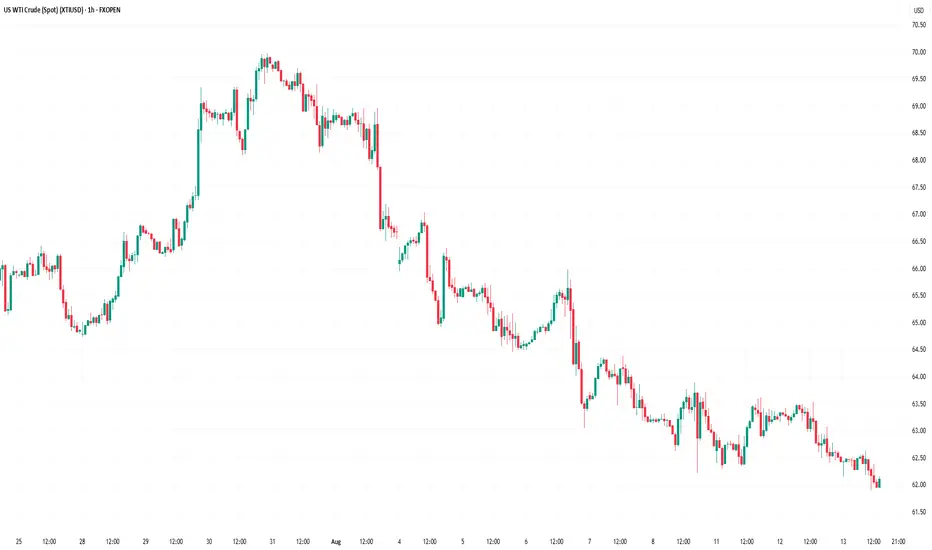
Market Analysis: WTI Crude Oil Struggles In RedMarket Analysis: WTI Crude Oil Struggles In Red
WTI Crude oil is also down and remains at risk of more losses below $62.00.
Important Takeaways for WTI Crude Oil Price Analysis Today
- WTI Crude oil prices extended losses below the $65.00 support zone.
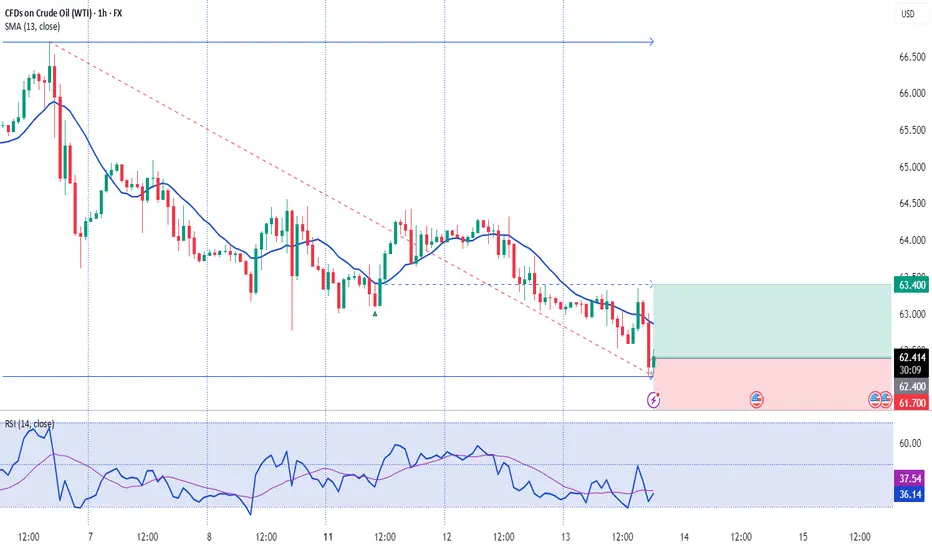
- A major bearish trend line is formed with resistance at $63.05 on the hourly chart of XTI/USD.
WTI Crude Oil Price Technical Analysis
On the hourly chart of WTI Crude Oil, the price struggled to continue higher above $66.00 against the US Dollar. The price formed a short-term top and started a fresh decline below $65.00.
There was a steady decline below the $64.50 pivot level. The bears even pushed the price below $63.50 and the 50-hour simple moving average. Finally, the price tested the $62.15 zone, and the price is now consolidating losses.
On the upside, immediate resistance is near the 23.6% Fib retracement level of the downward move from the $65.98 swing high to the $62.15 low at $63.05. There is also a major bearish trend line at $63.05 and the 50-hour simple moving average.
The main hurdle is $63.50. A clear move above the $63.50 zone could send the price toward the 61.8% Fib retracement level at $64.50.
The next key resistance is near $66.00. If the price climbs further higher, it could face sellers near $68.00. Any more gains might send the price toward the $70.00 level.
Immediate support is near the $62.15 level. The next major level on the WTI crude oil chart is near $61.20. If there is a downside break, the price might decline toward $60.00. Any more losses may perhaps open the doors for a move toward the $55.00 zone.
This article represents the opinion of the Companies operating under the FXOpen brand only. It is not to be construed as an offer, solicitation, or recommendation with respect to products and services provided by the Companies operating under the FXOpen brand, nor is it to be considered financial advice.
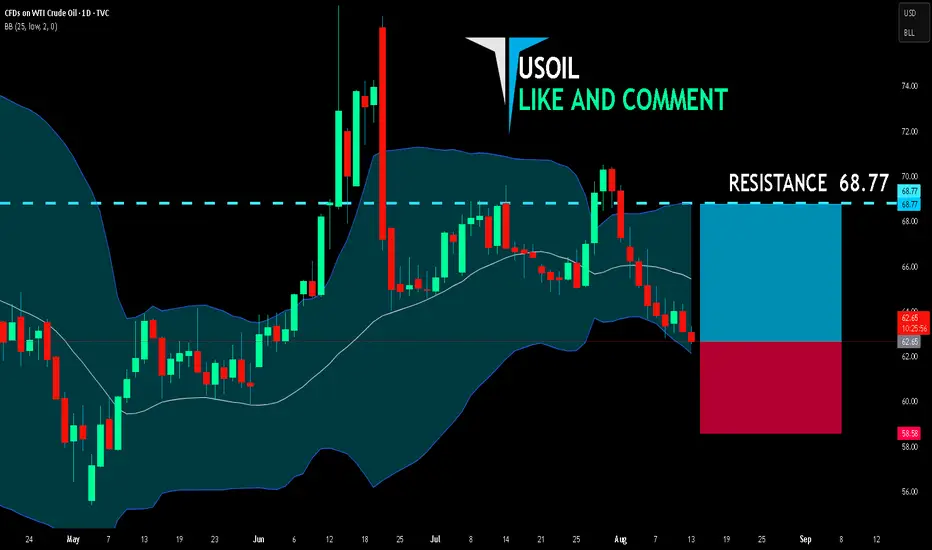
USOIL LONG FROM SUPPORT
USOIL SIGNAL
Trade Direction: short
Entry Level: 62.65
Target Level: 68.77
Stop Loss: 58.58
RISK PROFILE
Risk level: medium
Suggested risk: 1%
Timeframe: 1D
Disclosure: I am part of Trade Nation's Influencer program and receive a monthly fee for using their TradingView charts in my analysis.
✅LIKE AND COMMENT MY IDEAS✅
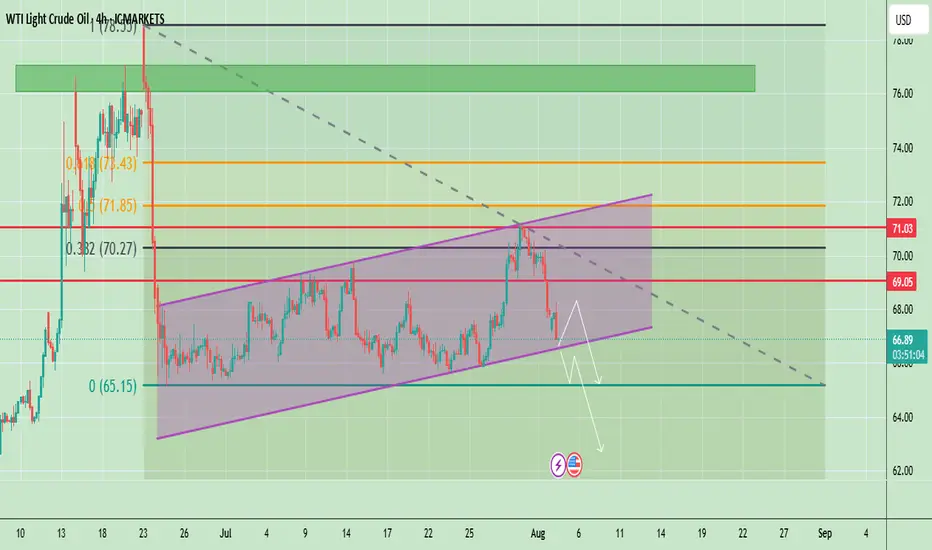
Oil at Key Support – Bounce or Breakdown?Crude oil is trading around $66.94, showing a bearish correction after failing to hold above $69.05. The chart shows price respecting an ascending channel but currently testing its lower boundary. The recent drop signals weakening bullish momentum, and a confirmed break below the channel could accelerate selling pressure toward lower levels.
📈 Potential Scenarios
- Bullish Rebound: If price holds above the channel support (~$66.00–$66.50) and breaks back above $69.05, it may target $71.03 and possibly $72.00.
- Bearish Breakdown: A confirmed close below $66.00 can accelerate the downside toward $65.00, with extended targets near $63.50–$62.00.
📊 Key Technical Highlights
- Price rejected from the channel top and is now testing lower support.
- Key resistance zones: $69.05 (immediate), $71.03 (major).
- Key support zones: $66.00 (channel), then $65.00–$63.50 (breakdown targets).
- Momentum indicators show weakening buying pressure, favoring cautious trading.
🔑 Key Levels to Watch
- Resistance: $69.05 → $71.03 → $72.00
- Support: $66.00 → $65.00 → $63.50
🧭 Trend Outlook
- A short-term relief bounce is possible, but failure to reclaim $69.05 keeps sellers in control.
- Breaking below the channel would shift the overall outlook to bearish for August.
Note
Please risk management in trading is a Key so use your money accordingly. If you like the idea then please like and boost. Thank you and Good Luck!
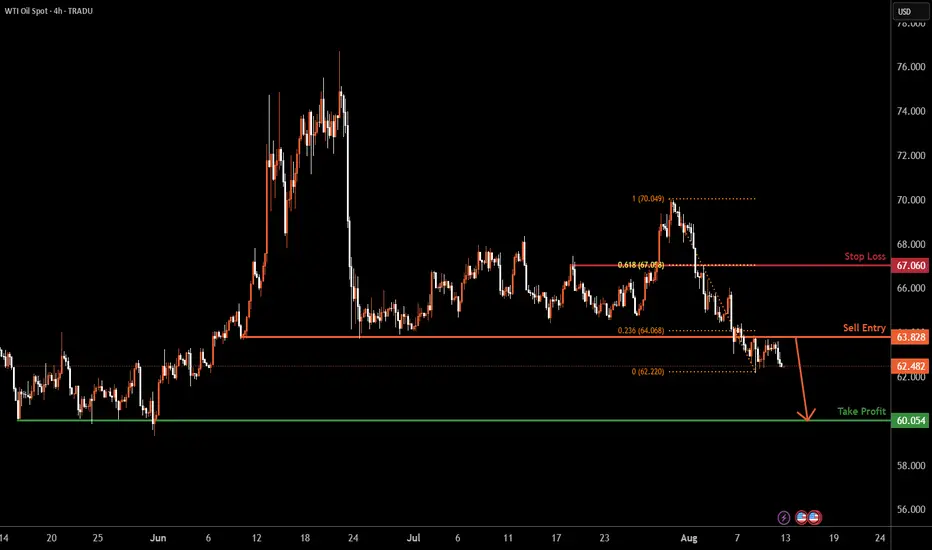
USOIL H4 | Potential bearish dropBased on the H4 chart analysis, we can see the price has rejected off the sell entry which acts as a pullback resistance that lines up with the 23.6% Fibonacci retracement and could drop to the downside.
Sell entry is at 64.13, which is a pullback resistance that lines up with the 23.6% Fibonacci retracement.
Stop loss is at 67.06, which is a pullback resistance that aligns with the 61.8% Fibonacci retracement.
Take profit is at 60.05, which is a multi-swing low support.
High Risk Investment Warning
Trading Forex/CFDs on margin carries a high level of risk and may not be suitable for all investors. Leverage can work against you.
Stratos Markets Limited (tradu.com ):
CFDs are complex instruments and come with a high risk of losing money rapidly due to leverage. 65% of retail investor accounts lose money when trading CFDs with this provider. You should consider whether you understand how CFDs work and whether you can afford to take the high risk of losing your money.
Stratos Europe Ltd (tradu.com ):
CFDs are complex instruments and come with a high risk of losing money rapidly due to leverage. 66% of retail investor accounts lose money when trading CFDs with this provider. You should consider whether you understand how CFDs work and whether you can afford to take the high risk of losing your money.
Stratos Global LLC (tradu.com ):
Losses can exceed deposits.
Please be advised that the information presented on TradingView is provided to Tradu (‘Company’, ‘we’) by a third-party provider (‘TFA Global Pte Ltd’). Please be reminded that you are solely responsible for the trading decisions on your account. There is a very high degree of risk involved in trading. Any information and/or content is intended entirely for research, educational and informational purposes only and does not constitute investment or consultation advice or investment strategy. The information is not tailored to the investment needs of any specific person and therefore does not involve a consideration of any of the investment objectives, financial situation or needs of any viewer that may receive it. Kindly also note that past performance is not a reliable indicator of future results. Actual results may differ materially from those anticipated in forward-looking or past performance statements. We assume no liability as to the accuracy or completeness of any of the information and/or content provided herein and the Company cannot be held responsible for any omission, mistake nor for any loss or damage including without limitation to any loss of profit which may arise from reliance on any information supplied by TFA Global Pte Ltd.
The speaker(s) is neither an employee, agent nor representative of Tradu and is therefore acting independently. The opinions given are their own, constitute general market commentary, and do not constitute the opinion or advice of Tradu or any form of personal or investment advice. Tradu neither endorses nor guarantees offerings of third-party speakers, nor is Tradu responsible for the content, veracity or opinions of third-party speakers, presenters or participants.
NATGAS BEARISH BREAKOUT|SHORT|
✅NATGAS is going down currently
As the price broke the key structure level of 2.90$
Which is now a resistance, and after the pullback
And retest, I think the price will go further down
SHORT🔥
✅Like and subscribe to never miss a new idea!✅

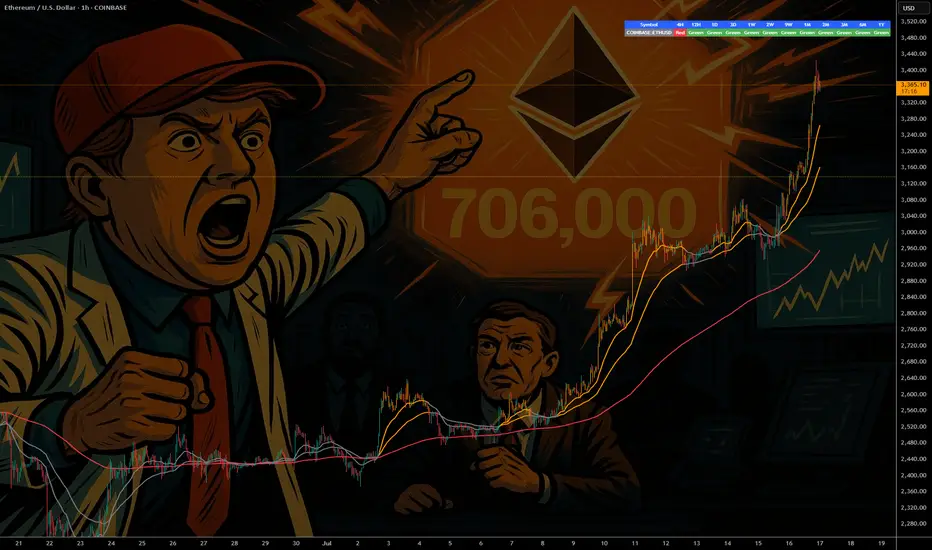
ETH - If You Know ...... You Know whats Coming
NYSE:BLK $BUIDL tokenized U.S.-Treasury fund launched on COINBASE:ETHUSD in Mar 2024—Wall Street is already settling real dollars on-chain.
NYSE:JPM JPMD stablecoin just went live on Base (an COINBASE:ETHUSD L2), piping wholesale payments from a $4 T balance-sheet straight through COINBASE:ETHUSD rails.
COINBASE:ETHUSD isn’t just riding the next crypto cycle—it’s becoming Wall Street’s settlement layer. From BlackRock’s on-chain Treasury fund to JPMorgan’s and soon Bank of America’s dollar tokens, a tidal wave of institutional stable-coin flows is lining up behind ETH. Fewer coins, more real-world volume—if you know, you know what’s coming.
NYSE:BAC CEO says they’ll issue a dollar-backed token the moment regulators nod—another tier-1 bank boarding the Ethereum train.
Stablecoin cap has blasted past $230 B , with 80 %+ of all on-chain transfers riding Ethereum (plus BSC) blocks.
Corporate settlements via stablecoins grew 25 % YoY in 2024 as multinationals replaced SWIFT with instant on-chain clearing.
Daily stablecoin throughput averages $7 B—each hop burning ETH and tightening supply.
BCG projects tokenized real-world assets to exceed $16 T by 2030 , with EVM chains as the default plumbing.
Over 500 M wallets already interact with stablecoins , a 30 % YoY surge led by emerging-market demand.
L2s like BINANCE:ARBUSDT & BINANCE:OPUSDT cut transaction fees 35 % yet still settle back to mainnet—meaning ETH captures the fee stream and the burn.
Bottom line: a tidal wave of bank-grade stablecoins + tokenized assets is lining up behind ETH; supply shrinks, demand soars—if you know, you know what’s coming.
quote] Marty Boots | 17-Year Trader — smash that , hit LIKE & SUBSCRIBE, and share your views in the comments below so we can make better trades & grow together!
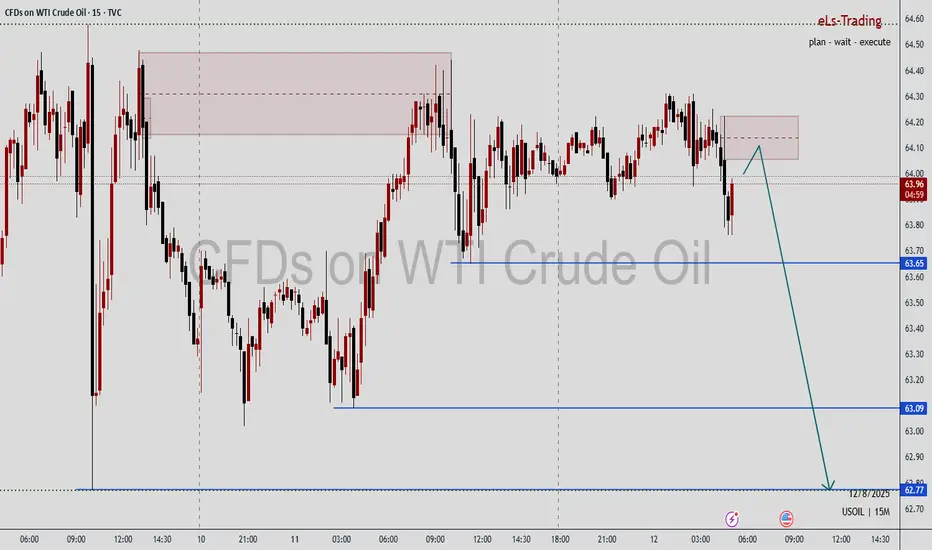
USoil ideaWe are waiting for our asset to reach our action zone, and based on the reaction, we’ll decide on our next moves.ALWAYS WAIT FOR A CONFIRMATION TO SEE IF THE PRICE VALIDATES THE ZONE.and you what is your vision of the EURUSD its interests me! i wait you in the commentar