WTI: Oil Markets on Edge Despite Trump Considering Major TariffsOil prices could drop if Trump backs down on tariffs on countries buying Russian oil, but short-term bullish catalysts, like geopolitical tensions and bullish speculative bets, may still push prices up before longer-term headwinds take hold.
----------------------------------------------------------------------------------------------------------------------
Trump’s threats of steep tariffs on countries buying Russian oil have sent oil prices surging, as traders fear a global supply crunch if Russian barrels are cut off.
But here’s the twist: Trump has a history of backing down or delaying tariffs after using them as leverage. When he does, oil prices usually fall, as the immediate risk of supply disruption fades.
If he caves in again by the deadline, which is 10 to 12 days from 4 August, or extends it, oil prices could drop. The bigger picture also appears bearish: OPEC+ is ramping up supply, global demand is slowing and expected to drop in H2, and inventories are rising (first glimpse by EIA, Wed).
But with the deadline falling around 14–16 August, 2025, short-term bullish catalysts could spark a rally up to the 38.2%-61.8 % Fibonacci retracement levels, positioning WTI better for declines (conditional on Trump!).
This content is not directed to residents of the EU or UK. Any opinions, news, research, analyses, prices or other information contained on this website is provided as general market commentary and does not constitute investment advice. ThinkMarkets will not accept liability for any loss or damage including, without limitation, to any loss of profit which may arise directly or indirectly from use of or reliance on such information.
Energy Commodities

Oil continues to decline due to geopolitics optimismOil continues to decline due to geopolitics optimism
A Kremlin official announced that Presidents Trump and Putin will hold a summit soon, their first since 2021, with a White House source suggesting it could occur as early as next week. Optimism surrounding potential U.S.-Russia discussions on the Ukraine conflict has alleviated concerns about oil supply disruptions, despite U.S. sanctions targeting India for its continued Russian crude imports. Trump introduced a 25% tariff on Indian goods and signaled possible additional tariffs on China. However, increased OPEC production and ongoing trade tensions remain key concerns, raising fears of slower economic growth and reduced demand.
Technically, USOIL trades just above the 6,300.00 support level. Insignificant rebound from this level is expected with possible decline towards crucial 6,000.00 support level.
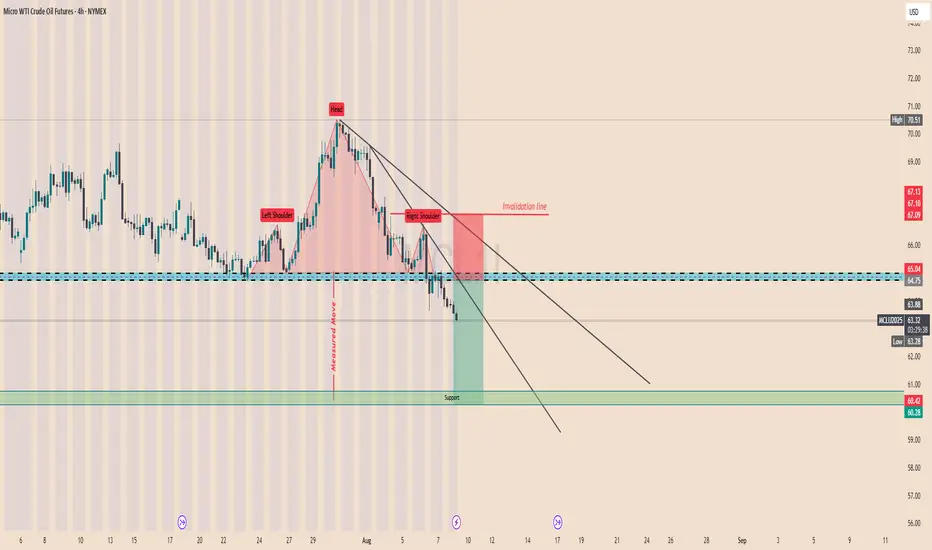
MCL1 Head and Shoulder Pattern! H&S price retested neckline a few times and no closed below it heading to first support at 63.6 then > 60.80 and possible extension to 57.8
USOIL H4 | Potential bearish dropUSOIL has rejected the sell entry which has been identified as a pullback resistance and could drop from this level to the downside.
Sell entry is at 64.76, which is a pullback resistance.
Stop loss is at 66.63, which is an overlap resistance.
Take profit is at 60.50, which is a multi-swing low support.
High Risk Investment Warning
Trading Forex/CFDs on margin carries a high level of risk and may not be suitable for all investors. Leverage can work against you.
Stratos Markets Limited (tradu.com ):
CFDs are complex instruments and come with a high risk of losing money rapidly due to leverage. 65% of retail investor accounts lose money when trading CFDs with this provider. You should consider whether you understand how CFDs work and whether you can afford to take the high risk of losing your money.
Stratos Europe Ltd (tradu.com ):
CFDs are complex instruments and come with a high risk of losing money rapidly due to leverage. 66% of retail investor accounts lose money when trading CFDs with this provider. You should consider whether you understand how CFDs work and whether you can afford to take the high risk of losing your money.
Stratos Global LLC (tradu.com ):
Losses can exceed deposits.
Please be advised that the information presented on TradingView is provided to Tradu (‘Company’, ‘we’) by a third-party provider (‘TFA Global Pte Ltd’). Please be reminded that you are solely responsible for the trading decisions on your account. There is a very high degree of risk involved in trading. Any information and/or content is intended entirely for research, educational and informational purposes only and does not constitute investment or consultation advice or investment strategy. The information is not tailored to the investment needs of any specific person and therefore does not involve a consideration of any of the investment objectives, financial situation or needs of any viewer that may receive it. Kindly also note that past performance is not a reliable indicator of future results. Actual results may differ materially from those anticipated in forward-looking or past performance statements. We assume no liability as to the accuracy or completeness of any of the information and/or content provided herein and the Company cannot be held responsible for any omission, mistake nor for any loss or damage including without limitation to any loss of profit which may arise from reliance on any information supplied by TFA Global Pte Ltd.
The speaker(s) is neither an employee, agent nor representative of Tradu and is therefore acting independently. The opinions given are their own, constitute general market commentary, and do not constitute the opinion or advice of Tradu or any form of personal or investment advice. Tradu neither endorses nor guarantees offerings of third-party speakers, nor is Tradu responsible for the content, veracity or opinions of third-party speakers, presenters or participants.

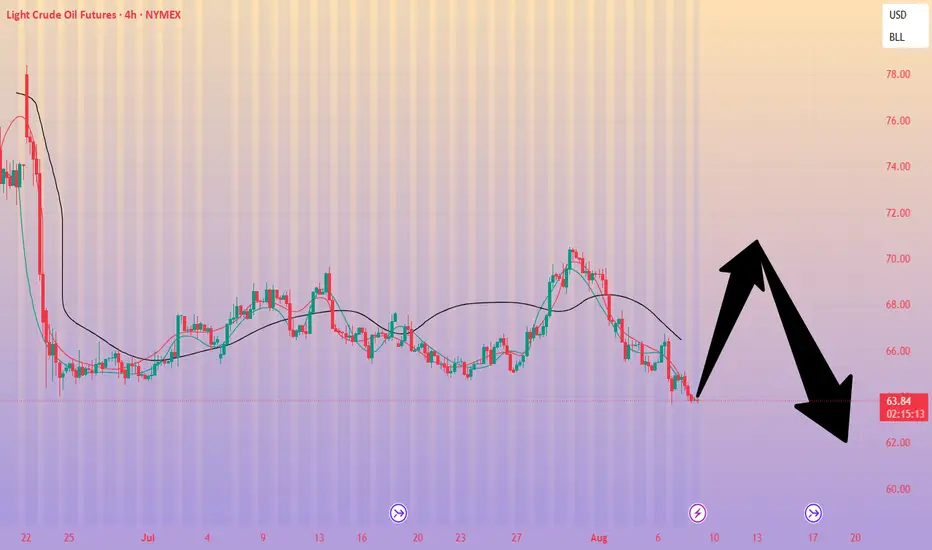
Crude oil: Sell around 66.50, targeting 63.00-60.00Crude Oil Market Analysis:
We've stated this dozens of times before: the overall trend of crude oil is bearish. As long as crude oil doesn't break above 70.00, we can maintain our bearish outlook. Today, we maintain our bearish outlook and continue to sell on any rebounds. Crude oil fundamentals don't support buying. The previous easing of tensions in the Middle East has also been suppressing crude oil prices for a long time, and the ever-changing tariff war is also suppressing crude oil. However, crude oil hasn't broken through 63.00 yet. Today, we're focused on selling if it breaks through. If it doesn't, we'll wait for a small rebound to sell. Focus on selling at 66.50.
Fundamental Analysis:
The tariff war has been the most influential fundamental factor affecting gold recently, and in the long term, it supports gold. This surge in gold prices is driven by Trump's renewed turmoil. Furthermore, the Federal Reserve's future monetary policy remains a key focus.
Trading Strategy:
Crude oil: Sell around 66.50, targeting 63.00-60.00.
WTI(20250808)Today's AnalysisMarket News:
① Trump nominated Stephen Milan, Chairman of the White House Council of Economic Advisers, to serve on the Federal Reserve Board, with a term ending January 31, 2026.
② Waller is reportedly a leading candidate for the next Fed Chair.
③ U.S. Treasury Secretary Bensont stated that the interview process for the Fed Chair has begun.
④ Bostic stated that the July jobs report did change the Fed's outlook on its employment goals.
Technical Analysis:
Today's Buy/Sell Levels:
63.55
Support and Resistance Levels:
64.86
64.37
64.06
63.05
62.73
62.24
Trading Strategy:
If the price breaks above 63.55, consider entering a buy position, with the first target price being 64.06.
If the price breaks below 63.05, consider entering a sell position, with the first target price being 62.73.

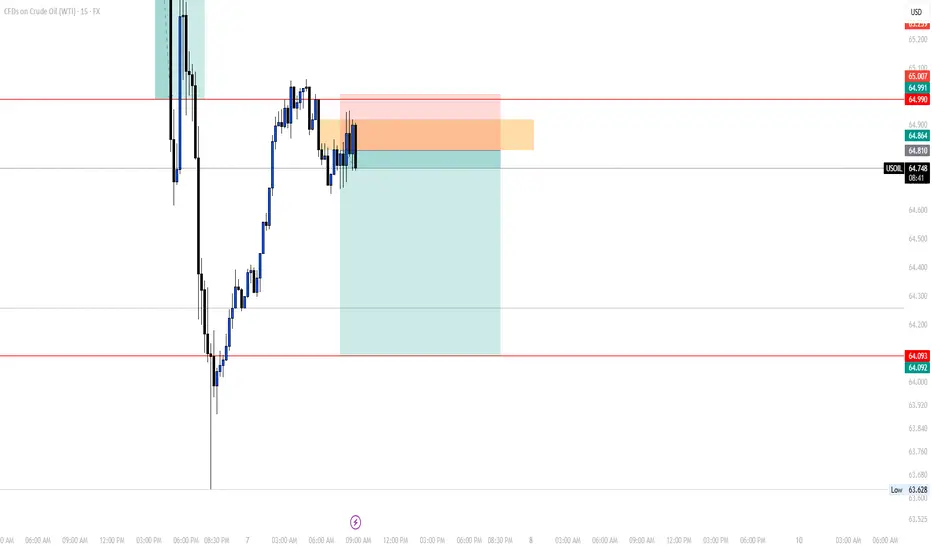
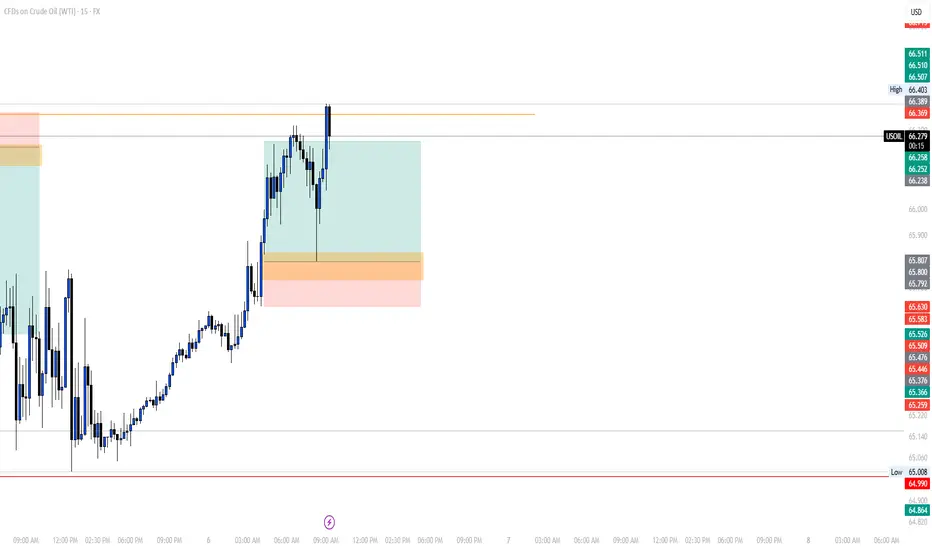
TP REACHEDOur 2nd trade of the day closed with profits.
We choose to close our trade right before it reached the main TP due to one reason, a pullback on a Liquidity lvl we have at 64.178 (5min chart).
It was a great day!
See you tomorrow!
Follow for more!
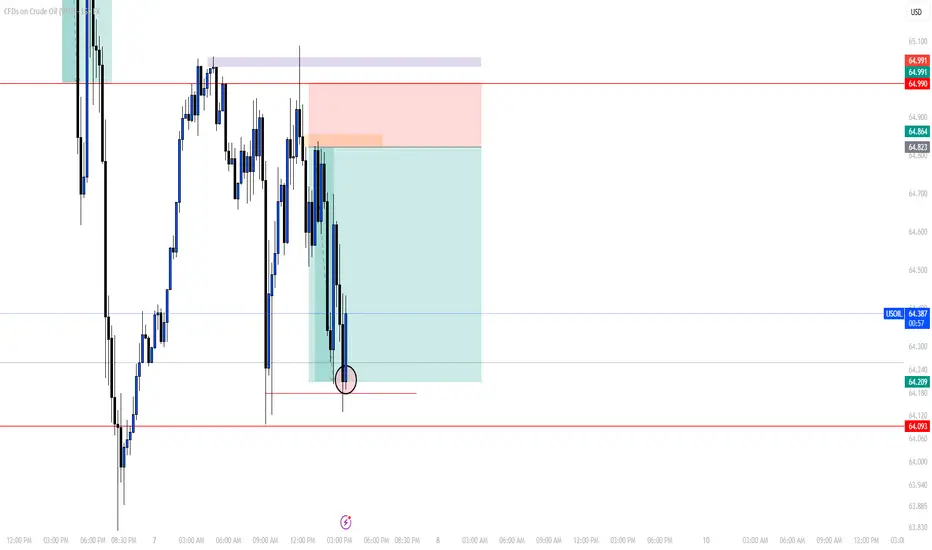
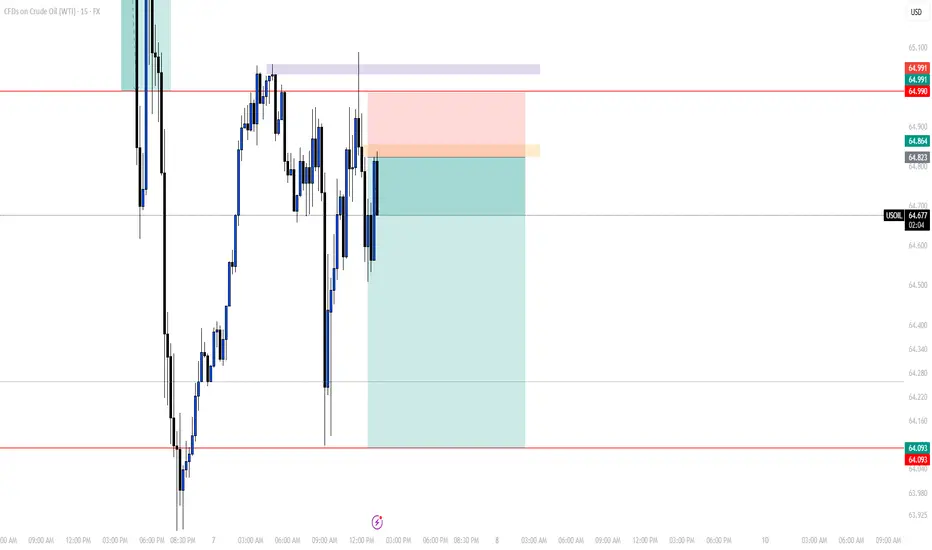
SELL USOILOur 2nd trade if the day on USOIL is a short one again since the price kept grabbing BSL to continue pushing lower and lower.
You can sell and follow the same levels as mine
Follow for more!
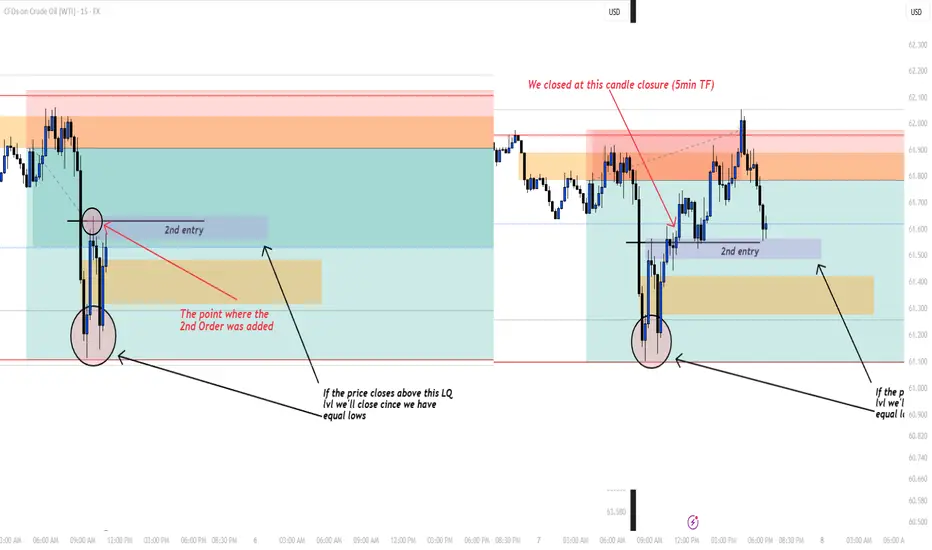
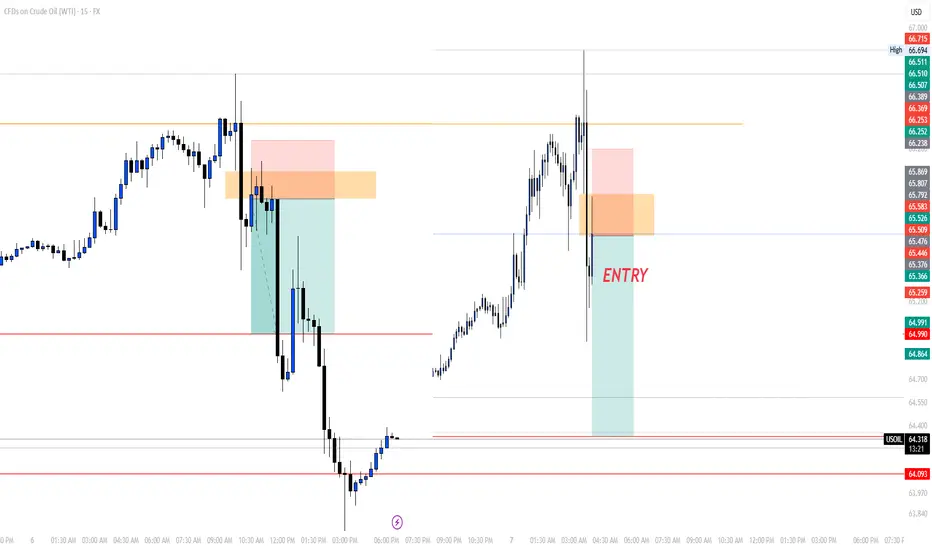
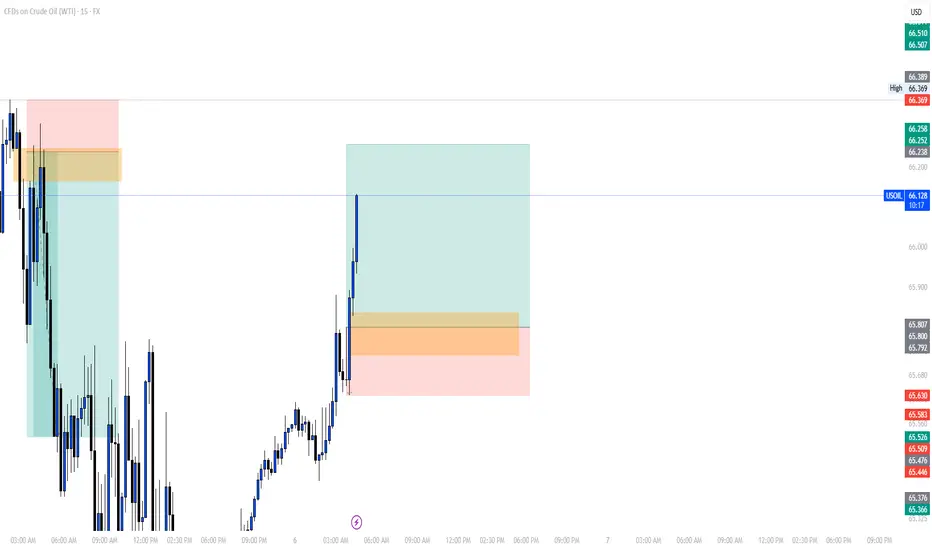
UPDATE ON THIS MORNING'S TRADEEarly in the morning, I posted a trade (Sell USOIL) in which we trargeted the LQ level which the market came closer to and didn't touch, which isn't a big deal.
As you can see on the chart, as I told my students during the LIVE TRADING SESSION they assisted, it's all about trade management.
On the screenshot on the left, we added another order at 50% lvl of the FVG, xhich the market respected at that moment before giving us a double bottom which is a sign to the change of the movement of the market.
For a safe closure of the trade, as you can see in the picture on the left, we waited for the market to break through the 5min LQ we have to close, and that's what exactly happened.
We'll wait for another trade to take later in the US session.
Follow for more!
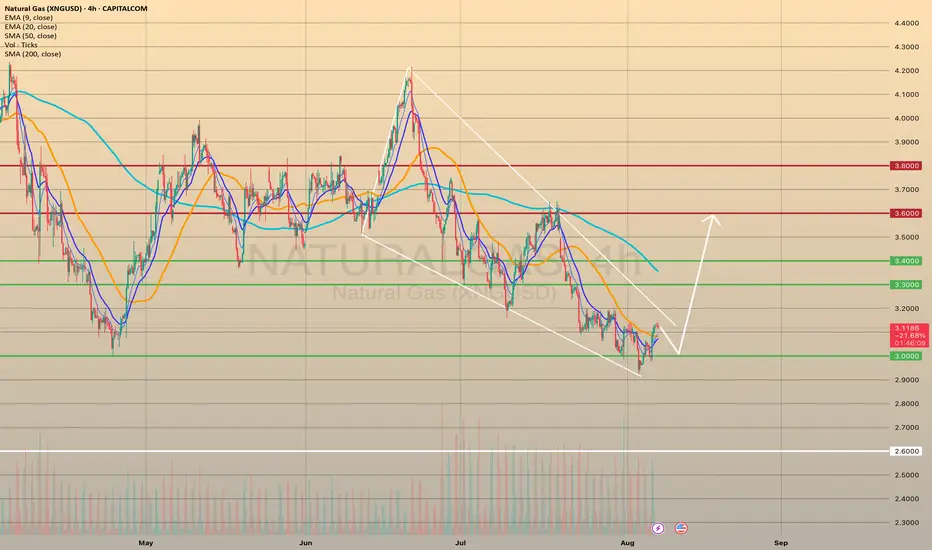
Natural Gas XNG: Trend Reversal or Just a Retracement?Natural Gas (XNG) has been trending bearish 🔻, but we’re now witnessing a bullish market structure shift ⚡— particularly visible on the 4H timeframe ⏱️. At present, price is overextended and pressing into a key resistance zone 📈🧱. I’m watching closely for a retracement back into equilibrium 🔄 within the previous price swing. This could offer a short-term scalp or day trade short setup 🎯.
Should price hold firm at support after the pullback 🛑, we could then begin building a bullish bias and look for long opportunities 📊— depending on how price action develops from there. 🚨 This is not financial advice.

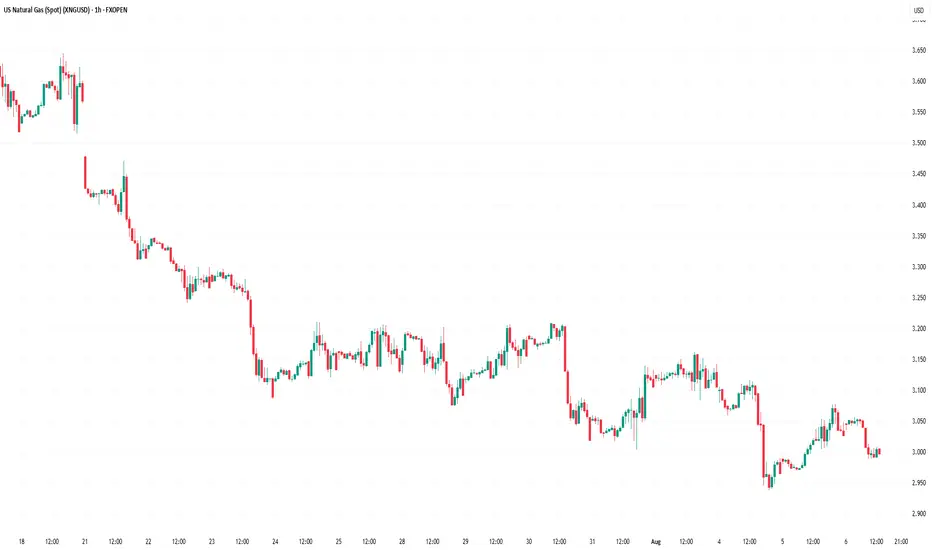
U.S. Hot temperature boosted natural gas prices. For how long?U.S. Hot temperature boosted natural gas prices. For how long?
U.S. natural gas futures rose ~2% August 6 due to near-record LNG export flows and forecasts of hotter-than-normal weather through late August, boosting air conditioning demand and gas use by power plants (over 40% of U.S. electricity). Despite a hot summer, record production has kept gas stockpiles ~6% above normal, with storage likely to grow further.
Technically, price seems to form bullish wedge since mid - August. Price successfully tested the level of 3.0000, still can go on a retest of this level soon once again before some mid-term bullish momentum occurs. Additionally, according to seasonals, since the second half of the august, natural gas prices go bullish due to the beginning of the shoulder season.
SELL USOILThis morning we're going short again on OIL, since as you can see the price grabbed the LQ and gave us a proper rntry point we entered based on 1h ago.
Follow for more!
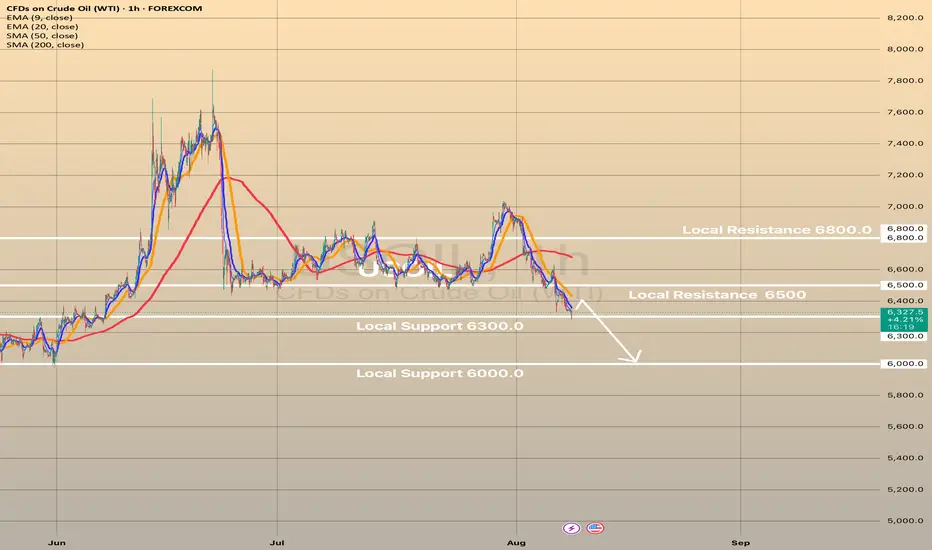
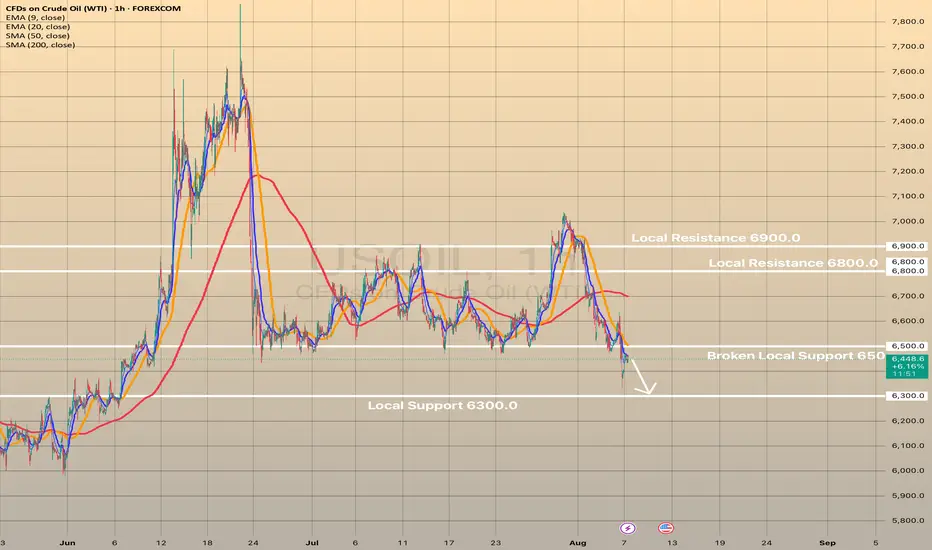
USOIL declines on possibility of geopolitical stabilityUSOIL declines on possibility of geopolitical stability
Crude oil and gasoline prices fell August 6 after an early rally, as Trump announced "great progress" in U.S.-Russia talks to end the Ukraine war, reducing fears of new sanctions on Russian energy exports. Additionally, OPEC+’s planned 547,000 bpd production increase for September further pressured prices amid concerns of a global oil supply glut.
Technically, USOIL broke crucial local support at 6,500.00. Currently, the price is retesting this level. The decline towards 6,300.00 is expected in short-term.
OUR TRADE FOR THE DAYEarly today, I posted that we'll be waiting for the market to give us an entry after grabbing the liquidity, we did have it and caught it.
I didn't share it since it was given to my students.
As you can see on the chart, the market gave us a FVG after that it did grab the liquidity which we entered based on to target again the LQ level to close with a good margin.
Follow for more!
Natural Gas Bullish Recovery?Nat gas has recovered key technical levels with a strong rally today.
Looking at the daily chart we got a close above the 7 MA staging a potential 3 bar surge setup.
Nat gas looks to be targeting 3.18 in the near term...
Inventory report tomorrow: 10B forecast for inventories.
A potential arbitrage opportunity setting up for EQT, upside calls for next week.

RBOB from $2.08 to $1.23Crude is in a downtrend and therefore so is RBOB and any other crude products. "Drill baby drill" as he says :/
Good luck!

WTI Under Attack – Rob the Market with This Bear Setup🛢️💣 WTI Oil Short Raid: Bearish Heist Activated! 💣🛢️
📉 Thief Trader’s Limit-Layered Attack Plan 🔐
💥 Attention Market Robbers & Chart Breakers! 💥
We're about to break into the XTIUSD / US Oil Spot vault — Bearish style.
🚨 The Setup:
This ain’t your average breakout — we’re talking high-precision, multi-layered entries on a downside raid.
🧠 Thief Trader Strategy: Drop limit orders at key zones like trip wires. Let price walk into your trap.
🎯 Plan:
🧱 Entry: Any level after MA resistance confirmation.
Layer multiple limit orders — DCA-style — after trend shows weakness.
🛑 Stop Loss: 66.300 🔒
Protect your vault. Place SL just above major 4H rejection zone.
🎯 Target: 60.000 💰
Profit at exhaustion level. This is where bulls cry, and we cash out.
🧠 Robbery Logic Backed By:
COT Data 📊
Crude Oil Inventories 🛢️
Macro + Sentiment Flows 🌐
Technical MA Break + Retest Patterns 🎯
🔥 Why this isn’t a random short?
Because thieves do research — not guesswork.
Bulls have overextended. Oil’s price is reacting to strong supply pressure and weakening demand outlook.
⚠️ Risk Note:
No entry without trend confirmation.
No blind shots — place alerts and wait for the setup.
This is a sniper job, not a shotgun spray.
💬 Join the Robbery Crew
Smash that ❤️ & Boost if you're riding with the thieves!
Drop your charts, entries, or sniper shots in the comments 💬
We rob together. We win together.
🔔 Follow for more heist plans – next market break-in coming soon.
💰 Rob Smart. Trade Sharp. Exit Clean. 🏴☠️

TRADE CANCELEDThis morning I posted to take a long trade and we canceled it since the price didn't come to our entry point which is a normal thing to happen, now after that it took the daily LQ, we'll be waiting for the price to give us a sort entry to take.
Follow for more!
Crude Oil: Equilibrium, Key Levels & Trade ScenariosNYMEX:CL1! NYMEX:MCL1!
Market Recap
In our prior crude oil commentary, we identified a bullish flag formation with key support anchored at the Q3 micro composite Value Area Low. Following a measured pullback, prices decisively reclaimed the Q3 micro composite Value Area High, subsequently advancing toward the $70 level. However, this upward momentum proved unsustainable, with prices unable to maintain higher ground. We have since retraced to the yearly open, where the market is now consolidating.
Current Market Structure
Crude oil is presently exhibiting a balanced profile. Notably, the composite Volume Points of Control (VPOC) for both the yearly and quarterly profiles are overlapping — a technical signal indicative of equilibrium in positioning.
Market Performance Assessment
Price action in recent sessions has been heavily influenced by shifts in the global demand outlook, which in turn remain sensitive to macroeconomic expectations, geopolitical events, and OPEC+ V8 members’ gradual unwinding of voluntary production cuts. Despite the prevailing headwinds — including tariff disputes, Russian sanctions, and broader trade tensions — crude oil has demonstrated resilience, consistently trading above the $65 threshold.
Forward Outlook
Attention will turn to today’s EIA release at 9:30 a.m. CT, which may serve as the primary catalyst for near-term directional bias.
Key Technical Levels
• Q3 mCVAH: 67.28
• Neutral Zone: 66.45 – 66.30
• Yearly Open: 66.34
• Intermediate Support: 65.80
• CVPOC / mCVPOC: 65.54
• Q3 mCVAL: 64.95
• Support Zone: 65.00 – 64.80
Trading Scenarios
• Scenario 1 — Yearly Open Rejection
Monitor the Yearly Open (66.34) as an initial resistance level. A rejection here could prompt a tactical pullback toward the Line in the Sand (LIS), offering long entry opportunities with a target above the yearly open.
• Scenario 2 — DOE-Driven Flush & Recovery
Should the DOE data trigger a downside push, watch for a swing failure at recent lows. A close back above prior levels would present a potential long setup, with conviction increasing on sustained price action above 65.80.

Natural Gas Prices Fall to Yearly LowNatural Gas Prices Fall to Yearly Low
Analysing the chart on 22 July, we constructed a descending channel and assumed that natural gas prices would continue to form a bearish market structure of lower highs and lower lows. Since then, the market has declined by almost 10%.
As the XNG/USD chart shows today, natural gas prices are hovering around the psychological level of $3.000/MMBtu. Earlier this week, gas was trading around $2.940/MMBtu — the lowest level of 2025.
According to media reports, the price decline is driven by both high production levels and favourable weather forecasts for August, the hottest month of the year. What might happen next?
Technical Analysis of the XNG/USD Chart
We have updated the descending channel, taking into account the recent fluctuations in natural gas prices.
The chart shows that bearish momentum remains intact — the rise from point B to C appears to be a corrective rebound within the prevailing downward trend, with the following developments:
→ point C formed in the 0.5–0.618 area, which corresponds to classic Fibonacci retracement levels following the A→B impulse;
→ the former support at 0.365 has now become resistance.
Bulls may hope that the current sentiment could shift following tomorrow’s natural gas storage report (scheduled for 17:30 GMT+3). A drop in inventories could potentially trigger a bullish impulse on the XNG/USD chart.
This article represents the opinion of the Companies operating under the FXOpen brand only. It is not to be construed as an offer, solicitation, or recommendation with respect to products and services provided by the Companies operating under the FXOpen brand, nor is it to be considered financial advice.
BUY USOILI'm sharing with you our trade today on OIL.
The reason we're buying is because yesterday the market grabbed the LQ now it is reversing to climb higher to fill all of the FVG we got in the previous movement.
For a safe entry, wait for the price to come back to our entry poin at 65.800 since I myself am waiting for the price to come to our entry point.
Follow for more!
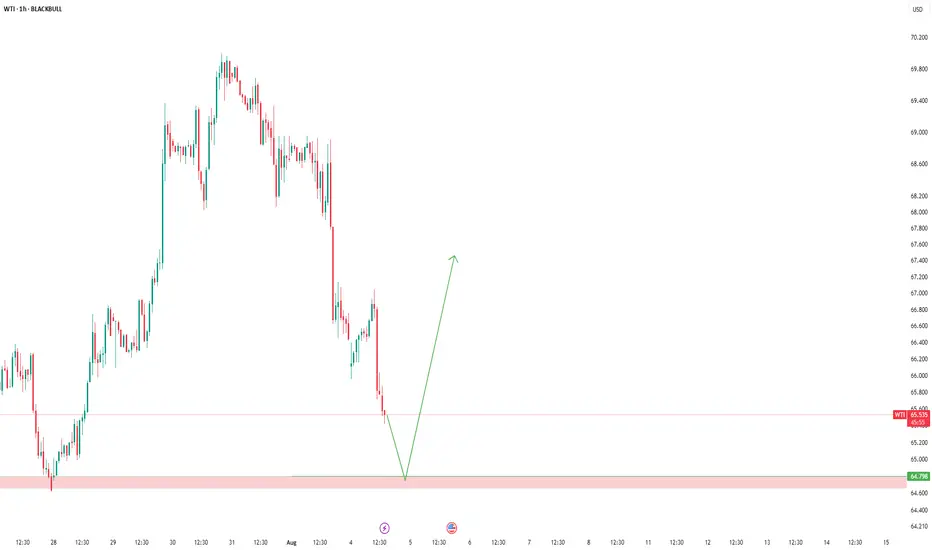
WTI Crude Oil – Range Support in FocusWe're waiting for price to reach the bottom of the range, and with a solid buy signal, we’ll consider going long.
However, since this level has been tested multiple times, it’s highly vulnerable to stop fishing — so caution is key.
As always, we’re ready for all scenarios:
If price breaks below, we’ll wait for a pullback to enter short.
But right now, we’re watching the range support for potential longs
XBRUSD Robbery Setup: Thief's Bear Trap is Active! 🔥💰BRENT BEARISH HEIST PLAN💰🔥
🎯 Asset: XBRUSD / UK Oil Spot / BRENT
🧠 Strategy: Layered Limit Orders | Bearish Robbery in Progress
💼💣💼
Yo Money Movers & Market Jackers!
It’s time to load up the truck and roll out — the BRENT vault is cracked open and dripping with bearish loot! 🐻💵🔓
🎩 This isn’t just trading — this is Thief Trading Style™.
We don’t chase candles. We layer the loot, wait in the shadows, and strike on the pullback. No mercy. Just money. 💸🕶️
🚨 THIEF'S TRADE SETUP 🚨
🕵️ Entry Point:
Any Price Level – we’re everywhere.
Place layered Sell Limits like tripwires on the chart 🎯💣 — 15m or 30m candle nearest swing highs. The trap is set.
🛑 Stop Loss:
🔒 Locked @ 69.50 — right above resistance
This is a tactical retreat, not a failure. Every heist needs an escape route. 📉🔁
🎯 Target Zone:
💥 Aim for 67.00 — smash and grab style.
Get in, take profit, disappear into the shadows.
🧠 WHY THE HEIST?
The BRENT market looks ready for a rug pull —
🧊 Demand slowing
📉 Bearish structure unfolding
🎭 Bull traps getting exposed
🔥 Perfect time for thieves to cash out while the herd dreams green
Before pulling the trigger, check:
📰 Fundamentals 📦 Inventory Data 🧭 Intermarket Analysis 📊 COT Reports
Do your homework — then rob it like a professional. 🧠💼🔎
⚠️ MISSION WARNING ⚠️
Avoid new trades during news drops!
Use trailing SLs to protect loot. This market doesn’t play fair — but we don’t either. 🛑📰📉
💥 Hit BOOST if you're riding with the robbers!
Let’s show this market how Thief Traders steal gains like legends.
Every like = one more gold bar in the van 💰🚚💨
Stay sharp. Stay shadowed.
See you on the next job. 🐱👤💸📉
🔗 #Brent #XBRUSD #UKOil #ThiefTrader #BearishSetup #EnergyMarket #LayeringStrategy #MarketRobbery #SellThePump #RobTheChart
