WTI(20250806)Today's AnalysisMarket News:
The US non-manufacturing PMI fell to 50.1 in July from 50.8 in June, below the expected 51.5. The ISM New Orders Index fell to 50.3 in July from 51.3 in June, with export orders contracting for the fourth time in five months.
Technical Analysis:
Today's Buy/Sell Levels:
64.90
Support and Resistance Levels:
66.21
65.72
65.40
64.40
64.08
63.59
Trading Strategy:
On a break above 64.90, consider a buy entry, with the first target at 65.40. On a break below 64.40, consider a sell entry, with the first target at 64.08
Energy Commodities

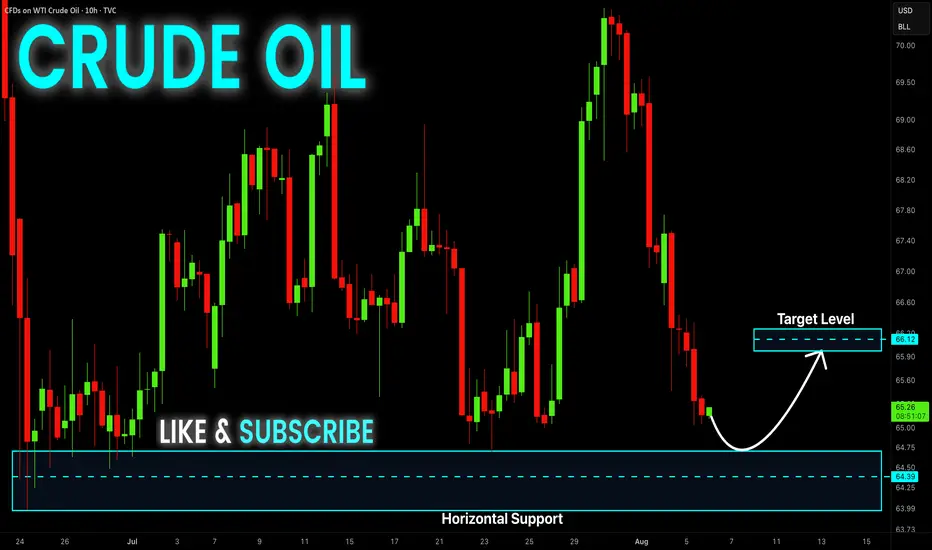
CRUDE OIL Bullish Bias! Buy!
Hello,Traders!
CRUDE OIL keeps falling down
And the price will soon hit
A horizontal support of 64.00$
From where we will be
Expecting a local bullish rebound
Buy!
Comment and subscribe to help us grow!
Check out other forecasts below too!
Disclosure: I am part of Trade Nation's Influencer program and receive a monthly fee for using their TradingView charts in my analysis.
USOIL FREE LONG SIGNAL|
✅CRUDE OIL retested the strong support level of 65.14$
After trading in a local downtrend from some time
Which makes a bullish rebound a likely scenario
With the Take Profit of 65.93 and SL of 64.69$
LONG🚀
✅Like and subscribe to never miss a new idea!✅

Crude Oil Bouncing from Demand Zone – Eyes on UpsideThis is the daily chart of Crudeoil!
CRUDEOIL1! having a good law of polarity (support)near at 5550-5600 range.
CRUDEOIL1! is taking support on RSI and sustain above 45 level.
If this level is sustain then we may see higher prices in CRUDEOIL1!.
Thank You !!

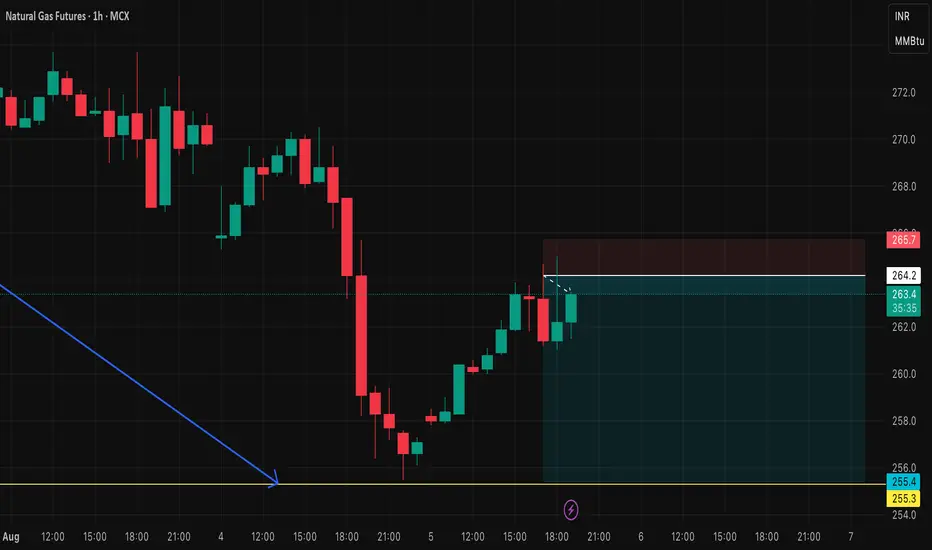
NF FUT short setupNG FUT short setup
Entry price - 264.2
Stop loss - 265.7
Target - 255.5
Risk Reward - 1:5.6
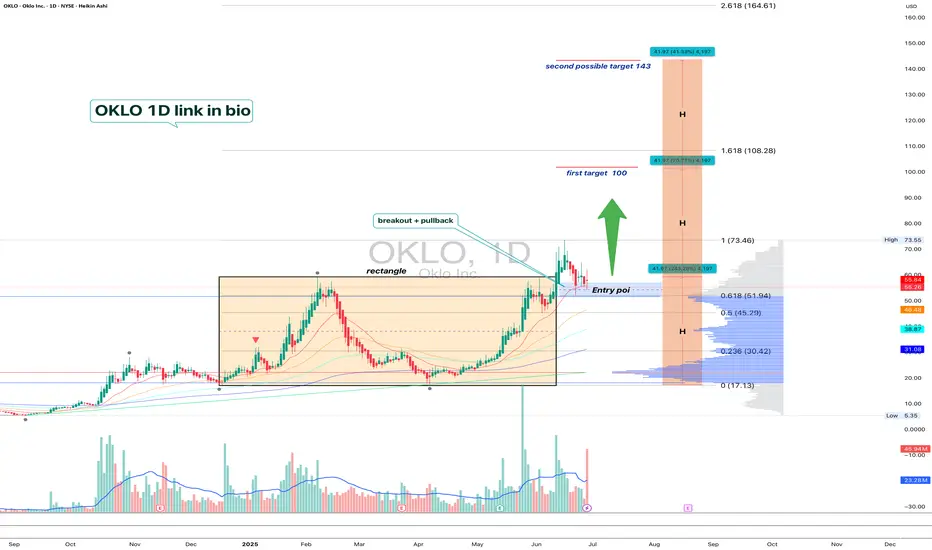
OKLO — when nuclear momentum breaks resistanceSince late 2024, OKLO had been consolidating inside a clear rectangle between $17 and $59. The breakout from this long-term range triggered a new bullish impulse. The price has since returned to retest the breakout zone, now aligned with the 0.618 Fibonacci retracement at $51.94. The retest has completed, and the price is bouncing upward, confirming buyer interest.
Technically, the trend remains firmly bullish. The price closed above the prior range, EMAs are aligned below, and the volume spike during breakout supports genuine demand. The volume profile shows a clean path toward $100, indicating limited resistance ahead. The structure suggests a controlled rally rather than an exhausted move.
Fundamentally, OKLO is a next-generation SMR (Small Modular Reactor) company focused on delivering compact, efficient nuclear power solutions. Following its public debut via SPAC and recent capital injection, OKLO is transitioning from development to implementation. Institutional interest is holding strong, and the broader move toward decarbonization and energy independence places the company in a strategic position.
Target levels:
— First target: $100 — psychological and technical resistance
— Second target: $143 — projected from prior range breakout
OKLO isn’t just another clean energy ticker — it’s a quiet disruptor with nuclear potential. The chart broke out. The volume confirmed. Now it’s time to see if the market follows through.
USOILUSOIL price is now testing the support zone of 64.72-63.88. If the price cannot break through the 63.88 level, it is expected that the price will rebound. Consider buying in the red zone.
🔥Trading futures, forex, CFDs and stocks carries a risk of loss.
Please consider carefully whether such trading is suitable for you.
>>GooD Luck 😊
❤️ Like and subscribe to never miss a new idea!

Crude Oil Resumes Its WeaknessCrude oil rised and then fell sharply from above 78 dollars back in June, after tensions in the Middle East. The drop unfolded as an impulse into wave A, so even if this is just a counter-trend move down from 78, it still appears incomplete. After we recently spotted a corrective rally in wave B that nicely stopped at projected $70 resistance near 61,8% Fibo. retracement, we can now see it resuming lower within projected wave C towards 60-59 area at least, if not even lower.

WTI quick update. Will we see that 65-dollar break?After OPEC+ meeting, where a promise was made to increase production in September, WTI continues to slide. Let's dig in.
MARKETSCOM:OIL
TVC:USOIL
Let us know what you think in the comments below.
Thank you.
75.2% of retail investor accounts lose money when trading CFDs with this provider. You should consider whether you understand how CFDs work and whether you can afford to take the high risk of losing your money. Past performance is not necessarily indicative of future results. The value of investments may fall as well as rise and the investor may not get back the amount initially invested. This content is not intended for nor applicable to residents of the UK. Cryptocurrency CFDs and spread bets are restricted in the UK for all retail clients.

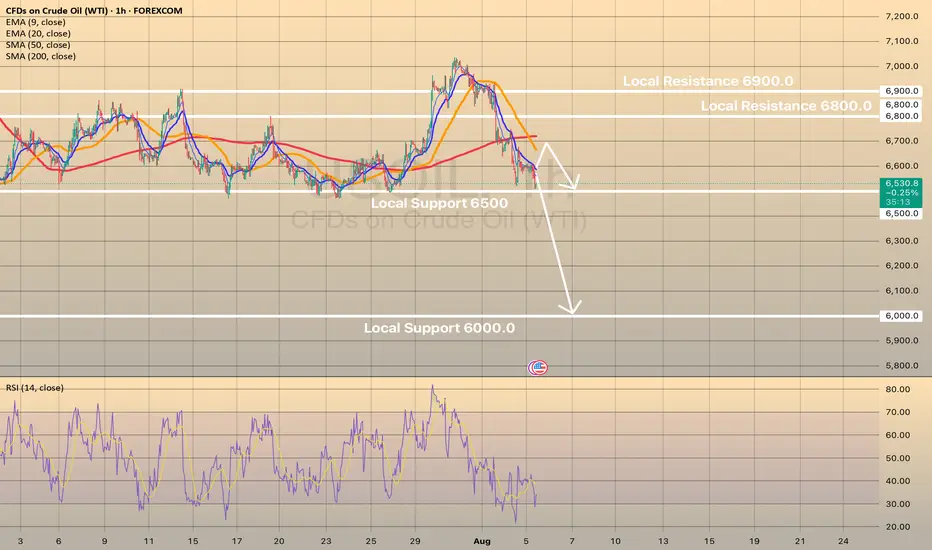
USOIL drops on rising supply and demand concernsUSOIL drops on rising supply and demand concerns
Oil prices fell Tuesday as OPEC+ planned a 547,000 bpd output increase for September, overshadowing potential Russian oil supply constraints from U.S. policies. Brent and WTI crude dropped to their lowest in a week, marking a fourth consecutive decline. OPEC+’s reversal of 2.5 million bpd cuts, combined with weak demand outlooks due to U.S. recession risks and China’s lack of new stimulus, pressured prices. Trump’s threatened 100% tariffs on Russian crude buyers like India, which imports 1.75 million bpd, heightened trade tensions but failed to lift oil prices. Analysts warn U.S. tariffs could further weaken global growth and fuel demand.
USOIL shows some in-moment strength on RSI on 1-h chart, the price may rebound towards sma200 at 6,700.00. However, in long-term perspective, low oil price is expected. Eventually, the price may decline towards level of 6,000.00.
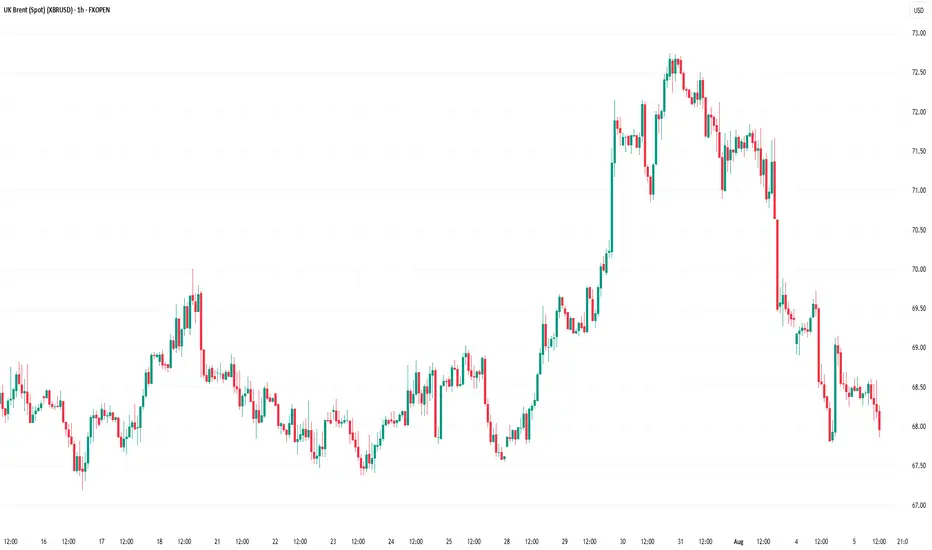
XBR/USD Chart Analysis: Oil Price Declines Towards Key SupportXBR/USD Chart Analysis: Oil Price Declines Towards Key Support
As the XBR/USD chart shows, Brent crude oil has made two significant moves recently:
Last week’s price increase (A) followed President Donald Trump’s intentions to impose tariffs on India due to its purchases of Russian oil. This could have disrupted established oil supply chains.
The price decline (B) may have been driven by both the decision of OPEC+ countries to increase production and reports of a weakening US labour market.
Thus, there is reason to believe that the more than 4.5% decline in Brent crude oil prices since the beginning of August reflects market participants’ scepticism about sustained high oil prices:
→ this has a negative impact on the US economy (JP Morgan analysts raised concerns about recession risks this week);
→ increased activity from oil producers may offset supply chain disruption risks.
Technical Analysis of the XBR/USD Chart
From a technical analysis perspective, Brent crude oil has dropped to a key support level (marked in blue), which was previously active in July. A rebound from this line could happen – in such a case, the price might face resistance at the Fair Value Gap area (marked in orange), formed between:
→ $70.81 – a support level active in late July, which was broken;
→ the psychological level of $70.00.
Attention should also be paid to price behaviour around the $69.00 level (indicated by arrows) – it quickly switched roles from support to resistance, indicating aggressive bearish sentiment. Given this observation, a potential bearish breakout attempt below the blue support line cannot be ruled out.
However, whether this scenario materialises will largely depend on developments in geopolitical risks and tariff agreements.
This article represents the opinion of the Companies operating under the FXOpen brand only. It is not to be construed as an offer, solicitation, or recommendation with respect to products and services provided by the Companies operating under the FXOpen brand, nor is it to be considered financial advice.
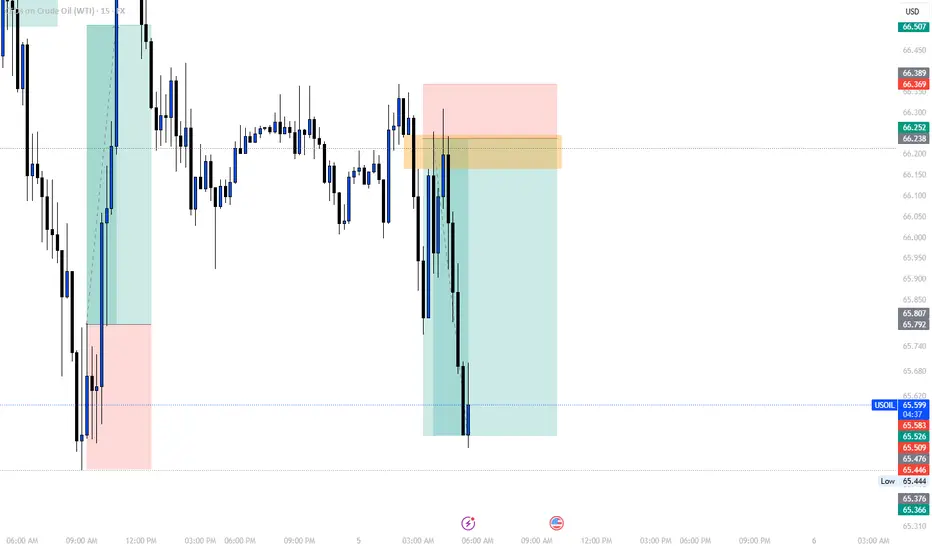
TP REACHED ON OUR TRADE ON OILEarly this morning I posted to sell on OIL, now here I am with the results of the price reaching our TP.
Our entry was based on a reversal and a FVG as you can see on the chart, target was the previous low which the market exactly reached.
Follow for more!
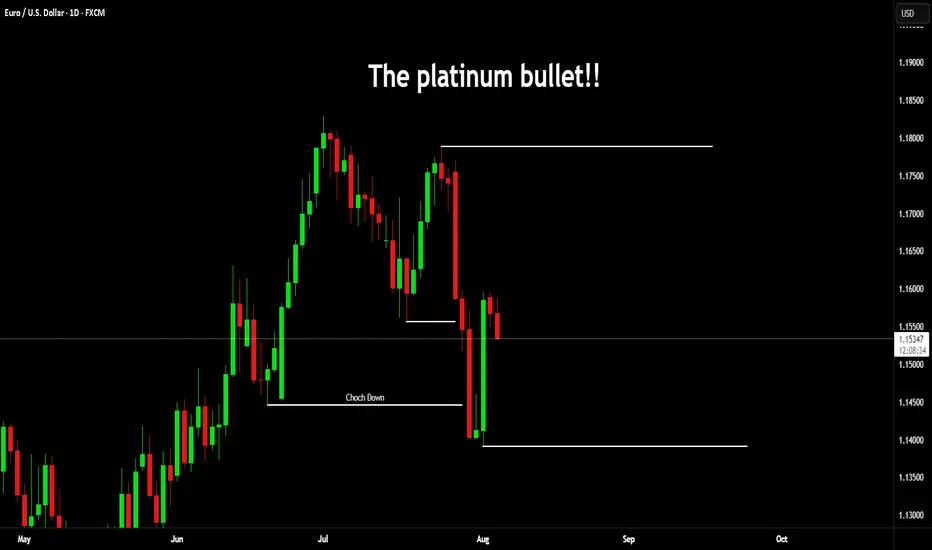
The Platinum BulletOver the years, I have posted a lot of educational content here on TradingView. Everything from Elliot waves to Wyckoff, psychology to Gann.
I have been lucky as a trader, 25 years doing this you pick up a thing or two. But above everything else, what you realise is that trading is a mindset game and not a technical one.
Many new traders try their luck. They are either experts in another field or simply successful in something else, or they come to the trading arena seeking wealth.
Both tend to get humbled quickly.
It is common for many new traders to put so much emphasis on the strategy, they overlook the psychology. You see, a strategy might work for someone, but you can't get it to work for you. This could simply be the time on the charts you lack, the timeframe or the instrument you are trading. The account balance or the fact you are not used to seeing 3-4 losses in a row.
When it comes to trading, less really is more!
Here's a simple one for you.
Take the mechanical range post I posted.
Now look at this;
On the larger timeframes we can see clearly the ranges and the supply/demand.
Then dropping down to the daily.
This is where, the technical aspect becomes less important and the psychology behind the move shows it's hand.
I have added volume and the AD line just to show how obvious this can be.
What do you see? Well as the price goes up, the volume goes down, we know we took liquidity to the upside.
So, if nothing else you would anticipate a pullback phase.
Then you get the clarity. Price drops and then pushes back, yet fails to make a new high. Almost like the volume told you it was about to happen.
Where did it pull back to?
Adding a simple volume profile too, from the swing high to the swing low. You can see the majority of the sell off (PoC) happened at a specific price point. Price pulled back to exactly that region before dropping.
The drop caused a local change in character and immediately took out the swing low - the last swing low of the leg up. (the real change in the trend).
There is obviously more to cover than this, but that is for another post.
Once you learn the way markets capitalise on the fear, the greed, the herd mindset, sentiment of the retail crowd. You can use the sentiment analysis in your favour.
You don't need 6 screens, fancy indicators, there is no silver bullet or 100% win rate strategies. And no a bot won't make you a Billionaire overnight.
If it was that easy, we would have no doctors, lawyers or firefighters; they would all be professional Bot traders.
Simplify your approach, put emphasis on the proper mindset, psychology and risk management and you will do alright!
Stay safe in the markets!
Some other recent posts;
Disclaimer
This idea does not constitute as financial advice. It is for educational purposes only, our principal trader has over 25 years' experience in stocks, ETF's, and Forex. Hence each trade setup might have different hold times, entry or exit conditions, and will vary from the post/idea shared here. You can use the information from this post to make your own trading plan for the instrument discussed. Trading carries a risk; a high percentage of retail traders lose money. Please keep this in mind when entering any trade. Stay safe.
SELL USOILI'm sharing with you our trade for this morning on OIL, which we caught based on a reversal and the 2:25am (NY Time) FVG.
Follow for more!

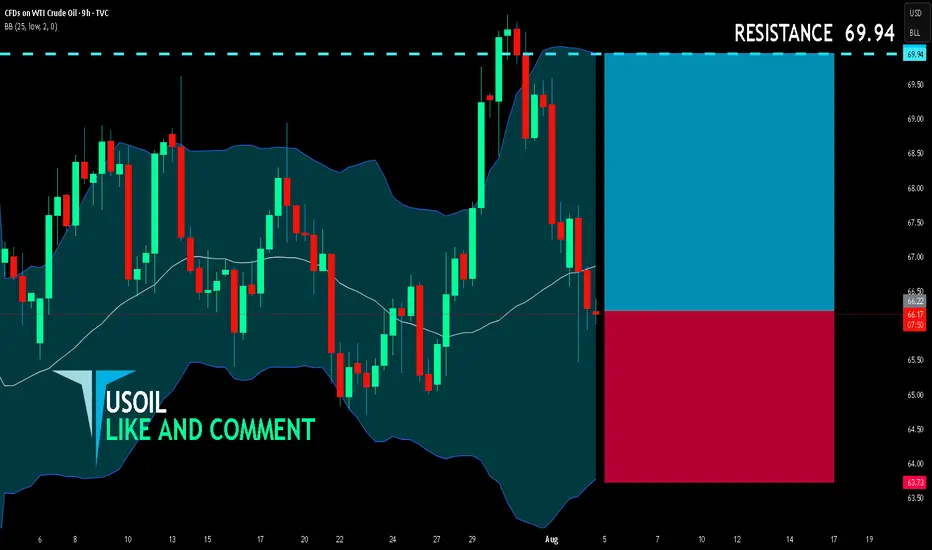
USOIL BULLISH BIAS RIGHT NOW| LONG
USOIL SIGNAL
Trade Direction: long
Entry Level: 66.22
Target Level: 69.94
Stop Loss: 63.73
RISK PROFILE
Risk level: medium
Suggested risk: 1%
Timeframe: 9h
Disclosure: I am part of Trade Nation's Influencer program and receive a monthly fee for using their TradingView charts in my analysis.
✅LIKE AND COMMENT MY IDEAS✅
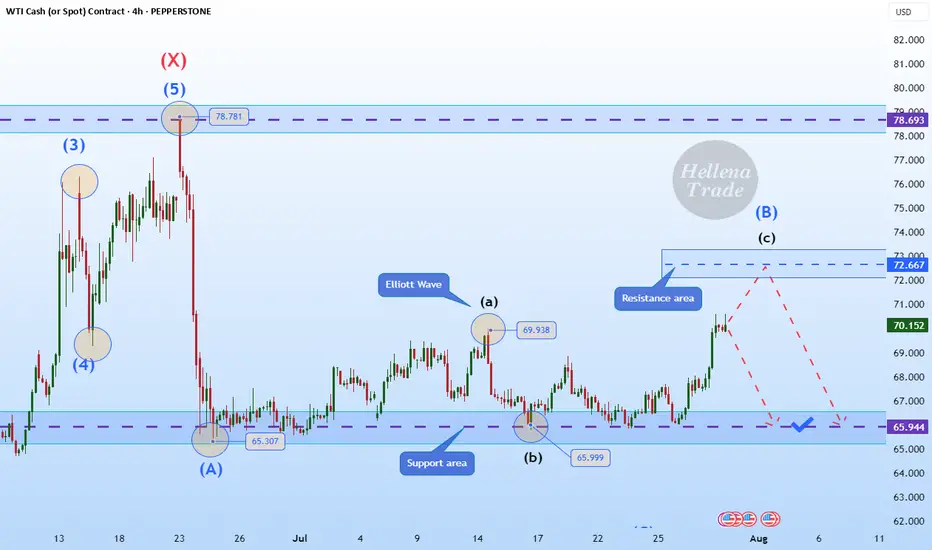
Hellena | Oil (4H): SHORT to support area of 65.944.Colleagues, I previously recommended moving trades to break-even, and for good reason. It is always necessary to hedge and reduce losses—this is part of professional work.
(Breakeven=Risk Free: Move Stop loss to the entry level).
The price has nevertheless shown a stronger correction, and I now believe that the medium-term “ABC” waves have not yet formed, nor has the large “Y” wave.
This means that I expect the completion of wave “B” and then a continuation of the downward movement in wave “C.”
I consider the support area of 65.944 to be the minimum target.
Manage your capital correctly and competently! Only enter trades based on reliable patterns!
WTI(20250805)Today's AnalysisMarket News:
Goldman Sachs: We expect the Federal Reserve to cut interest rates by 25 basis points three times starting in September; if the unemployment rate rises further, a 50 basis point cut is possible.
Technical Analysis:
Today's Buy/Sell Levels:
65.85
Support/Resistance Levels:
67.97
67.18
66.67
65.04
64.53
63.74
Trading Strategy:
If the market breaks above 65.85, consider buying, with the first target at 66.67. If the market breaks below 65.04, consider selling, with the first target at 64.53.
UPDATEOn our 2nd trade of the day we closed before the price reaches our main target.
As y'all can see on the chart, the price couldn't break our 4:30am FVG, so as soon as it came back off it we immediately closed our position with a RR of 1:2
See you tomorrow!

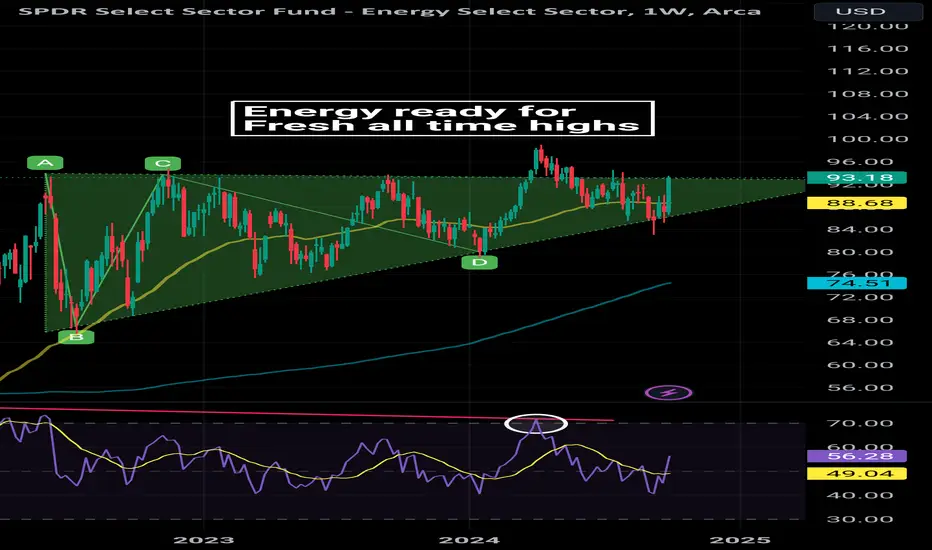
Energy printing fresh highs within weeksHere's a better chart than the one shared in October, showing that energy has been consolidating above an upward sloping triangle formation, over 900 days in the making .
With just under 4% remaining to reach prior highs set in April, fresh highs could be just weeks away. Looking at the height of the triangle to project potential gains, there could be a whopping 30% upside ahead.
Lately I've stepped back to ponder the fundamental underpinnings of this move. During the same period, the price of oil has cratered by 40%.
Charting XLE/BRENT shows an astonishing double during the bullish XLE triangle formation
Could it be something to do with the hot war in Ukraine? Anecdotally we know OPEC+ (Saudio Aramco et al) has continued to hold on output increases, while their western peers (XLE) are pushing more product than ever. One theory is XLE companies have taken market share to account for the decline in prices.
Two questions remain:
would oil prices in the $40's be enough to tank XLE shares?
if XLE can hold historic value during a deeper oil price decline, where could its valuation be headed during the next bull cycle in oil?
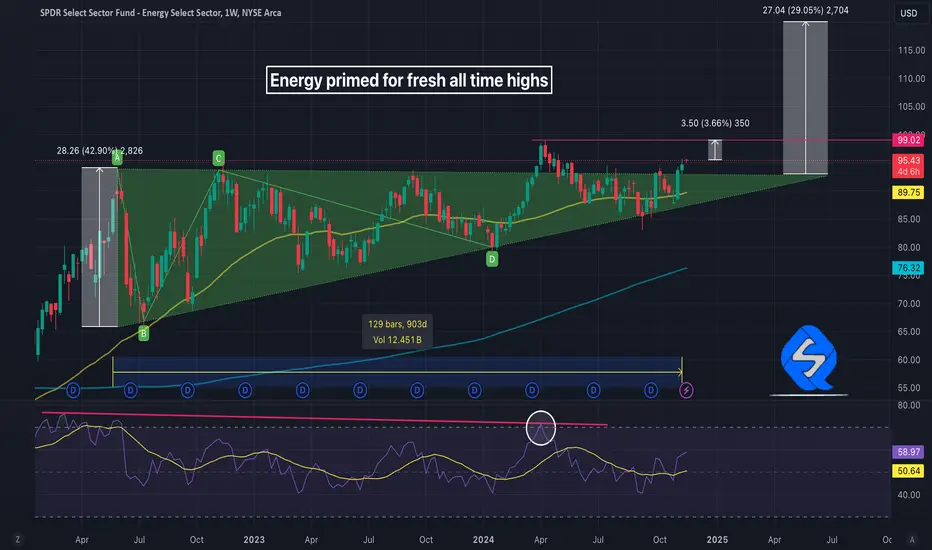
Energy stocks poised for fresh ATHEnergy stocks (XLE) have been in a clear ascending triangle for some months now on the weekly chart. There was a false breakout not too long back, but the pattern held up after breaking down and price is again pushing up against resistance at the top of the triangle.
Having recently posted a massive green candle with the angst in the Middle East, coming weeks and months could bear witness to fresh all time highs.
NATGAS Risky Long! Buy!
Hello,Traders!
NATGAS keeps falling down
In a strong downtrend
And Gas is locally oversold
So after the price hits the
Horizontal support of 2.860$
We will be expecting a
Local bullish correction
Buy!
Comment and subscribe to help us grow!
Check out other forecasts below too!
Disclosure: I am part of Trade Nation's Influencer program and receive a monthly fee for using their TradingView charts in my analysis.

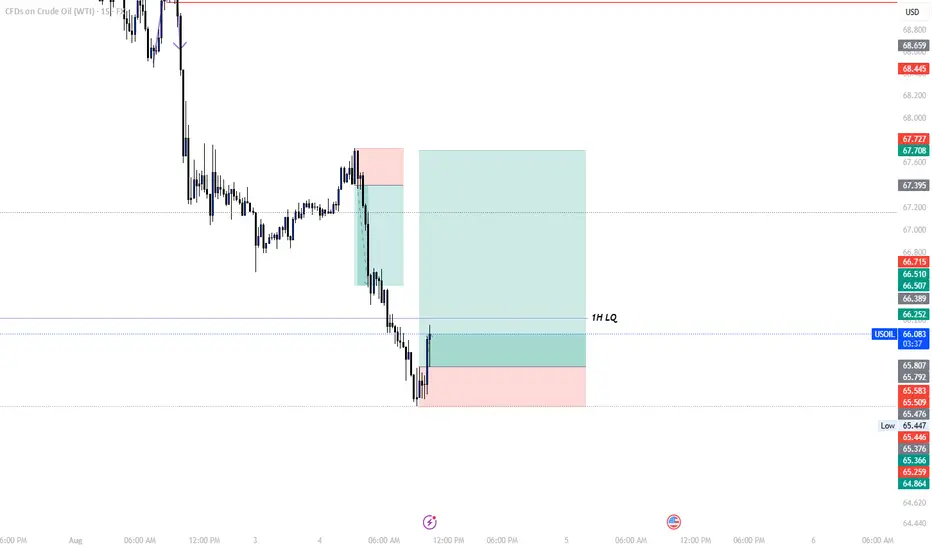
BUY USOILI'm sharing with you our 2nd trade for the day which is agail on USOIL, you can see that the price came to grab the 1H LQ, then we got us a reversal we just took.
Follow for more!
How long can the decline in US crude oil prices last?
💡Message Strategy
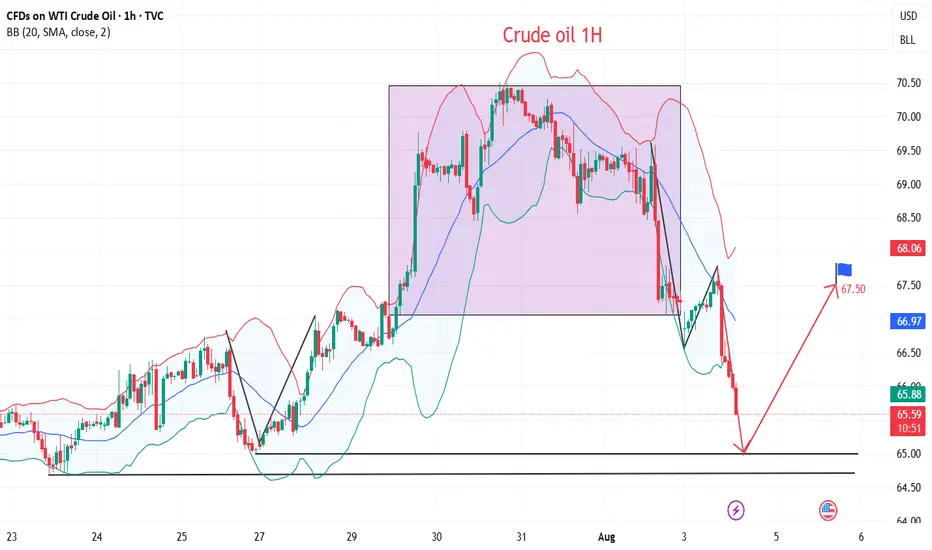
On Monday (August 4) during the Asia-Europe session, WTI fell for three consecutive days, with a drop of 1.16% today, trading around 66.55. OPEC+'s decision to increase production, coupled with geopolitical and economic policies, has jointly formed the expectation that oil prices will be "weak and volatile, dominated by downward pressure."
Short-Term: Increased Supply Drives Price Decline
OPEC+'s decision to increase production directly led to further declines in oil prices on Monday (Brent crude fell 0.28% to $69.23/barrel, and WTI fell 0.46% to $67.01/barrel), extending Friday's decline. Market expectations of oversupply reinforced bearish sentiment, particularly as the UAE's additional production increase (accounting for 2.4% of global demand) further amplified the signal of easing supply. However, India's announcement to continue purchasing Russian crude oil partially offset the impact, limiting the price decline and failing to shift the short-term downward trend.
Medium-Term: Supply-Demand and Policy Risks Intertwine
On the Supply Side: OPEC+'s production increase plan may be paused after September, as Goldman Sachs anticipates accelerated OECD inventory accumulation and fading seasonal demand support. However, if US shale oil production is forced to cut production at break-even points due to low oil prices, OPEC+ may adjust its strategy and even consider further releasing the remaining 1.66 million barrels/day of production capacity, which would continue to suppress oil prices.
Long-Term: Market Share Competition and Structural Overcapacity
OPEC+'s production increase strategy aims to reshape the global oil landscape by squeezing out high-cost producers, such as US shale oil, through low prices. Due to rising equipment costs driven by tariffs and low oil prices, US shale oil companies have cut capital expenditures, resulting in a decline in the number of active drilling rigs and a slowdown in production growth. This strategic game is likely to keep oil prices in a low range for a long time, with significant long-term downward pressure. Unity within OPEC+ and coordination between Saudi Arabia and the UAE will be key to policy implementation.
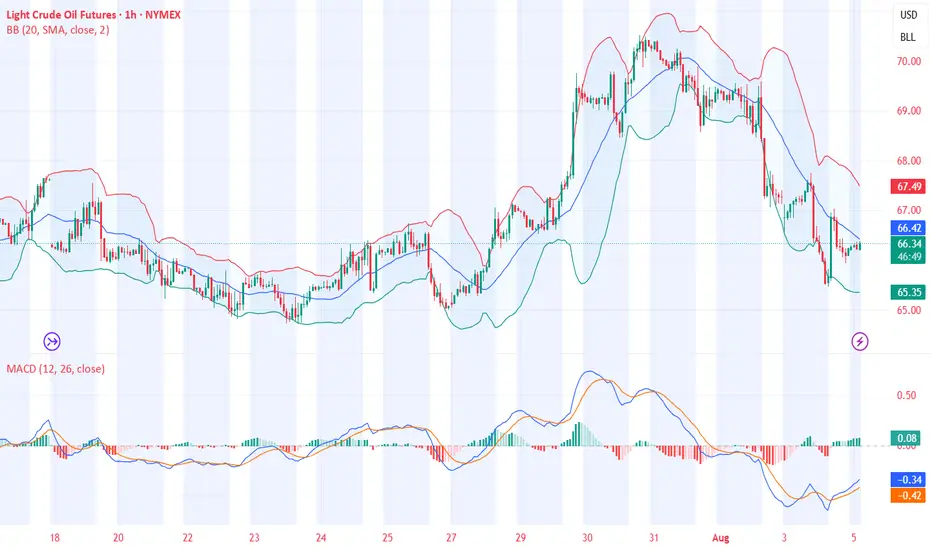
📊Technical aspects
Crude oil's short-term (1H) trend has reversed downward from its highs. The moving averages are diverging and aligning downward, indicating a downward trend in the short term.
The K-line chart has continued to close with small real bodies, and the MACD indicator is about to form a golden cross near the zero axis, signaling weakening downward momentum and a bullish bias on pullbacks. Crude oil is expected to remain weak and downward today, with a potential correction near $65.00.