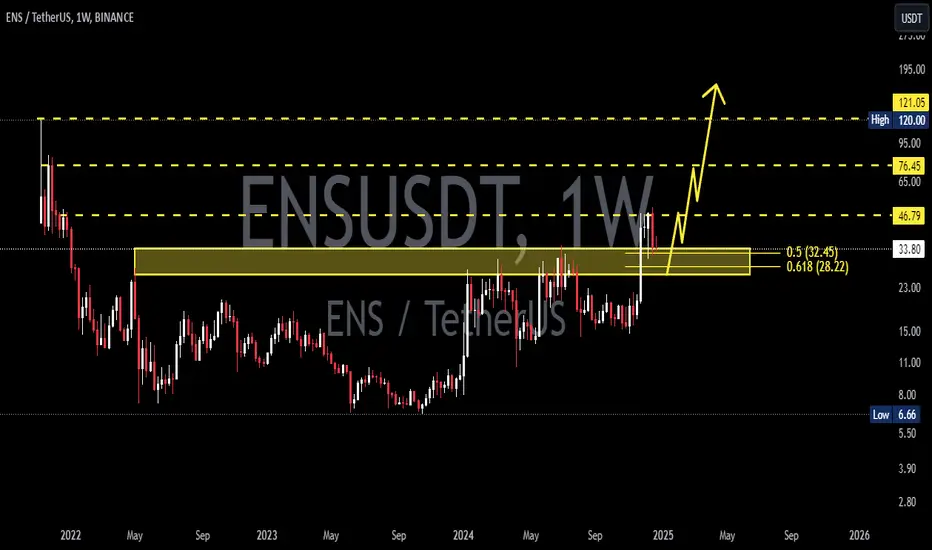
ENS/USDT Weekly Outlook – “Massive Breakout Brewing from Base
Ethereum Name Service (ENS) is currently positioned at a critical inflection point on the weekly chart, signaling a high-probability setup for a massive bullish breakout after nearly 2 years of sideways consolidation and structural base building.
🔍 Technical Pattern Breakdown
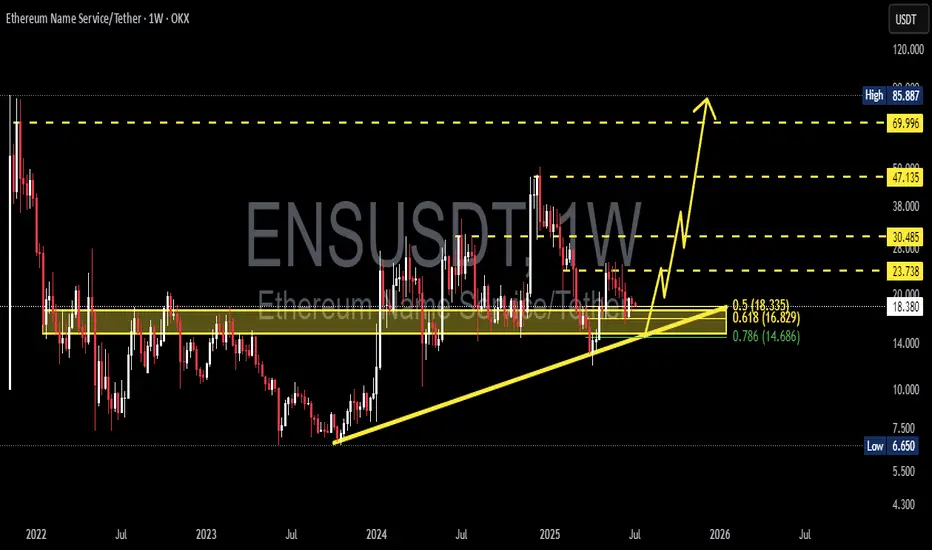
This chart reveals a macro Ascending Triangle formation developing since late 2022, with higher lows consistently respecting a rising trendline support and price now retesting the golden pocket Fib zone.
Pattern Formed:
📐 Macro Ascending Triangle + Fibonacci Confluence Zone
📉 Long-Term Accumulation Range: $14.6 – $23.7
Trendline Support:
✅ Rising since 2023, showing buyers consistently stepping in at higher levels
Fibonacci Retracement:
🔑 Price currently sitting between 0.5–0.786 Fib zone from the 2023 rally:
0.5 = $18.33
0.618 = $16.82
0.786 = $14.68
🟢 Bullish Scenario – Potential Multi-Leg Rally
If price holds and rebounds from this support region, we could see a stepped breakout with key resistance levels being taken out one by one:
1. First Resistance – $23.73: Psychological and structural breakout level
2. Second Target – $30.48: Prior major rejection area
3. Third Target – $47.13: 2024 resistance high
4. Macro Target – $69.99 to $85.88: Full breakout potential from triangle width and historical ATH zone
🚀 Upside Potential from Current Levels (~$18): Over 350%
📈 This would confirm the end of the accumulation cycle and signal the start of a long-term bullish phase.
🔴 Bearish Scenario – Breakdown Risk
In the event of a confirmed weekly candle closing below $14.6, we invalidate the ascending triangle and shift bias toward bearish retracement:
Next Support: $10.00
Extreme Bearish Target: $6.65 (macro low from 2022)
🛑 Breakdown from this structure would suggest failure of the accumulation pattern and return to long-term bearish pressure.
💡 Strategic Insight
ENS is one of the rare altcoins currently forming a clean high-timeframe bullish setup. This is the kind of structure institutional or swing traders look for when anticipating early entries before explosive moves.
With a tight invalidation below $14.6 and multiple upside targets, this setup provides a strong risk-reward opportunity.
#ENS #ENSUSDT #AltcoinBreakout #CryptoSetup #Accumulation #TechnicalAnalysis #CryptoTrading #SwingTrade #Fibonacci #AscendingTriangle
Ensusd
Ethereum Name Servise ENS price analysisFor the second day in a row, trading volumes on the CRYPTOCAP:ETH futures market have exceeded those of CRYPTOCAP:BTC
(Is the market alpha returning or are profits being locked in? Write your thoughts in the comments ?)
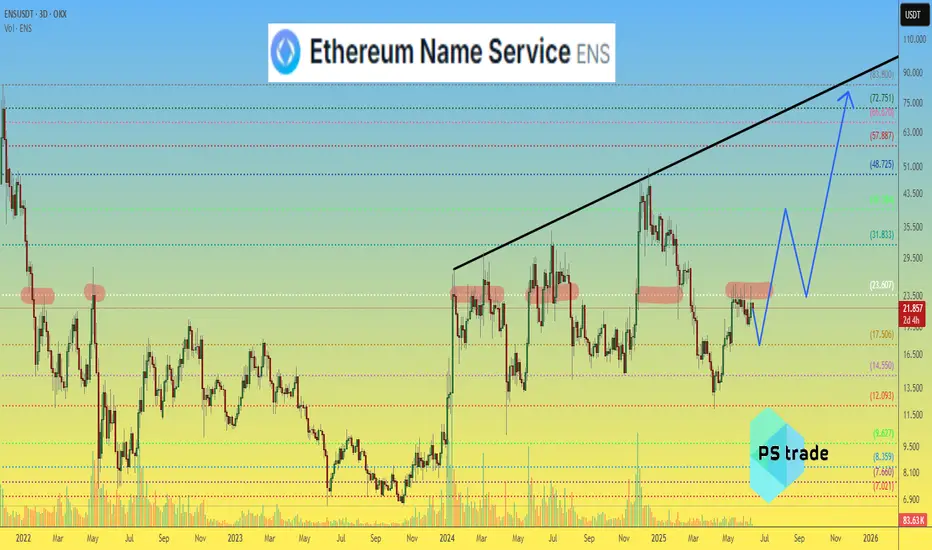
💡 And we will write an analysis of the possible movement of the NYSE:ENS price — this is the #Ethereum Name Service management token, which is used to manage the protocol and influence pricing decisions for its .eth addresses and price oracle.
👌 Currently, all forces are preventing the OKX:ENSUSDT price from consolidating above $23.6. But when that happens, it will be a very safe level to buy on a retest.
📊 More risky, but with greater earning potential, are purchases at $17.50 and $14.50.
Set your “buckets” for purchases and wait for them to “fill up.”
And then, who knows, maybe in 2025, the price of NYSE:ENS will reach its ATH.
_____________________
Did you like our analysis? Leave a comment, like, and follow to get more
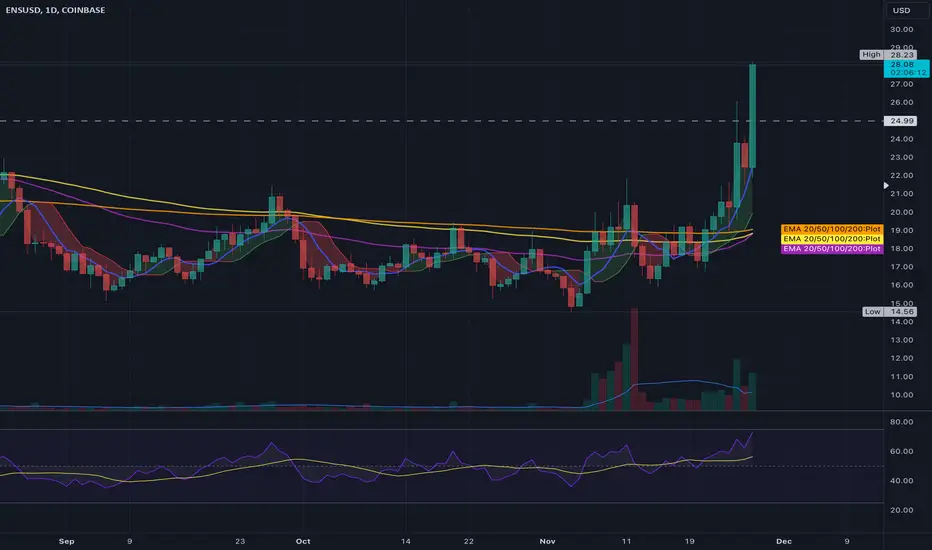
The key is whether the price can hold above 25.06
Hello, traders.
If you "Follow", you can always get the latest information quickly.
Have a nice day today.
-------------------------------------
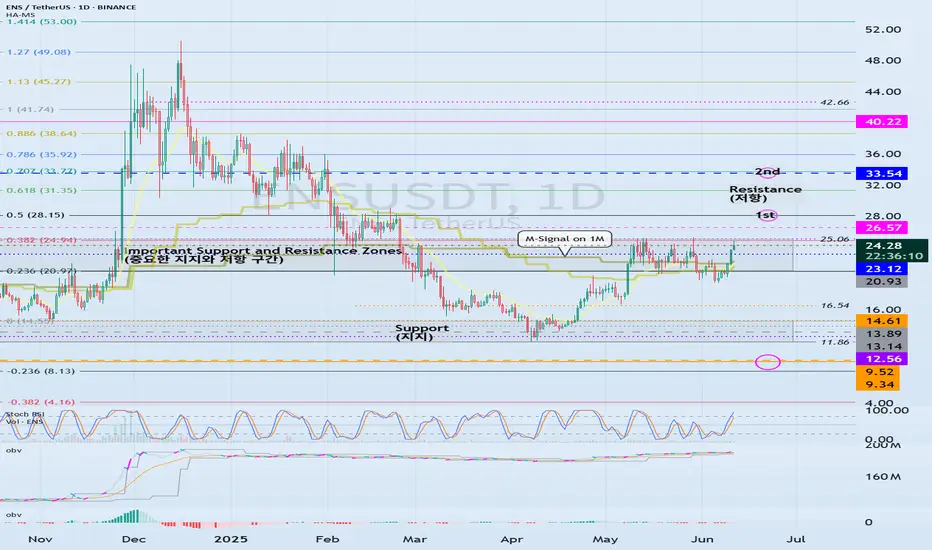
(ENSUSDT 1D chart)
The key is whether the price can be maintained by rising above the important support and resistance zone of 20.93-25.06.
If it fails to rise, it is likely to fall to the support zone of 11.86-14.61, so you should think about a response plan for this.
However, the 20.93 point is a volume profile zone, so you should check whether it is supported when falling to this area.
If it starts to rise,
1st: 28.15
2nd: 33.54
The 1st and 2nd areas above are likely to act as resistance.
-
The indicators used as basic trading strategies are the HA-Low indicator and the HA-High indicator.
The basic trading strategy is to buy near the HA-Low indicator and sell near the HA-High indicator.
However, if it is supported by the HA-High indicator and rises, it is likely to show a stepwise upward trend, and if it is resisted by the HA-Low indicator and falls, it is likely to show a stepwise downward trend.
Therefore, the trading method should be a split trading method.
The end of the stepwise upward trend is a decline, and the end of the stepwise downward trend is an increase.
Therefore, if you buy when the HA-High indicator is supported and rises, a short and quick response is required.
Accordingly, it is not recommended to use the HA-High indicator as the first purchase point.
If you are familiar with day trading, the HA-High indicator may also be a purchase point.
Currently, the HA-Low indicator is formed at the 14.61 point, and the HA-High indicator is formed at the 23.12 point.
-
Depending on the arrangement of the candles, the important support and resistance zones are in the 20.93-25.06 zone.
Therefore, regardless of the current HA-High indicator position, if it shows support above 25.06, it is a time to buy.
However, since the buy zone and resistance zone are close, a quick response is required.
Therefore, the support and resistance points drawn on the 1M, 1W, and 1D charts correspond to important trading strategy points.
In order to draw reliable support and resistance points, objective information is required.
Be careful because the support and resistance points drawn after starting a transaction may reflect your psychological state and become unreliable support and resistance points.
-
Thank you for reading to the end.
I wish you successful trading.
--------------------------------------------------
- This is an explanation of the big picture.
(3-year bull market, 1-year bear market pattern)
I will explain more details when the bear market starts.
------------------------------------------------------
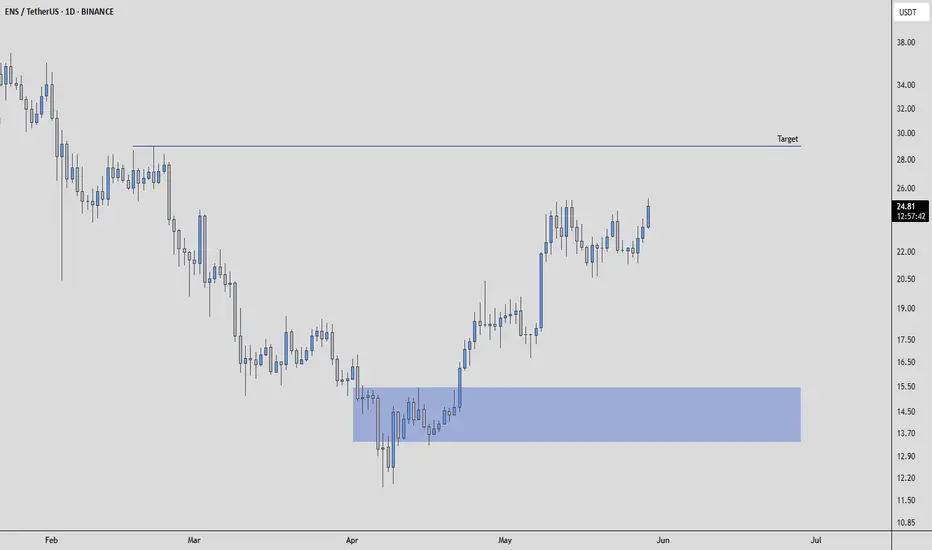
ENSUSDT - GAMEPLANAlright everyone, focusing on ENSUSDT. The current price action suggests that the immediate target for this move is the blue line I've marked on the chart. This line represents a key level that the market is currently aiming for.
Beyond that, looking lower, you'll see a blue box that I consider to be a beautiful support zone. This area is where I anticipate strong buying interest could emerge, potentially halting any further downside.
As always, my approach is rooted in confirmation. If price reaches the blue line, I'll be scrutinizing the volume footprint to understand the true intentions of market participants. Are we seeing signs of distribution, or is there genuine momentum to push through? I'll also be watching for any CDV (Cumulative Delta Volume) divergences that might signal a shift in the underlying order flow.
Should price retreat towards that lower blue box, I'll be looking for low timeframe (LTF) confirmations to validate its strength as support. A clean retest and bounce from this zone, especially with an uptick in buying volume, would be a strong signal.
Remember, I exclusively focus on assets that show a sudden and significant increase in volume. This selective approach helps me concentrate on where the market is truly showing its hand. ENSUSDT's current movements, coupled with its potential to interact with these key levels, make it an interesting watch.
Keep these levels on your radar. The market is always speaking, and by paying attention to these nuances, we can decipher its true intentions. You can trust my perspective to guide you through these intricate market dynamics.
📌I keep my charts clean and simple because I believe clarity leads to better decisions.
📌My approach is built on years of experience and a solid track record. I don’t claim to know it all but I’m confident in my ability to spot high-probability setups.
📌If you would like to learn how to use the heatmap, cumulative volume delta and volume footprint techniques that I use below to determine very accurate demand regions, you can send me a private message. I help anyone who wants it completely free of charge.
🔑I have a long list of my proven technique below:
🎯 ZENUSDT.P: Patience & Profitability | %230 Reaction from the Sniper Entry
🐶 DOGEUSDT.P: Next Move
🎨 RENDERUSDT.P: Opportunity of the Month
💎 ETHUSDT.P: Where to Retrace
🟢 BNBUSDT.P: Potential Surge
📊 BTC Dominance: Reaction Zone
🌊 WAVESUSDT.P: Demand Zone Potential
🟣 UNIUSDT.P: Long-Term Trade
🔵 XRPUSDT.P: Entry Zones
🔗 LINKUSDT.P: Follow The River
📈 BTCUSDT.P: Two Key Demand Zones
🟩 POLUSDT: Bullish Momentum
🌟 PENDLEUSDT.P: Where Opportunity Meets Precision
🔥 BTCUSDT.P: Liquidation of Highly Leveraged Longs
🌊 SOLUSDT.P: SOL's Dip - Your Opportunity
🐸 1000PEPEUSDT.P: Prime Bounce Zone Unlocked
🚀 ETHUSDT.P: Set to Explode - Don't Miss This Game Changer
🤖 IQUSDT: Smart Plan
⚡️ PONDUSDT: A Trade Not Taken Is Better Than a Losing One
💼 STMXUSDT: 2 Buying Areas
🐢 TURBOUSDT: Buy Zones and Buyer Presence
🌍 ICPUSDT.P: Massive Upside Potential | Check the Trade Update For Seeing Results
🟠 IDEXUSDT: Spot Buy Area | %26 Profit if You Trade with MSB
📌 USUALUSDT: Buyers Are Active + %70 Profit in Total
🌟 FORTHUSDT: Sniper Entry +%26 Reaction
🐳 QKCUSDT: Sniper Entry +%57 Reaction
📊 BTC.D: Retest of Key Area Highly Likely
📊 XNOUSDT %80 Reaction with a Simple Blue Box!
📊 BELUSDT Amazing %120 Reaction!
📊 Simple Red Box, Extraordinary Results
📊 TIAUSDT | Still No Buyers—Maintaining a Bearish Outlook
📊 OGNUSDT | One of Today’s Highest Volume Gainers – +32.44%
I stopped adding to the list because it's kinda tiring to add 5-10 charts in every move but you can check my profile and see that it goes on..
#ENS/USDT#ENS
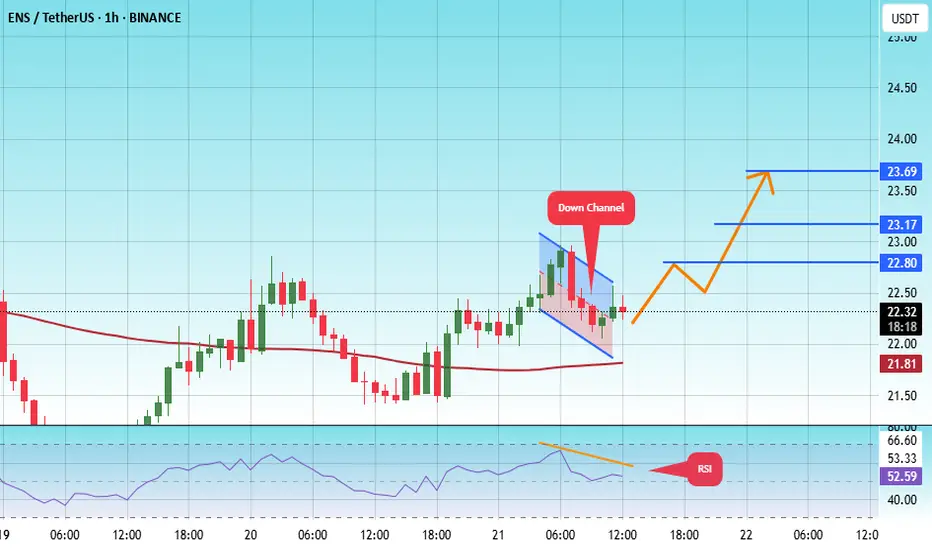
The price is moving within a descending channel on the 1-hour frame, adhering well to it, and is heading for a strong breakout and retest.
We are experiencing a rebound from the lower boundary of the descending channel, which is support at 22.00.
We are experiencing a downtrend on the RSI indicator, which is about to break and retest, supporting the upward trend.
We are looking for stability above the 100 Moving Average.
Entry price: 22.37
First target: 22.80
Second target: 23.17
Third target: 23.69
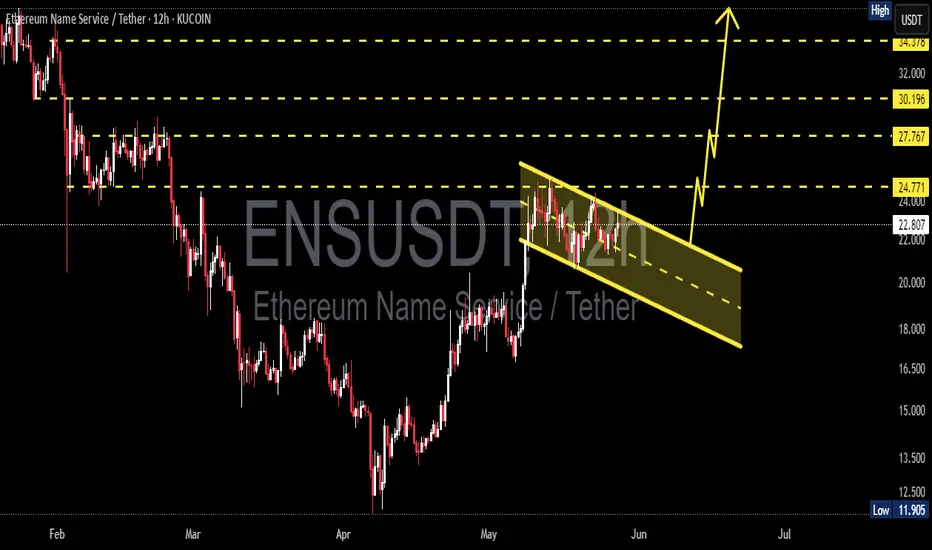
ENSUSDT 12H AnalysisENS ~ 12H Analysis
#ENS Buy gradually after successfully breaking through this resistance line with a short-term target of at least 15%++ And long term target $50++
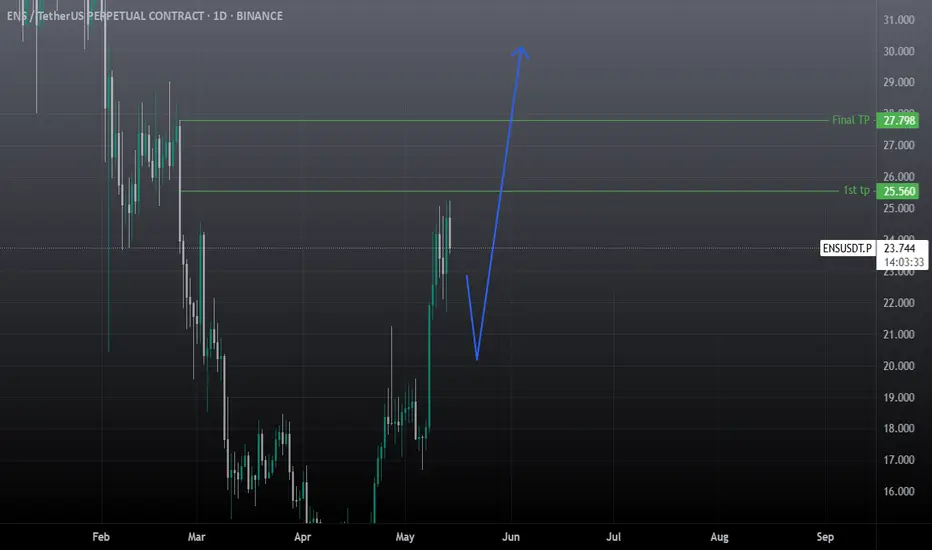
ENS SWING Trade SetupENS Showing strong momentum towards upside and dropped without touching POI, So it can go higher first then it may take correction, spot and future trader can take risk on this. Wait for the entries and enter from 20-19 level, if price reverse from any other point, then wait for the 4hrs candle closing above 26 and target the 30-32$ level. for scalp and day trading get long from 22.40 SL 21.65 and set tp 25.56 & 27.79$.
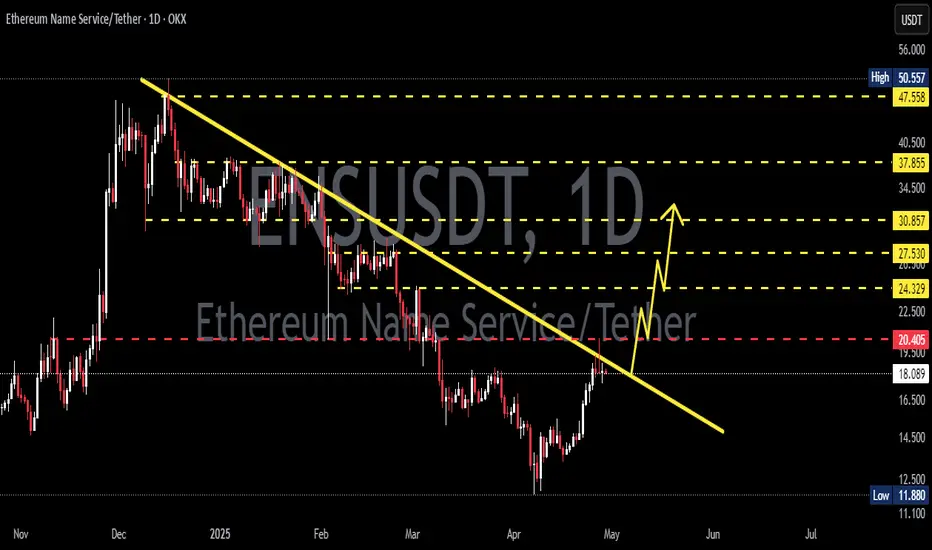
ENSUSDT 1D AnalysisENS ~ 1D Analysis
#ENS Buy after successfully penetrating this resistant line with a short -term target of at least 10%+ from here.
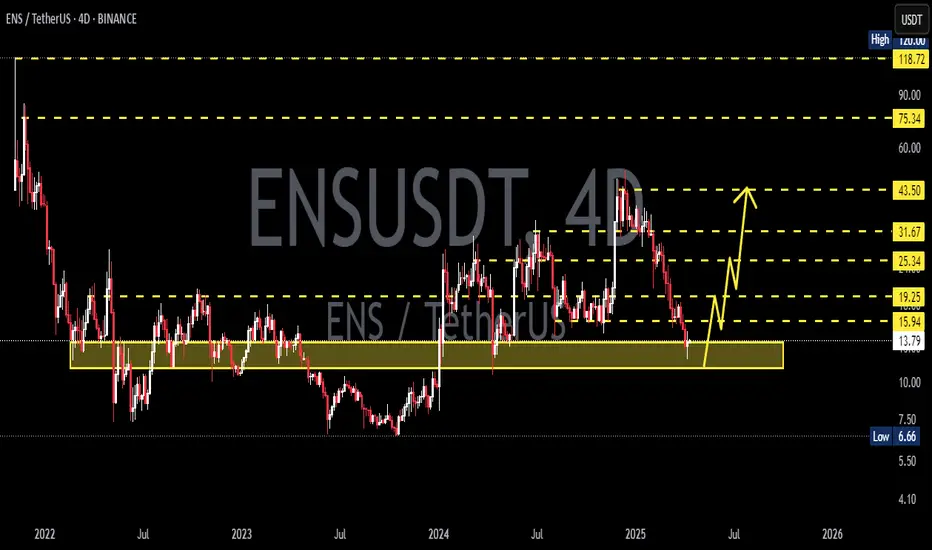
ENSUSDT 4DENS ~ 4D Analysis
#ENS Buy gradually from here if you still have a Conviction on this coin with a short -term target of at least 15%+.
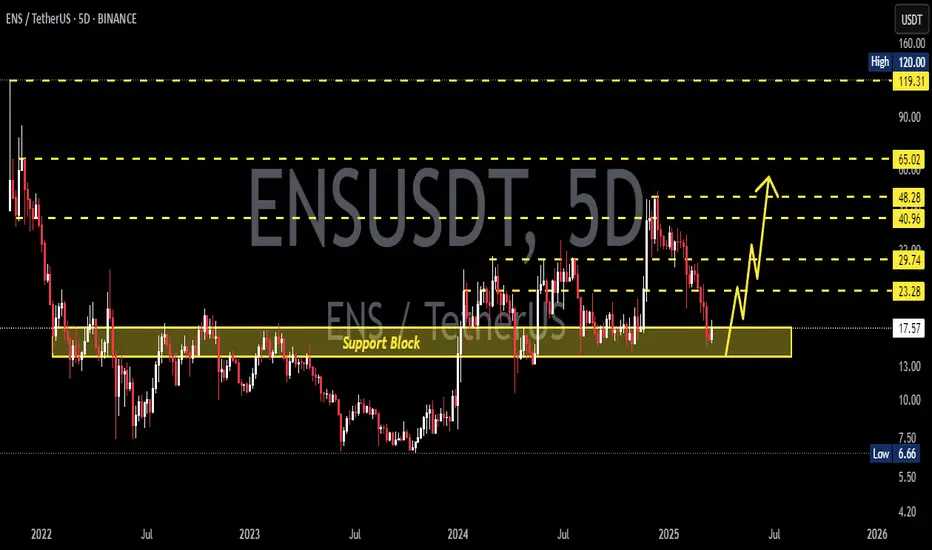
ENSUSDT 5DENS ~ 5D Analysis
#ENS If you still have a Conviction on this coin, maybe this support you can consider to start buying back from here with a short -term target of at least 15%+.
$ENS is refueling before its flight into spaceThis is a very cool project for Ethereum that will show strong growth. Continuous accumulation and preparation for the flight to 0.618 level soon!
Horban Brothers.

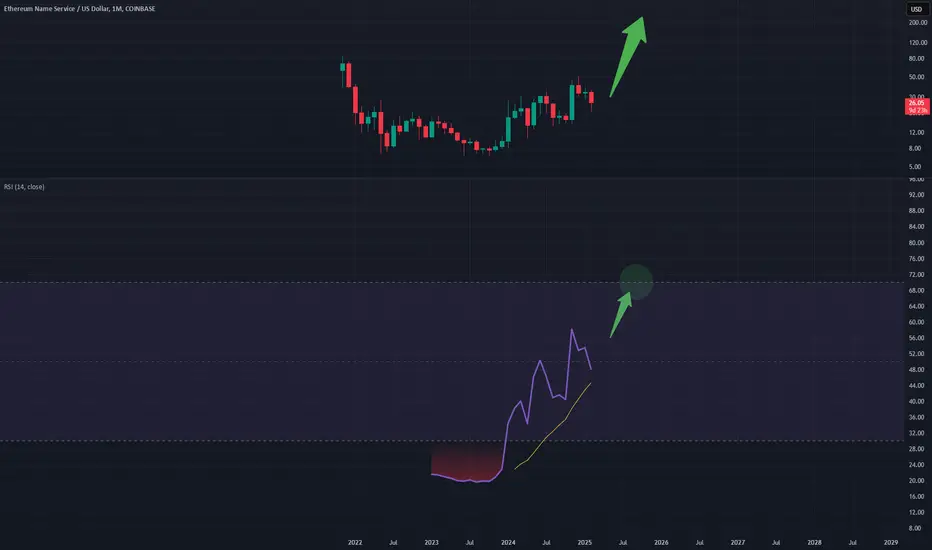
ENSUSD - Monthly RSI TargetTargeting the overbought area on the Monthly timeframe for ENSUSD before selling
Very bullish on ENS as an altcoin at this time
Lets see how it progresses
Indicator Analysis and Target
Monthly
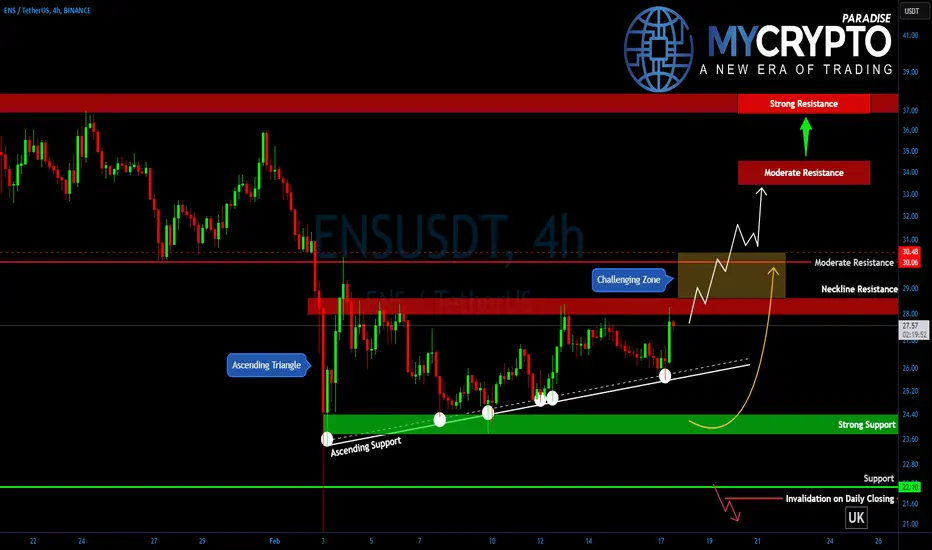
ENS Bulls Eyeing a Breakout—Can They Push Through?Yello, Paradisers! Is #ENS finally shaking off the selling pressure and preparing for a breakout? The price action suggests something big could be brewing!
💎#ENSUSDT is currently forming an ascending triangle pattern after a major correction—this is a sign that sellers are losing their grip, and momentum might soon shift in favor of the bulls. But the real battle is just ahead…
💎The critical breakout level stands at $28.80, with the pattern neckline resistance between $28.20 to $28.80 levels. A strong move above this zone would open the doors for a rally towards the moderate resistance at $30.05–$30.45. However, this region is no joke—it’s a challenging zone where bulls will need to prove their strength.
💎If buyers successfully break and hold above the challenging zone, ENS could confirm the bullish structure and push towards $33.50–$34.20 as the first key target. Expect some profit-taking around this level, but if momentum remains intact, the final pattern target of $37–$38 could be in play—right in line with historically strong resistance zones.
💎On the downside, ENS has reliable support at $26.60, with ascending support between $26.00 and $25.80. These levels should absorb selling pressure in case of a pullback. Below that, a strong base support at $24.40–$24.00 is developing—which is turning the tides in favor of bulls.
Paradisers, as always, patience and precision are key in this market. This isn’t a time for reckless trades—let the levels guide you, trade strategically, and stay disciplined.
MyCryptoParadise
iFeel the success🌴
Ethereum Name Service #ENS leverage on ETH (if we are lucky ofc)
The network is pretty much unusable right now for regular people.
A Rich man's chain.
Either way the ENS chart presents a potential inverse head and shoulders
that has a large log target reaching back to previous high's makes sense to me.

ENSUSDT 1WENS ~ 1W
#ENS So far it continues to maintain its bullish structure. This is wave 2 in the Eliot Wave pattern. Buy gradually within this support block.with a minimum target of 20+
ENSUSD - Further BreakoutENS has broken out quite a bit but I suggest that this will continue
The MACD indicator shows this breakout as the bearish phase turns to the bullish
I want 50 - 100$ in my stance

was that it for ENS? seems like itIt hit a major resistance and the second weekly seems to have rejected from the resistance instead of going higher. Seems ENS is not just ready yet. Back towards the yellow support line. Will reassess where to later.
This is not a high confidence expected move. The weekly candle could also be considered as consolidation below resistance and go higher. Just seems a bit less likely

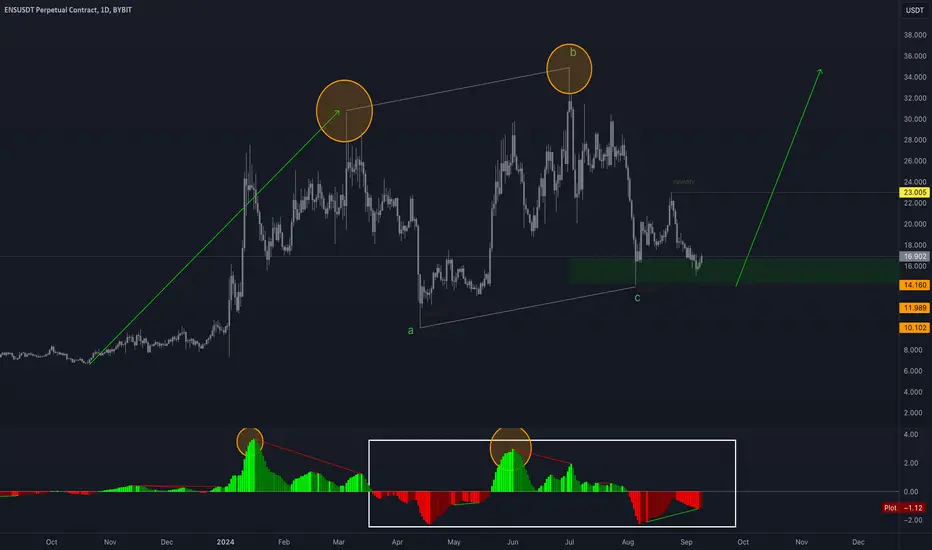
ENS showing a stunning Regular-Flat🚀 #ENS @ensdomainsis showing a stunning Regular-Flat (a,b,c) structure 😍
There’s a slight bullish divergence on the MACD between the two tops (🟠).
But on the MACD (⬜️) we can see that the correction is done.
Looking for to reach at least $23, then aiming for the top! 💸
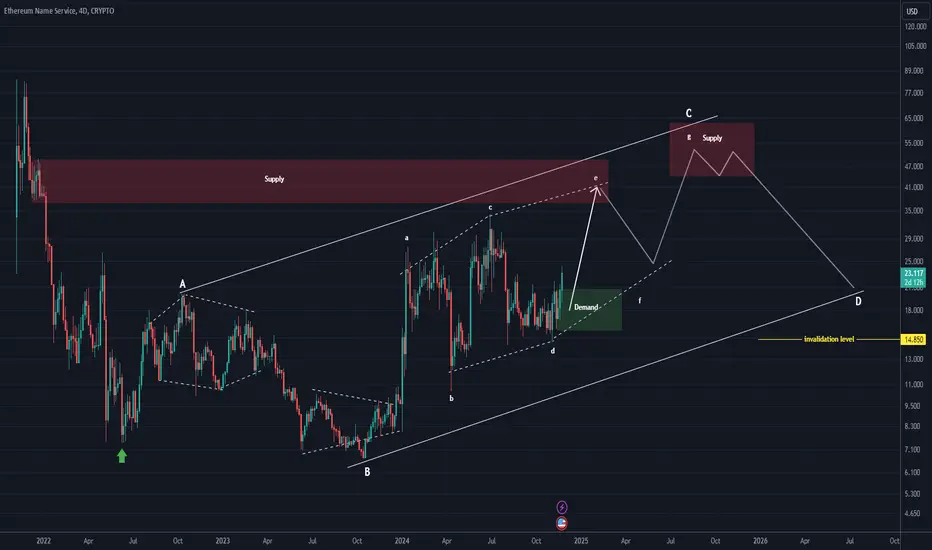
ENS ROADMAP (4D)It seems that ENS is in a complex structure. This structure is a diametric, and it is currently in wave C of this diametric.
Wave C appears to be a diamond-shaped diametric, and we are now in wave e of C.
Resistance levels have been marked on the chart.
A daily candle closing below the invalidation level will invalidate our bullish outlook.
After completing wave D of the larger diametric and the end of wave D's drops, it will experience significant growth.
For risk management, please don't forget stop loss and capital management
Comment if you have any questions
Thank You
Ethereum Name Service ENS price needs to take a break from growtThe price of CRYPTOCAP:ETH has finally started to rise 👇
follow they're accelerating growth of the #ENS price (which has the word #Ethereum in its name)
#ENS is an Ethereum Name Service control token used to control the protocol and influence the pricing decisions of its .eth address and price oracle.
In our opinion, now it is not so much important for #ENSUSDT buyers to continue their rapid growth as it is to finally hold the price above $23.60 , which they have not been able to do by all 2024.
Only then will it be possible to continue the steady wave of growth to $80+.
_____________________
Did you like our analysis? Leave a comment, like, and follow to get more

ENSUSD approaching the top of 1-year Channel Up. Make or break?Ethereum Name Service (ENDUSD) has been trading within a Channel Up since January 2024 and the recent post U.S. elections surge is about to hit its top (Higher Highs trend-line). This is a standard break-or-rejection strategy: As long as the 1D candles close within the Channel Up, we are expecting the 1D MA200 (orange trend-line) and 0.5 Fibonacci retracement level to get tested (23.850). In the event of a 1D candle closing above the pattern, we will have a bullish break-out targeting the All Time High at 84.860.
-------------------------------------------------------------------------------
** Please LIKE 👍, FOLLOW ✅, SHARE 🙌 and COMMENT ✍ if you enjoy this idea! Also share your ideas and charts in the comments section below! This is best way to keep it relevant, support us, keep the content here free and allow the idea to reach as many people as possible. **
-------------------------------------------------------------------------------
💸💸💸💸💸💸
👇 👇 👇 👇 👇 👇

ENS is gonna rip!ENS is about to take off. the 50 and 100 EMA are crossing up over the 200 and CRYPTOCAP:ETH has solid momentum. I jumped in yesterday and so far, so good.
Will #ENSUSDT Explode or Collapse Soon? Key Levels to WatchYello, Paradisers! Are you prepared for what could be a massive move on #ENSUSDT? Let's discuss the latest analysis of #EthereumNameService:
💎Currently, #ENS is gaining momentum at the ascending support line, hinting at a bullish push. If the momentum holds, we might see a strong breakout above the triangle, setting the stage for a significant rally. But here's the kicker: we’re not quite there yet.
💎To confirm a genuine bullish move, we need a clear break above the triangle and the internal supply zone at $22.99. This breakout must be accompanied by solid buying pressure—think strong engulfing candles and consistent momentum. Without these signs, jumping in early could be costly. Patience is the name of the game here.
💎But what if the bullish momentum fades? If #EthereumNameService struggles to breach the triangle and the $22.99 level, it might signal waning buyer strength, inviting sellers to take control. The critical area to watch is the lower demand zone at $13.22.
💎This historically strong support level could be our last line of defense for bulls. If the price bounces from $13.22, the bullish outlook could stay intact. But—brace yourself—a break below $13.22 would invalidate the bullish setup and could trigger a sharp decline.
Stay patient and only act on the best and high probability setups.
MyCryptoParadise
iFeel the success🌴
