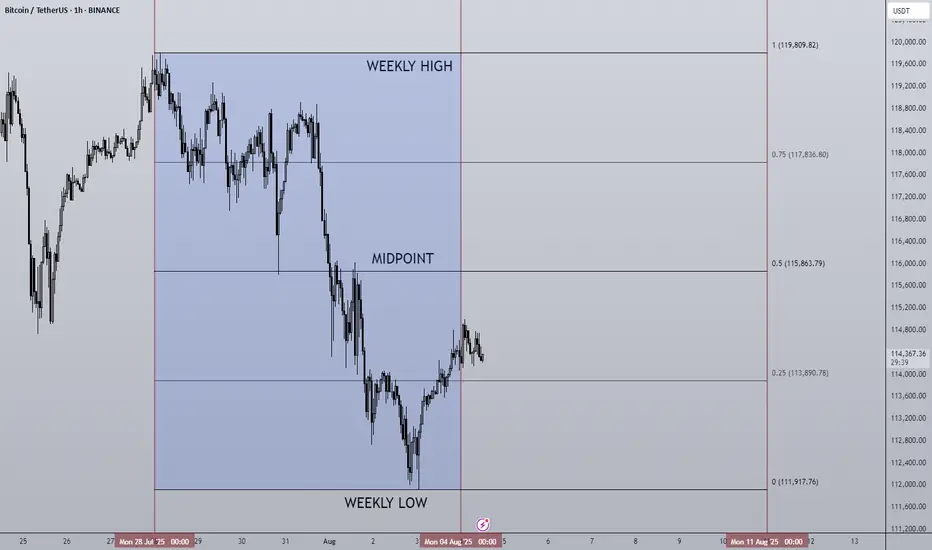
04/08/25 Weekly OutlookLast weeks high: $119,809.82
Last weeks low: $111,917.76
Midpoint: $115,863.79
First net outflow for BTC in seven weeks (-$643m) following the FOMC data release and also month end. Yet again no change by the FED but the chances of Septembers FOMC giving us a rate cut has drastically increased, currently at a 78.5% chance of a 25Bps cut.
Month end usually gives us a pullback/sell-off as larger institutions window dress which often includes de-risking somewhat. We saw this last Thursday combined with the weekends typical lower volume has resulted in quite a significant correction for BTC. Altcoins have down the same as many assets reject from HTF resistance areas, the correction has been on the cards and isn't too worrying on the face of it.
What I would say is August seasonality is generally not a bullish month and so expecting price to rebound and extend the rally would go against historical trends. I could see more of a ranging environment taking place for several weeks before any next leg up is possible.
This week I would like to see where altcoins find support and establish a trading range where some rotational setups tend to present themselves.
EOM
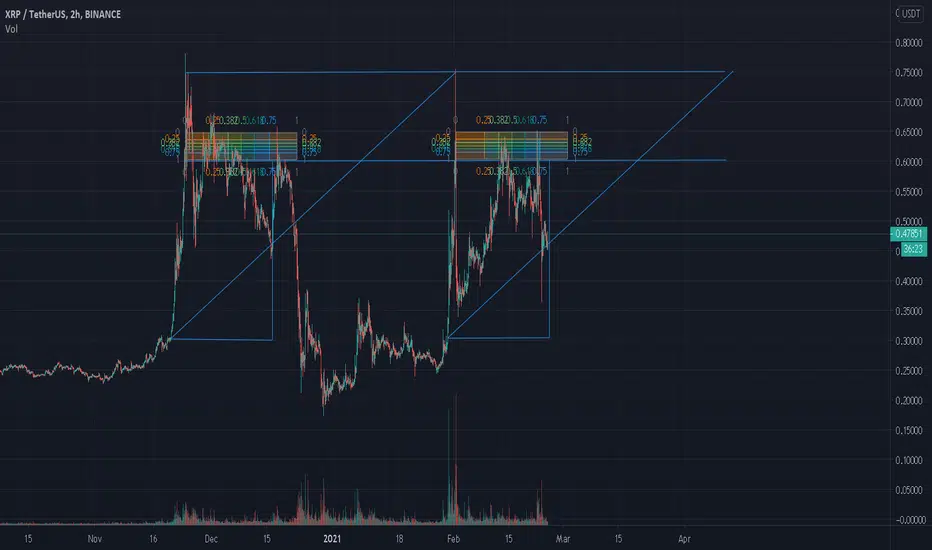
Updated version to my previous analysis. Updated version to my previous first ever analysis with more precise drawings/lines.
By looking at the pattern, we should see an upward trend. This would be around 9-10 hours from the time of publish.
If an upward trend is created, it should be met at 60-65 cents resistance.
If price doesnt break this resistance, we could possibly be seeing another dip. Even more so than the dip that took place on the 23rd of Febuary 2021.
This should create a very good buy opportunity to accumulate the coin at low prices of 35cents, to as low as 20 cents.
Goodluck traders.
End of Febuary month analysis.
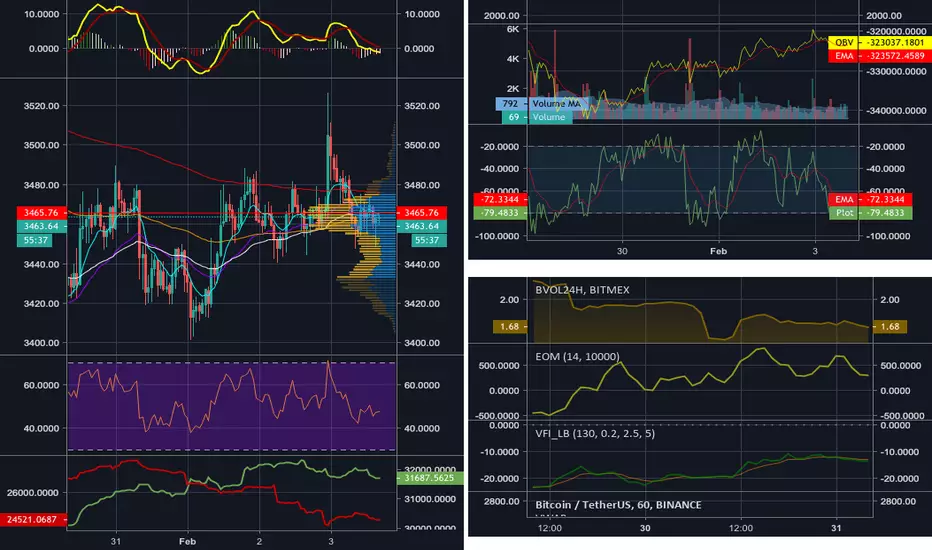
Btc Volume flow chartThis chart layout is another tool i have made and use to scan the market and monitor the volume
All indicators on this chart are Btc/usdt Binance
except for the Shorts vs Longs window which is Btc/usd long vs shorts on Bitfinex
From the top on the left:
Macd (Moving average Convergence Divergence
Btc/usdt binance chart including the 9ema, 30ema,50ema,100ema,200ema and the Vpvr (Volume profile Visible range)
Btc Relative strength index
Btc/usd longs vs shorts
From the top on the right:
13eObv (13ema of On Balance Volume) including Btc volume
Willy indicator
Bvol24h (24h btc volume)
Eom (ease of movement)
Vfi (volume flow indcator)
hope this layout can help
back to the woods i go...
The woodsman
Upward MovementResistance at $2.16 -- Building a base with difficult upward movement. Jump up in 2 - 5 market days.
