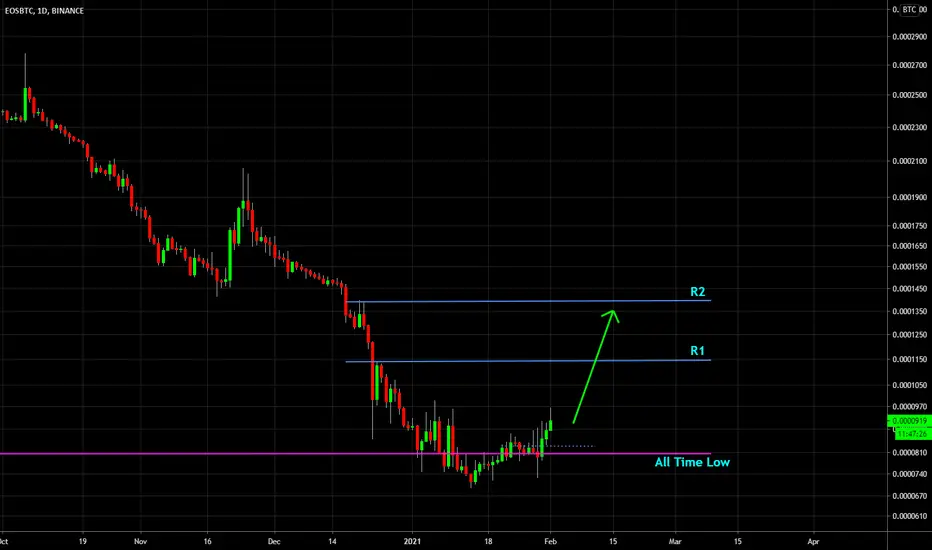
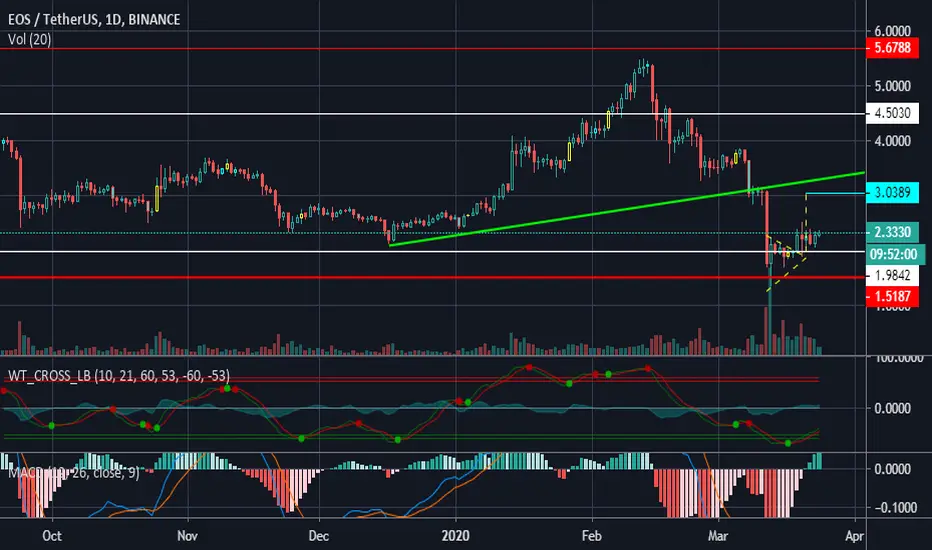
🔥 EOS/BTC Reversing From All Time LowTwo weeks ago, EOS/BTC made a new all time low. Since then, EOS/BTC has been steadily climbing day by day.
Few important things about this pair:
- EOS is currently one of the big alts who is lagging behind the rest, giving it more upside compared to alts which have already seen strong gains lately.
- The daily candles are still relatively small. Usually the green candles are starting off as small and getting bigger later. We might catch a strong move upwards soon.
On the chart, I’ve marked two potential areas of resistance, R1 and R2. These areas are based on recent swing highs and round numbers. Do your own due diligence.
Happy trading!
Eos-usdt
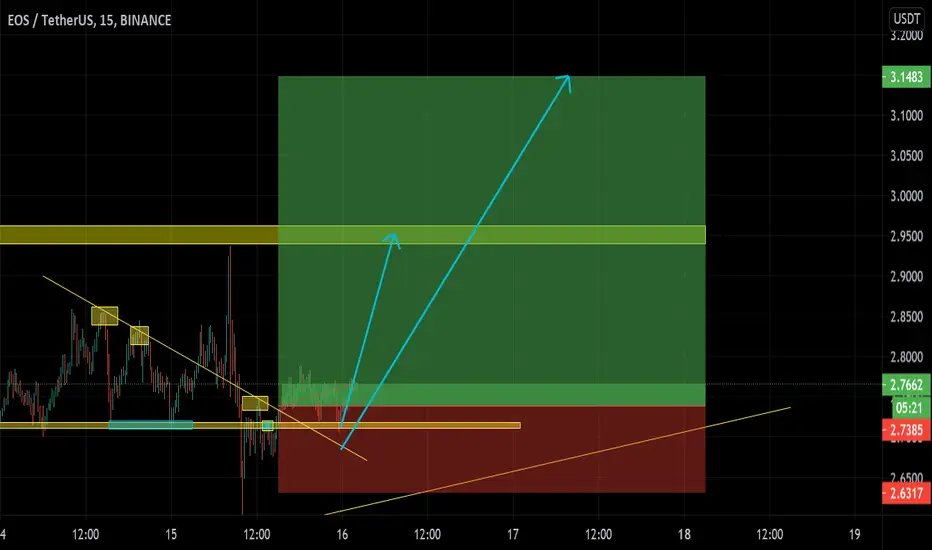
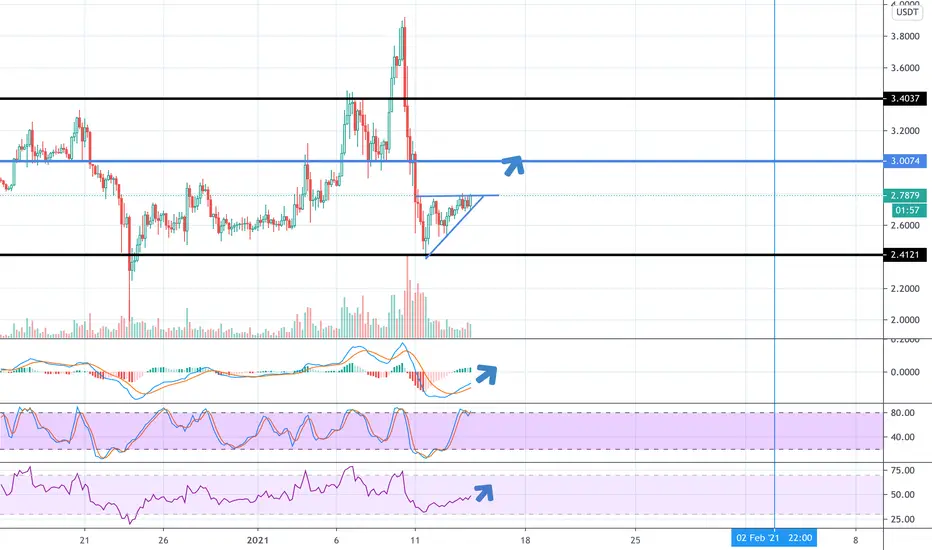
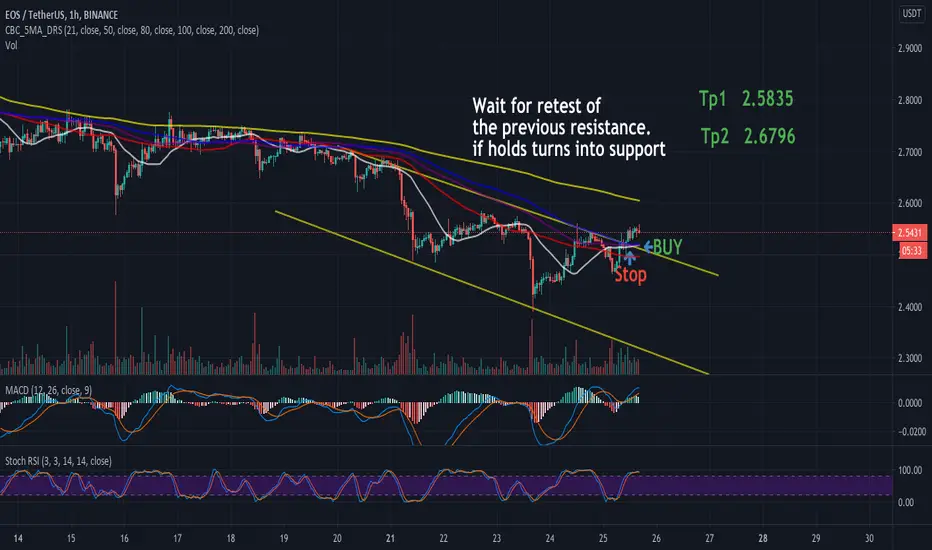
EOS POSSIBLE LONG FROM SUPPORTEOS USDT Possible Long If we get bullish price action above the trendline to the next support range
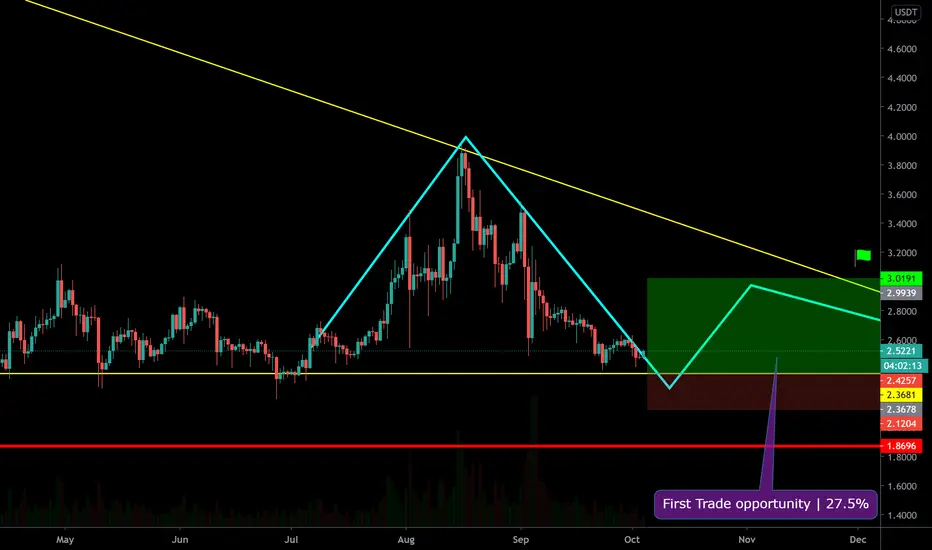
EOSUSDT| Time to go Long?? | 27% profitAs we said before in our last Idea on BINANCE:EOSUSDT , the price will move upward now because it has hit the support line.
EOS/USDT longeos usdt broke out. remember its the wekend
it can go either way. make sure to keep stops in place.remember
everything is ideas and possibilities. trade on family
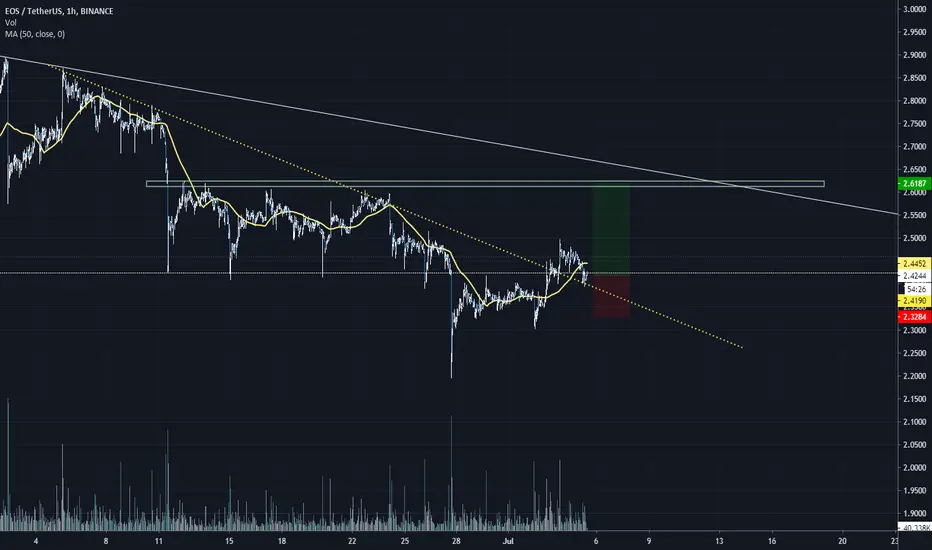
EOS/USDT - LONG - POTENTIAL 10%Look after your portfolio and it will look after you & If you liked this idea, please like and subscribe to my profile
PAIR: EOS/USDT
T/F: 1 HOUR
LENGTH: MEDIUM
RISK - LOW
ENTRY: 2.5970
TP1: 2.7044
TP2: 2.7920
TP3: 2.8731
SL: 2.5204
NOTES:
- SUPPORT/RESISTANCE FLIP
- UPTREND
- SUPPORT BREAKUP
- STRONG CANDLE REJECTION ON SUPPORT
- OVERSOLD ON RSI DEVIANCE
KEY:
LENGTH:
SHORT = 1-2 DAYS
MEDIUM = LESS THAN 1 WEEK
LONG = > LESS THAN 1 MONTH
INVEST = MORE THAN 1 MONTH
RISK:
LOW = EG. STRONG SUPPORT // MULTIPLE BOUNCES // STRONG UPTREND // OVERSOLD // BREAKOUT > PULLBACK > SUPPORT // REJECTION CANDLES
MEDIUM = EG. BROKEN SUPPORT // TREND REVERSAL // CONSOLIDATION
HIGH = EG. NOT FULLY BROKEN SUPPORT // OVERBOUGHT // OVERLY MATURE UPTREND
***Please note that all of my suggested Entries, TP's and SL's always ignore any precursor 0's***
Please always trade with caution, manage your trades and stop-losses This is not professional financial advice, just my thoughts and trades I am taking please trade safely and responsibly.

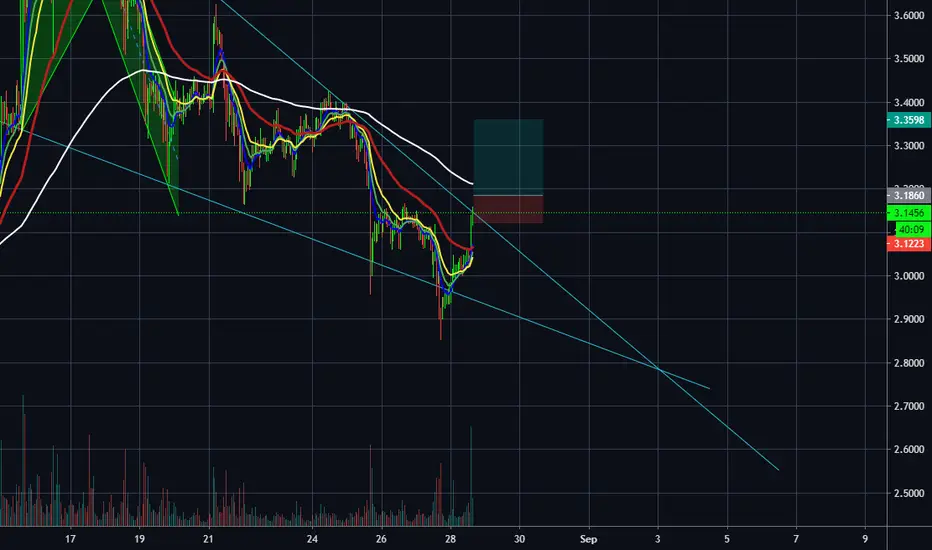
EOSUSDT 1H posible LongPodría realizarse un rebote en la linea de tendencia que fue rota e ir a la zona marcada
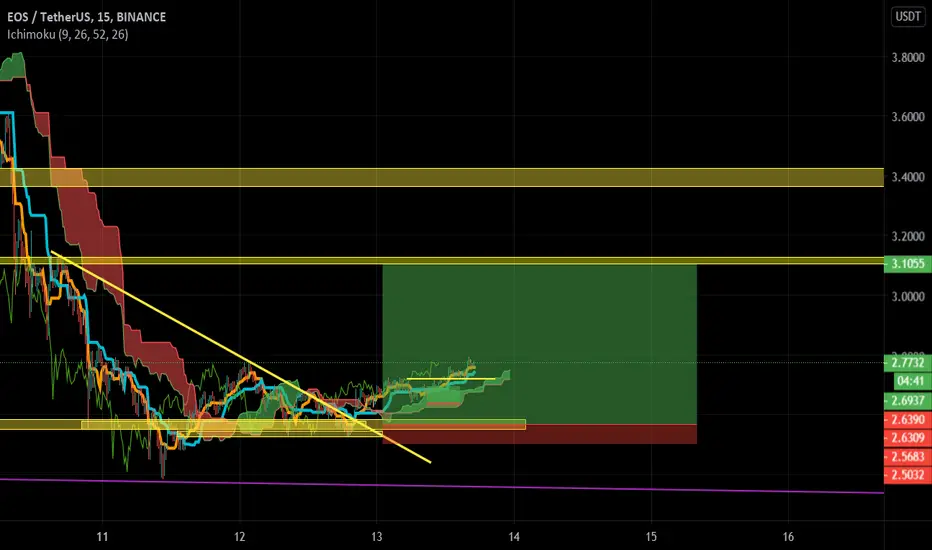
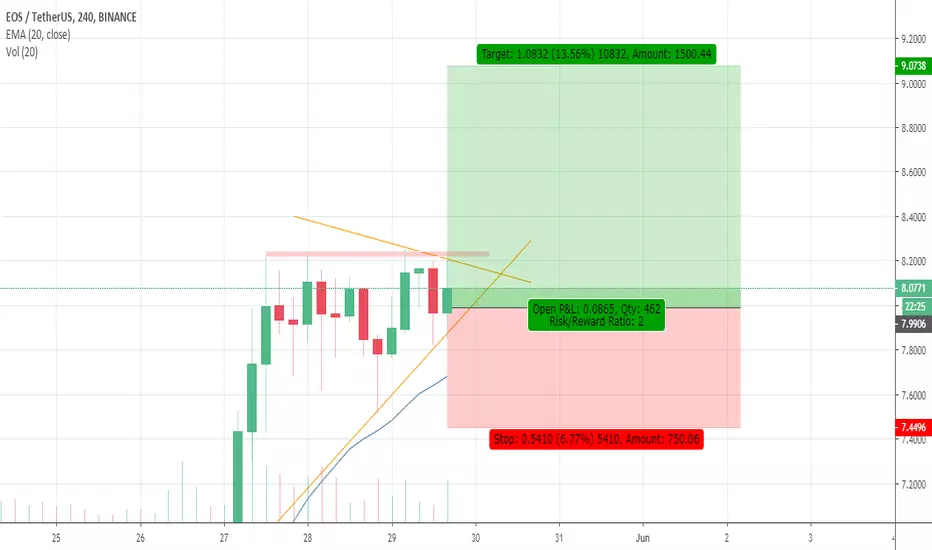
EOS/USDT EOS/USDT broke the triangle and jumped up, giving me a target as shown in the graph. Stop Loss is also on the chart.
Profit potential of 30% for the next few days.
Good luck
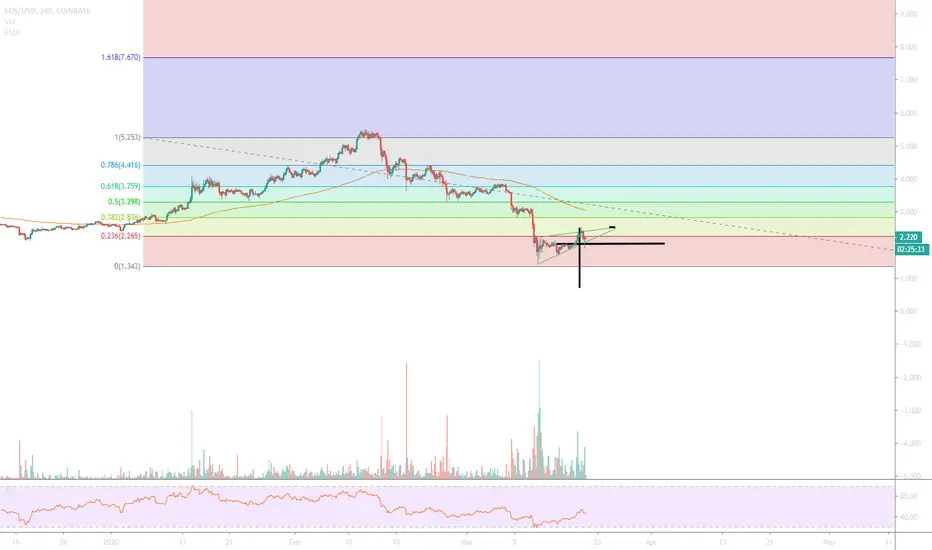
EOS-USDT/USD pullback anytime... Like that weird lobster General said in Star Wars:
"It's a TWAP!"
Good returns on EOS and other markets lately, looking healthy but some cooling off needed for a few days to a week at least. Bearish divergences showing up on some of the best indicators. If you're day-trading, take your profits and wait for pullback. Happy Hunting :) :)

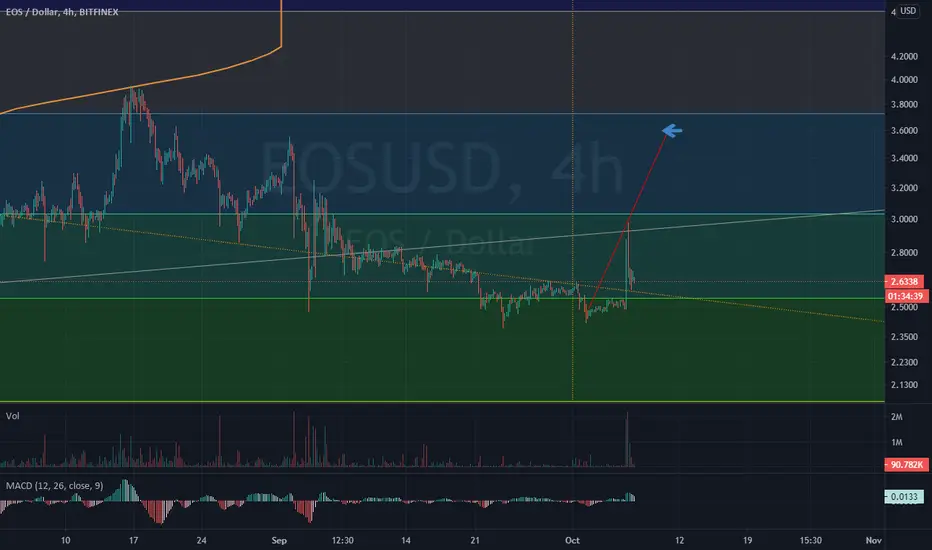
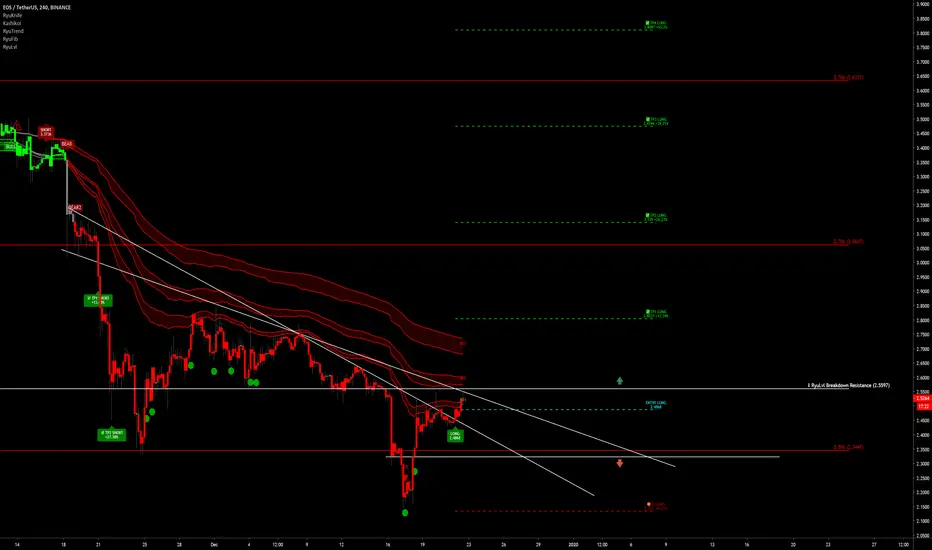
EOS / USDT 4h BreakoutBreakout of trendline & +TR (bullish trend reversal)
Next trendline & RyuLvl (reversal level) resistance ahead
Good if bulls can breakout & hold above
Invalidation level break below support shown on chart
Bounced off RyuKnife (green circle) at the bottom
Please like and follow for more updates!
Try our algorithms & save time, eliminate bias, easily & instantly identify trend, levels, & setups!
EOS intraday predictionEOS will go for retracement into signed green zone after bearish divergence . If BTC won' t dump will EOS continue untill BIG resistance trendline of BIG falling wedge tracking from the beginning of correction .
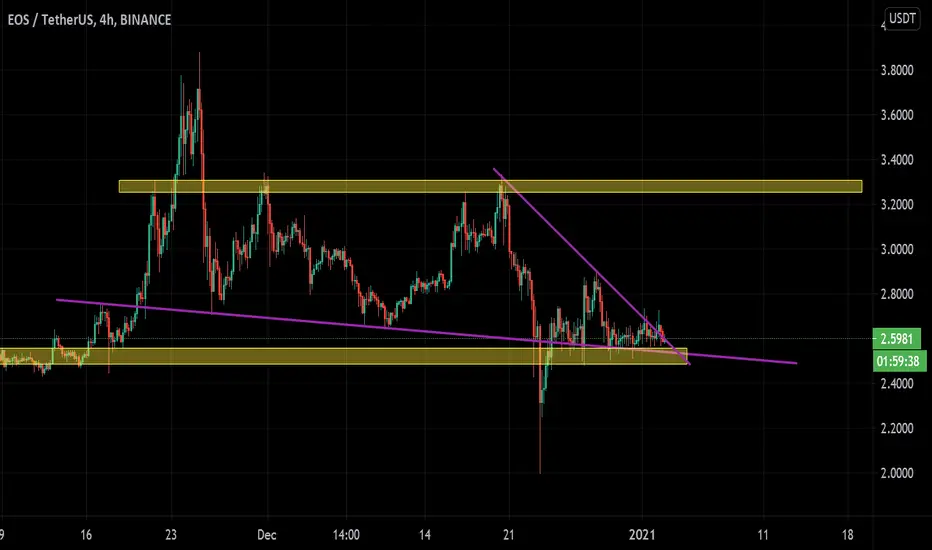
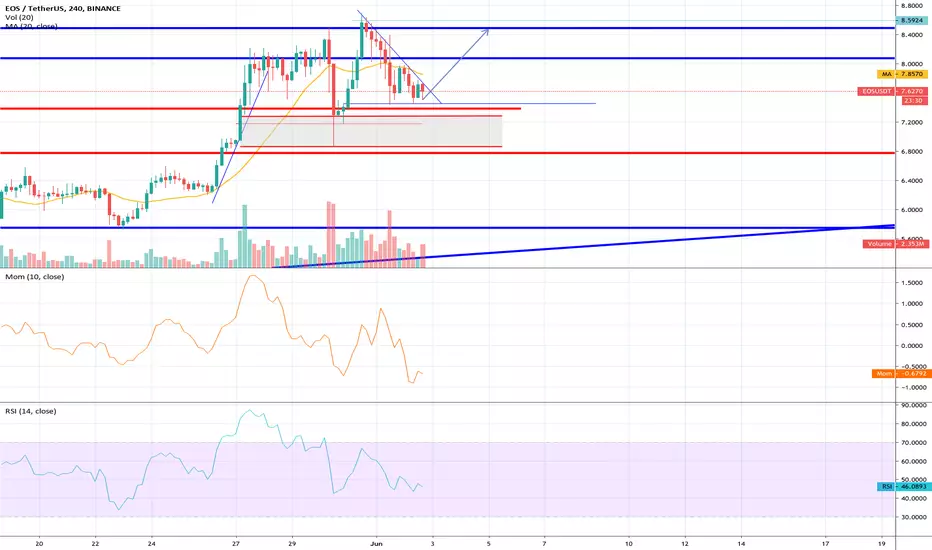
Eos Descending triangle in 4h chartIn descending triangle chart patterns, there is a string of lower highs which forms the upper line. The lower line is a support level in which the price cannot seem to break.In the chart above, you can see that the price is gradually making lower highs which tell us that the sellers are starting to gain some ground against the buyers.If resistance can hold may eventually break out.
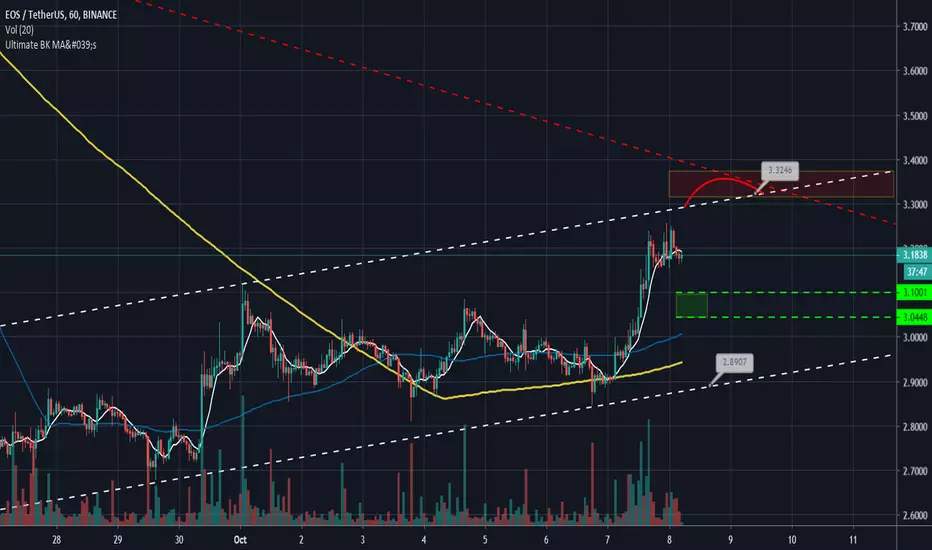
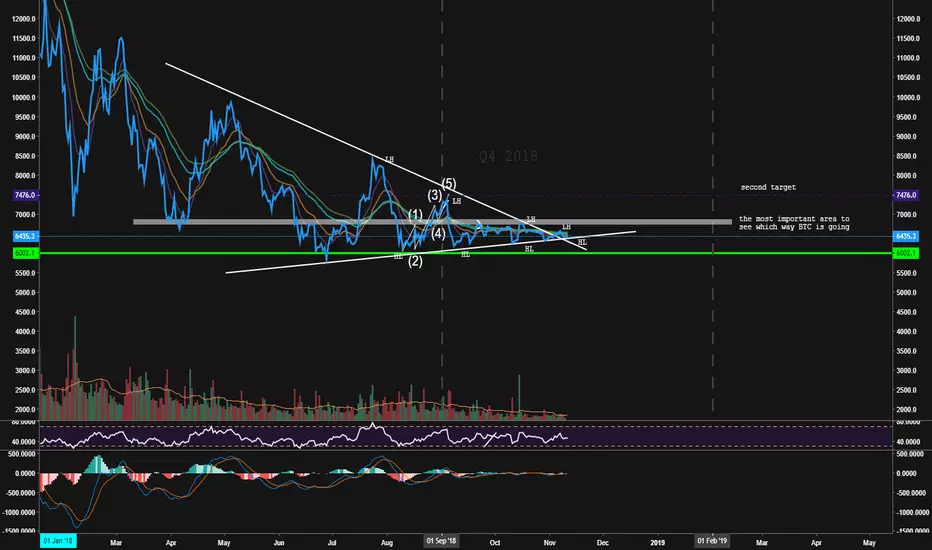
$BTCBitcoin (Thoughts):
- used a line because it has insights that candle doesnt
- BTC needs a catalyst like ETF, major adoption, etc. but can blow up easily after that
- $6800 is the most important resistance for BTC to break
Q4 for BTC is usually a good time :)
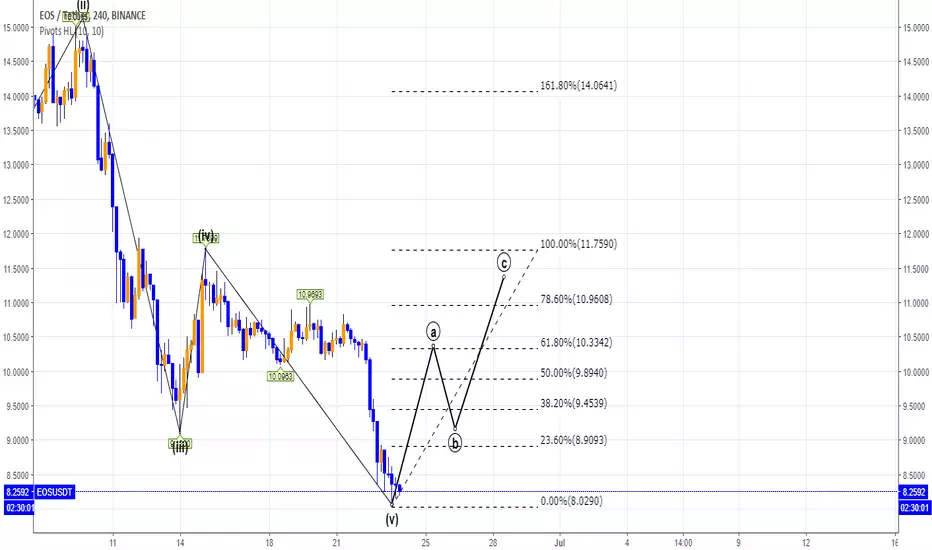
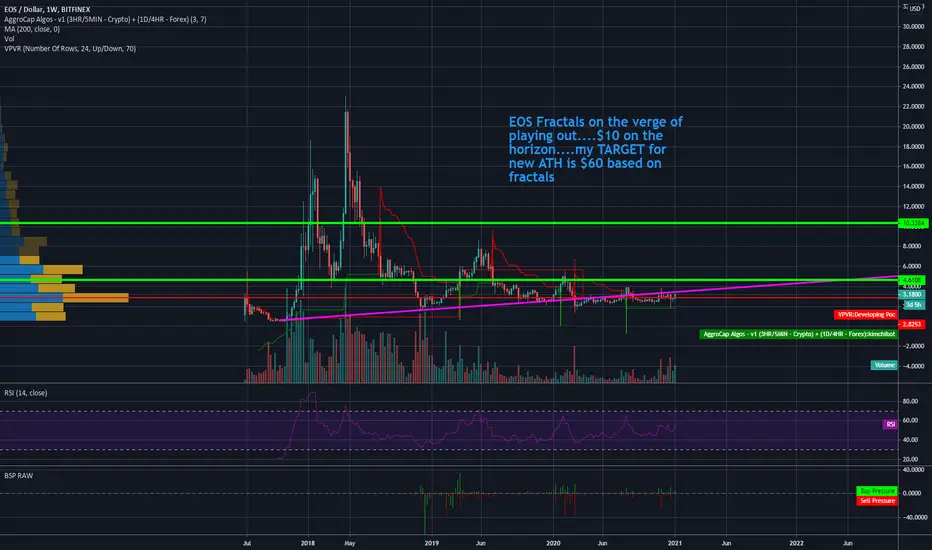
EOS/USDT ABC correction first target at 25%Hello
I was looking at Eos/usdt chart and i have recognised a 5 elliot impulsive wave bear that apparently just closed the cicle and its about to start the ABC correction, these are my targets labeled in the chart, 10.33 the first one
nice rsi divergence in the hourly time frame ( not in the chart )
Kiss
BlacKouTraZ