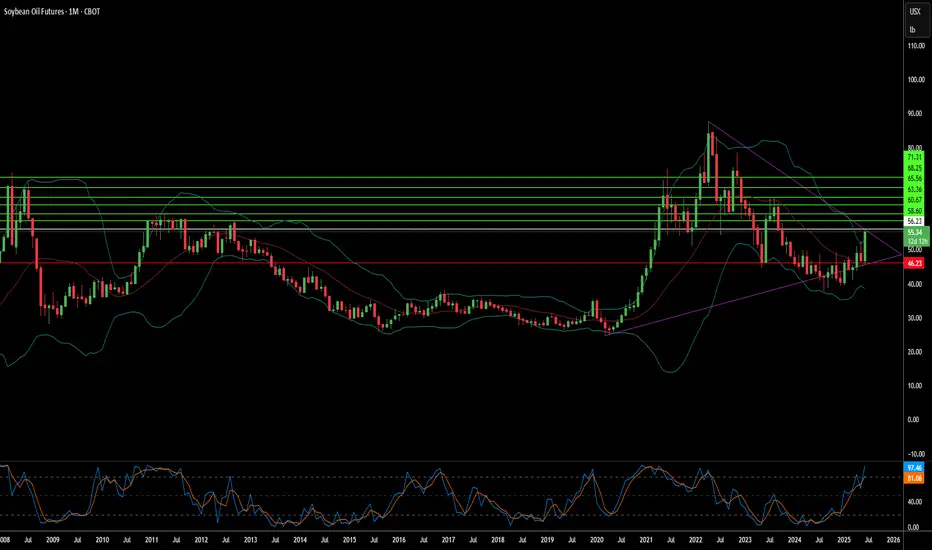
Why the Sudden Surge in Soybean Oil Prices?Recent sharp increases in Chicago soybean oil prices reflect a confluence of dynamic global and domestic factors. Geopolitical tensions, particularly those impacting crude oil markets, have played a significant role, as evidenced by the recent surge in Brent crude futures following events in the Middle East. This volatility in the broader energy complex directly influences the cost and strategic value of alternative fuels, positioning soybean oil at the forefront of this market shift.
A primary driver of this ascent is the transformative policy initiatives from the U.S. Environmental Protection Agency (EPA). The EPA's proposed Renewable Fuel Standard (RFS) volume requirements for 2026 and 2027 represent an aggressive push towards increased domestic biofuel production. These mandates, significantly exceeding previous targets, aim to bolster U.S. energy security and provide substantial support for American agriculture by boosting demand for soybeans and their derivatives. Key changes, such as the transition to RIN equivalents and reduced RIN costs for imports, are designed to further incentivize domestic consumption and reshape market dynamics.
This policy-driven demand fundamentally reorients the U.S. soybean oil market, causing Chicago Board of Trade futures to increasingly reflect internal American forces rather than global trends. This necessitates a shift in focus for traders towards physical market prices in other regions for international insights. The market has reacted swiftly, with notable increases in futures prices, a surge in open interest, and record trading volumes, indicating strong investor confidence in soybean oil's role within this evolving landscape. Concurrently, the new mandates exert pressure on imported biofuel feedstocks, further solidifying the emphasis on domestic supply.
Ultimately, the rise of soybean oil prices signifies more than just market speculation; it marks a pivotal transformation. It positions soybean oil as an essential commodity within the U.S.'s energy independence strategy, where robust domestic demand, shaped by forward-looking policy, becomes the prevailing force. This transition underscores how intertwined agricultural markets now are with national energy objectives and global geopolitical stability.
Epa
Ubisoft Stock This could take a while to play out
Will buy big if it get's in the green zone
Green zone has not been retested yet


$NZDUSD | Wolfe Wave | Proprietary ETA and EPA ModelHello Traders,
Hope you are all doing well. In my previous NZDUSD chart (related links) I proposed an ETA for the recent bullish Wolfe Wave created in the Daily Chart.
I understand that the above chart can take some time. I decided to post this chart in the M15 time frame to test my proprietary ETA and EPA model for the Wolfe Wave in real time and in public.
The ETA method is something I have been working on for quite some time and am finally ready to post it live for you guys to see.
I will update this chart as it moves along.
Best,
Chartistry

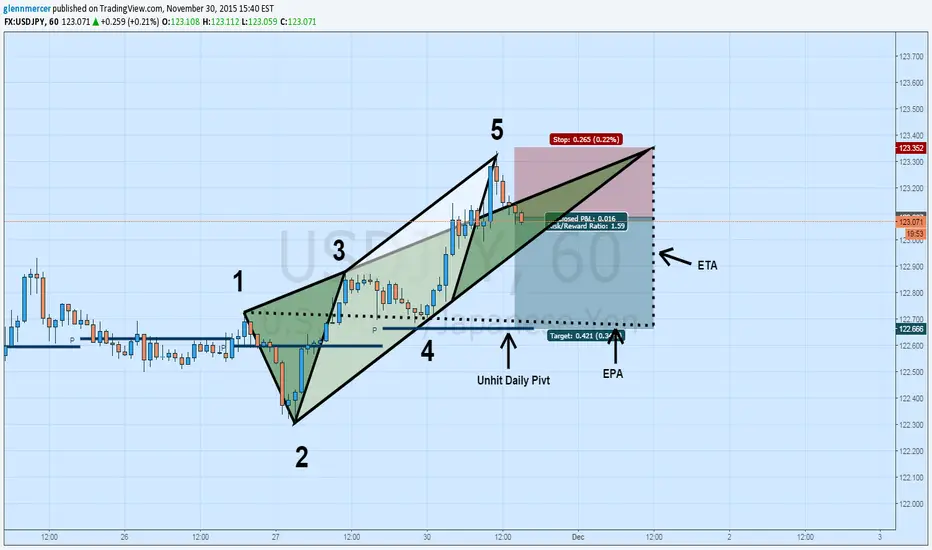
USDJPY Short: Bearish Wolfe Wave to PivotUSDJPY has completed a nice bearish Wolfe Wave setup on the 1HR chart. The target line is confluent with the unhit daily pivot for 11/30/15.
Entry: Market (around 123.07)
SL: Above recent highs
TP: Unhit daily pivot
R/R: 1.6
Thanks for your continued support and don't forget to click the thumbs up button and follow for future updates and more trade ideas!