Corrective Dip or New Downtrend on the S&P 500 Futures?🟣 1. Impulses vs. Corrections – The Classical View
When price trends, it doesn't move in a straight line. Instead, it alternates between directional movements called impulses and counter-directional pauses or retracements known as corrections. Most analysts define an impulse as a sharp, dominant move in the direction of the trend—typically accompanied by rising volume and momentum indicators. Corrections, on the other hand, tend to be slower, overlapping, and often occur with declining volume.
Common methods to identify impulses vs. corrections include:
Swing structure: Higher highs and higher lows suggest impulse; overlapping lows suggest correction.
Fibonacci retracements: Corrections often retrace up to 61.8% of a prior impulse.
Moving averages: Price above a rising MA is often viewed as impulse territory.
Volume analysis and oscillators such as RSI or MACD are used to confirm price behavior.
Despite the abundance of methods, the distinction between impulses and corrections often remains subjective. That’s where the Directional Movement Index (DMI) provides an objective lens—especially when paired with price action.
🟣 2. Rethinking Impulses with the DMI Indicator
The Directional Movement Index (DMI), developed by J. Welles Wilder, offers a quantitative way to assess the strength and direction of price movement. It breaks down market activity into three components:
+DMI (Positive Directional Movement Index): Measures the strength of upward movements.
−DMI (Negative Directional Movement Index): Measures the strength of downward movements.
ADX (Average Directional Index): Quantifies overall trend strength but is optional in this discussion.
The key to applying DMI lies in the crossover between +DMI and -DMI:
When +DMI > -DMI, upward price moves dominate—suggesting bullish impulses.
When −DMI > +DMI, downward moves dominate—suggesting bearish impulses.
Calculation is based on a comparison of successive highs and lows over a specific lookback period—commonly set to 14 or 20 periods.
While EMAs track trend direction and momentum, DMI helps dissect who’s in control. This makes it a powerful filter when evaluating whether a breakdown or breakout is likely to become an impulsive trend—or just another correction in disguise.
🟣 3. Case Study – Two Breakdowns, Two Outcomes
Let’s apply this logic to two recent moments on the E-mini S&P 500 Futures (ES) daily chart.
🔹 Feb 21, 2025 Breakdown
Price broke sharply below the 20-period EMA. At first glance, this looked like a potential trend reversal. The DMI confirmed this suspicion: −DMI surged above +DMI, signaling downside impulses were in control. The market followed through with a clear downtrend, confirming the move was not just a pullback—it was a shift in market structure.
🔹 Aug 1, 2025 Breakdown
A similar sharp break below the 20 EMA just occurred again. However, this time +DMI remains above −DMI, despite the bearish price action. This divergence tells a different story: the breakdown may not be impulsive in nature. Instead, it's likely a corrective dip within a broader uptrend, where buyers are still the dominant force.
This is a textbook example of how a moving average crossover without DMI confirmation can mislead traders. By combining these tools, we’re able to make more informed decisions about whether price action is signaling a true shift—or just a pause.
🟣 4. CME Product Specs – ES vs. MES
Traders can express directional views on the S&P 500 using two primary CME futures contracts: the E-mini S&P 500 Futures (ES) and the Micro E-mini S&P 500 Futures (MES). Both track the same underlying index but differ in size, capital requirement, and tick value.
✅ E-mini S&P 500 Futures (ES)
Symbol: ES
Contract Size: $50 x S&P 500 Index
Tick Size: 0.25 index points
Tick Value: $12.50
Initial Margin: Approximately $21,000 (varies by broker and through time)
Market Hours: Nearly 24/6
✅ Micro E-mini S&P 500 Futures (MES)
Symbol: MES
Contract Size: $5 x S&P 500 Index
Tick Size: 0.25 index points
Tick Value: $1.25
Initial Margin: Approximately $2,100 (varies by broker and through time)
The Micro contract provides access to the same market structure, liquidity, and price movement as the E-mini, but with a fraction of the exposure—making it ideal for smaller accounts or more precise position sizing.
🟣 5. Risk Management Matters
Understanding whether a market move is impulsive or corrective isn’t just academic—it’s the difference between positioning with the dominant flow or fighting it. Traders often get trapped by sharp moves that appear trend-defining but are simply noise or temporary pullbacks.
Using tools like DMI to confirm whether directional strength supports price action provides a layer of risk filtration. It prevents overreaction to every EMA crossover or sudden price drop.
Stop-loss orders become vital in both impulsive and corrective conditions. In impulsive environments, stops help lock in profits while protecting from reversals. In corrective phases, they act as circuit breakers against breakouts that fail.
Moreover, knowing the product you're trading is critical:
A single ES contract controls ~$320,000 of notional value.
An MES contract controls ~$32,000.
This disparity means poor sizing on ES can magnify errors, while proper sizing on MES can offer flexibility to test, scale, and hedge with tighter capital control.
Whether you're reacting to price or preparing for continuation, risk management is the only constant. It’s what turns analysis into disciplined execution.
When charting futures, the data provided could be delayed. Traders working with the ticker symbols discussed in this idea may prefer to use CME Group real-time data plan on TradingView: tradingview.sweetlogin.com - This consideration is particularly important for shorter-term traders, whereas it may be less critical for those focused on longer-term trading strategies.
General Disclaimer:
The trade ideas presented herein are solely for illustrative purposes forming a part of a case study intended to demonstrate key principles in risk management within the context of the specific market scenarios discussed. These ideas are not to be interpreted as investment recommendations or financial advice. They do not endorse or promote any specific trading strategies, financial products, or services. The information provided is based on data believed to be reliable; however, its accuracy or completeness cannot be guaranteed. Trading in financial markets involves risks, including the potential loss of principal. Each individual should conduct their own research and consult with professional financial advisors before making any investment decisions. The author or publisher of this content bears no responsibility for any actions taken based on the information provided or for any resultant financial or other losses.
Equityfutures

From Fiat to Crypto: A Pragmatic View on Cross-Asset USD Impact1. Introduction: Why Understanding USD Impact Matters
The U.S. dollar (USD) plays a pivotal role in shaping global financial markets, especially for assets denominated in dollars, such as S&P 500 Futures (ES/MES). Its movements affect equity market flows, international capital dynamics, and, ultimately, price trends for USD-denominated instruments. However, traditional methods of gauging USD strength often fall short of capturing the nuanced interplay between fiat currencies and emerging digital assets.
To bridge this gap, we introduce a pragmatic and dynamic solution: the USD Proxy. By combining a carefully weighted mix of key global currencies (Euro and Yen) with Bitcoin (BTC), this proxy provides a comprehensive and CME-specific lens for understanding USD strength. It is a modern approach to assess the dollar's “true” influence on equity markets, particularly the S&P 500 Futures.
2. The USD Proxy: A Pragmatic Cross-Asset Index
The USD Proxy is built to reflect real-time market dynamics, offering traders a potentially more relevant measure of the dollar’s impact. Unlike static indexes, this proxy is dynamic, continuously adjusting based on three major components:
Euro Futures (6E): Representing the largest fiat currency trading block.
Japanese Yen Futures (6J): Capturing the Asian market's influence.
Bitcoin Futures (BTC): Adding a layer of innovation by integrating cryptocurrency, which operates independently of traditional fiat systems.
The weighting is determined by notional values, market prices, and volume-weighted activity as volumes change and evolve through time, ensuring the proxy adapts to liquidity and relative importance. This structure provides a balanced view of USD strength across fiat and crypto markets, making it highly applicable to modern trading.
3. Adjusting S&P 500 Futures Using the USD Proxy
To uncover the “true” equity market performance, the S&P 500 Futures can be adjusted using the USD Proxy. The formula is straightforward:
Adjusted S&P 500 Futures = S&P 500 Futures Price x USD Proxy Value
This adjustment neutralizes the effects of USD strength or weakness, revealing the core price action of the equity market. By doing so, traders can distinguish between moves driven by dollar fluctuations and those stemming from genuine market trends.
For example, during periods of a strengthening USD, the unadjusted S&P 500 Futures may appear weaker due to currency pressure. However, the adjusted version may provide a clearer picture of the underlying equity market, enabling traders to make more informed decisions.
4. Regular vs. Adjusted S&P 500 Futures: Key Insights
The comparison between regular and USD Proxy-adjusted S&P 500 Futures charts could reveal critical divergences that may have been often overlooked. These divergences highlight how currency fluctuations can obscure or exaggerate the equity market’s actual performance.
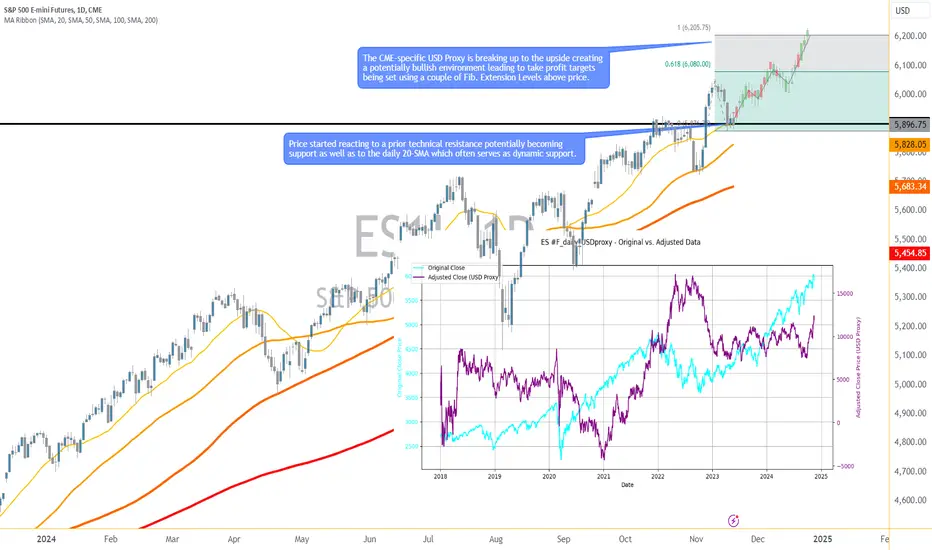
For instance, while the S&P 500 Futures have recently reached new all-time highs, some market participants may view this as an indication of the market being overpriced. However, when adjusted using the USD Proxy, the chart reveals a different reality: the S&P 500 Futures are far from their highs. This adjustment aims to neutralize the currency's impact, uncovering that the recent record-breaking levels in the unadjusted chart are likely largely influenced by USD dynamics rather than true underlying equity market performance.
5. Trading Opportunities in Adjusted S&P 500 Futures
The adjusted S&P 500 Futures chart opens up new possibilities for traders to identify actionable insights and anomalies. By neutralizing the currency effect, traders can:
Spot Relative Overperformance: Identify instances where the adjusted chart shows strength compared to the regular chart, signaling robust underlying equity market dynamics.
Capitalize on Potential Anomalies: Detect price-action discrepancies caused by abrupt currency moves and align trades accordingly.
Refine Entry and Exit Points: Use the adjusted chart especially during high-volatility periods influenced by the USD.
6. Trading Application: A Long Opportunity in Adjusted S&P 500 Futures
Trade Setup:
o Instrument: S&P 500 Futures (ES) or Micro S&P 500 Futures (MES).
o Entry Point: Around 5900.00
o Targets:
Primary Target: 6205.75 (aggressive traders, Fibonacci extension level).
Conservative Target: 6080.00 (moderate traders, earlier Fibonacci extension).
o Stop Loss: Below the entry, calculated to maintain a 1:3 reward-to-risk ratio.
Rationale:
The adjusted S&P 500 Futures chart highlights a technical setup where the price is reacting to:
Breakout to the Upside: The adjusted chart is breaking out of a key resistance level, signaling potential continuation of upward momentum.
The 20-SMA: Acting as dynamic support, aligning with recent price behavior.
Technical Support Level: A key horizontal level.
These converging factors suggest the potential for a bullish continuation, targeting Fibonacci extension levels at 6205.75 or 6080.00. The adjusted chart provides added confidence that the move is not overly influenced by USD fluctuations, grounding the analysis in equity-specific dynamics.
Trade Mechanics:
o Instrument Options:
ES (full-size contract), with a point value of $50 per point.
MES (micro-sized version), designed for smaller accounts or precision risk management, with a point value of $5 per point—10 times smaller than the full-size ES contract.
o Margins (approximate, depending on broker):
ES: Approximately $15,000 per contract.
MES: Approximately $1,5000 per contract—10 times smaller than the ES margin.
Execution Plan Example:
Place Buy Limit Order at 5900.00.
Set Stop Loss below the entry, maintaining a 1:3 reward-to-risk ratio.
Take partial profits or adjust stop losses as the price approaches 6080.00 for conservative traders or 6205.75 for aggressive targets.
7. Conclusion: A Fresh Perspective on USD and Equity Futures
By introducing the USD Proxy and applying it to S&P 500 Futures, traders gain a powerful tool to assess market dynamics. This cross-asset approach—spanning fiat and crypto—bridges the gap between traditional and modern financial metrics, offering unparalleled insights.
The adjusted S&P 500 Futures chart neutralizes currency distortions, revealing the market's true movements. Whether identifying divergences, refining trading strategies, or uncovering hidden opportunities, this method empowers traders to approach the market with clarity and precision.
As markets evolve, tools like the USD Proxy demonstrate the importance of integrating diverse assets to stay ahead in a complex trading environment.
When charting futures, the data provided could be delayed. Traders working with the ticker symbols discussed in this idea may prefer to use CME Group real-time data plan on TradingView: tradingview.sweetlogin.com - This consideration is particularly important for shorter-term traders, whereas it may be less critical for those focused on longer-term trading strategies.
General Disclaimer:
The trade ideas presented herein are solely for illustrative purposes forming a part of a case study intended to demonstrate key principles in risk management within the context of the specific market scenarios discussed. These ideas are not to be interpreted as investment recommendations or financial advice. They do not endorse or promote any specific trading strategies, financial products, or services. The information provided is based on data believed to be reliable; however, its accuracy or completeness cannot be guaranteed. Trading in financial markets involves risks, including the potential loss of principal. Each individual should conduct their own research and consult with professional financial advisors before making any investment decisions. The author or publisher of this content bears no responsibility for any actions taken based on the information provided or for any resultant financial or other losses.