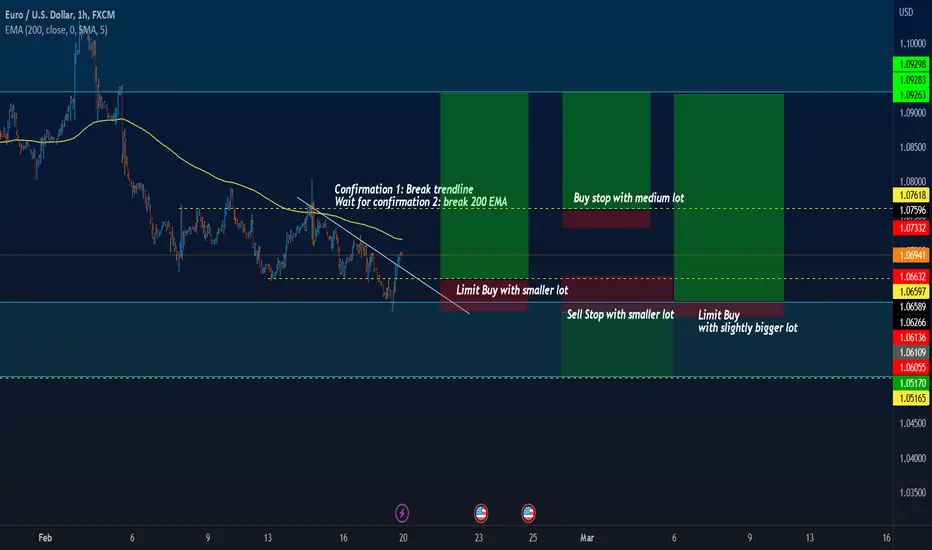
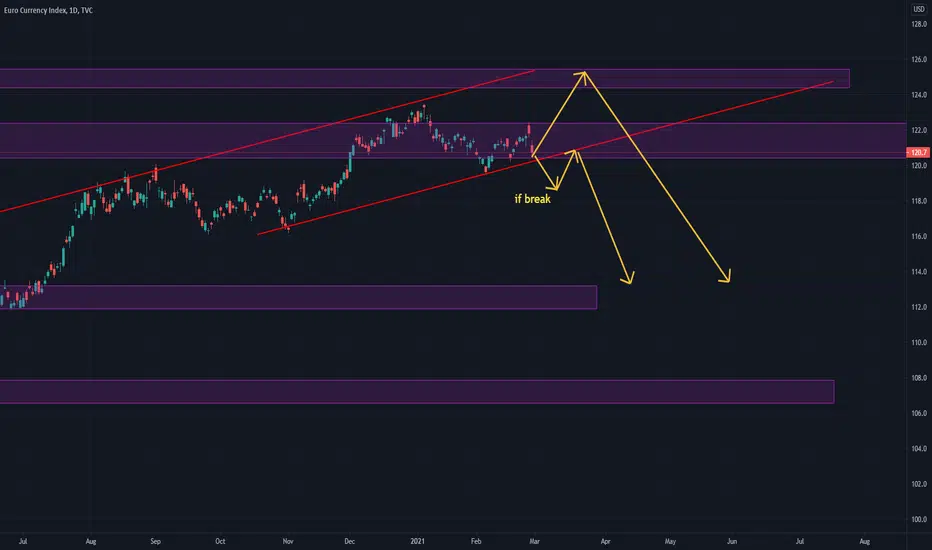
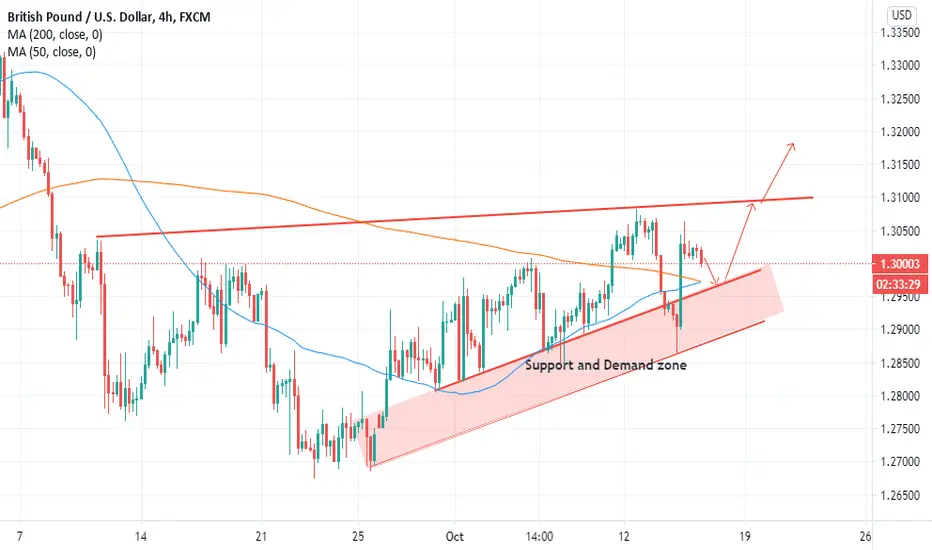
EURO Trading Plan for upcoming weekI think EURO is inside a range in bigger timeframe. We are in the support of the range now.
Some bullish confirmation had been made: break of the trendline.
We may see a retest of the trendline, and/or pattern formation in support zone (around yellow dotted line below), hence we can try to limit buy there. Should the support broken, we can try to sell.
Confirmation of bullish bias: Break of the 200 EMA
Eruo
Week Ahead Stock prices went down a lot during trading on Thursday, but they went up a lot during trading on Friday. Because of the rally that happened during the day, the main averages set new highs for the first quarter as they closed.
As the trading day came to an end, the main averages went up even more, and at the end of the session, they were at their highest levels of the day. The Dow Jones Industrial Average went up 424.38 points, or 1.3% , to 33,761.05 . The Nasdaq Composite Index rose 267.27 points, or 2.1 %, to 13,047.19 , while the S&P500 rose 72.88 points, or 1.7% , to 4,280.15. The S&P 500 index went up by 3.3 % over the course of the week, giving it its fourth straight weekly gain. The Nasdaq and Dow both gained 3.1 percent and 2.9 percent, respectively. The current trend of stocks going up has continued, so the main averages are now much higher than they were in June and have reached their highest levels in the last three months. As a result of data showing that consumer and producer prices were lower than expected, there is hope that inflation has reached its peak, which has also helped Wall Street keep going. The U.S. Department of Labor (Labor Department) recently released a study that showed prices for goods brought into the U.S. from other countries fell more than expected in July.
The prices paid for imported goods went down by 1.4 % in July, according to the Department of Labor. This was after an increase of 0.3% in June that was later changed to be higher. Since import costs hadn't gone down since December of 2021, this was a big change. Instead of the 0.2% increase in import prices that was first reported for the previous month, economists had expected import prices to drop by 1.0% . The survey also showed that the prices of goods sold abroad went down by 3.3% in July after going up by 0.7% in June. It was expected that export prices would go down by 1.1% . According to a University of Michigan study, consumer mood in the United States improved much more than expected in August. This made people more interested in buying things. According to the survey, the index that shows how consumers feel about the economy went up from 51.5 in July to 55. 1 in August. The average prediction of economists was that the index would go up to 52.5. After hitting a new all-time low of 50. 0 in June, the index of consumer sentiment kept going up in July, with a bigger gain than had been expected. According to another report from the University of Michiga n, inflation estimates for the next year dropped from 5.2 percent in July to 5.0 percent in August, but inflation estimates for the next five years went up from 2.9 percent t to 3.0 percent.
Estimates of inflation for one year are at their lowest level since February, but Director of Surveys of Consumers Joanne Hsu pointed out that these estimates are still much higher than the 4.6 percent figure from one year ago.
The main reason why the Philadelphia Semiconductor Index went up by three percent was that the prices of semiconductor stocks went back up after falling earlier in the week. The NYSE Arca Airline Index went up by 2.8% to a closing high that hadn't been seen in the market for two months. This shows that airline stocks were also very strong. The strong performance of networking stocks all day led directly to a gain of 2.6 percentage points for the NYSE Arca Networking Index. At the end of the session, the market index hit its highest level in well over three months. Gold stocks, chemical stocks, and brokerage stocks all moved up a lot, as did most of the other main market segments. Different Markets Friday's trading on stock markets in the Asia-Pacific region was a mixed bag, which shows how uncertain the region's economy is as a whole. After a holiday on Thursday, the Nikkei 225 Index in Japan went up by 2.6 percentage points , but the Shanghai Composite Index in China went down by 0.2 percentage poin ts. At the same time, on any given day, all of the major European markets were up. While the DAX Index in Germany went up by 0.7% , the FTSE 100 Index in the UK went up by 0.5%, and the CAC 40 Index in France went up by 0.1%. The value of Treasury's was able to make up some ground on the bond market after losing a lot during the previous session. As a result, the yield on the benchmark ten-year note fell by 3.9 basis points to 2.849 percent, moving in the opposite direction of its price.
Along with the flood of housing statistics coming out next week, reports on retail sales and industrial output are sure to get a lot of attention. Traders will almost certainly keep a close eye on the minutes from the Federal Reserve's most recent meeting, hoping to learn something new about how interest rates will move in the future.
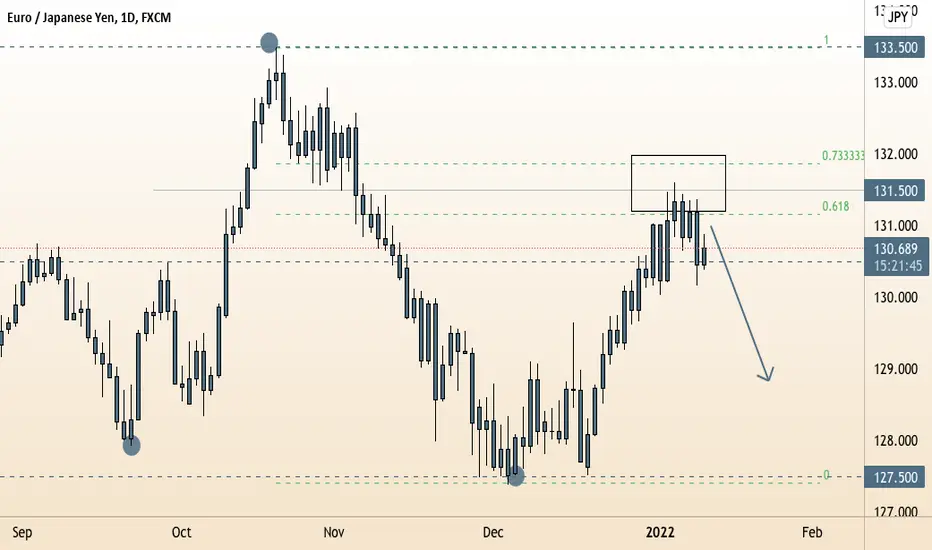
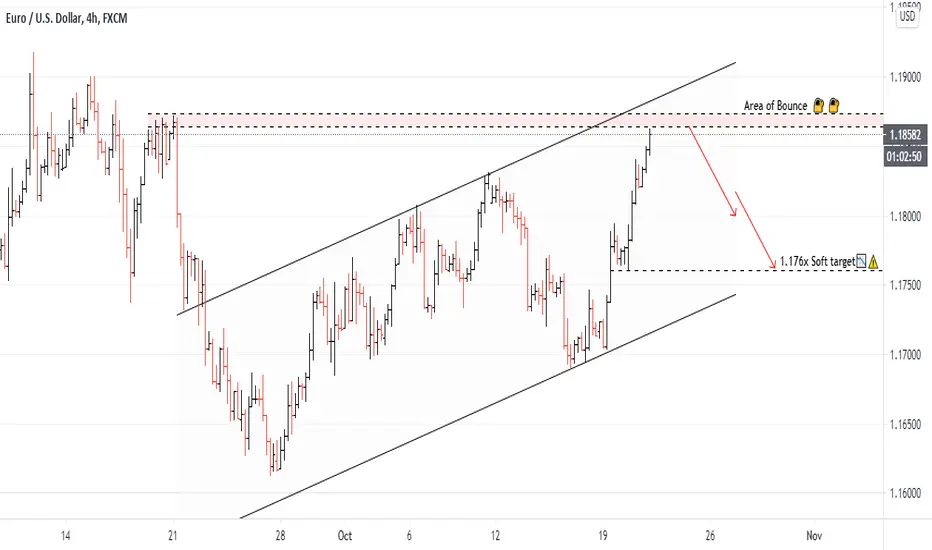
EURJ 61.8 1d RetacementOn Friday, the US dollar fell as a result of mixed employment data, causing the euro to climb by half a point.
Instead of the 450k projected, just 199k jobs were added to the non-farm payroll in December. The unemployment rate fell from 4.1 percent to 3.9 percent, and hourly wages increased by 0.6 percent, exceeding expectations. Many individuals believe the Federal Reserve will boost interest rates in March. This, according to others, contrasts with the European Central Bank's (ECB) strategy, which does not appear to be changing interest rates anytime soon. The market is also attempting to figure out when the Fed will begin selling the assets it purchased as part of its economic stimulus program. When the latest construction approvals data came in stronger than expected, it was a good day for the Australian Dollar. The fresh data was better than predicted, despite the fact that the prior print had a smaller adjustment. The Asian stock market was divided, but the Kosdaq was the only one with a lot of fresh developments. It was down more than 1% after a similar day on Friday on the Nasdaq. Interest rates rise, making technology equities less desirable because they frequently require loans to expand.
The news rocked bond markets in Asia hard after the meltdown in Treasuries on Friday. The benchmark 10-year government bonds in Australia and New Zealand both have higher yields than they had a few months ago. Because Japanese government bonds (JGBs) took the day off, they didn't trade today.
Crude oil rose a little bit during Asian trade, while gold fell a little bit.
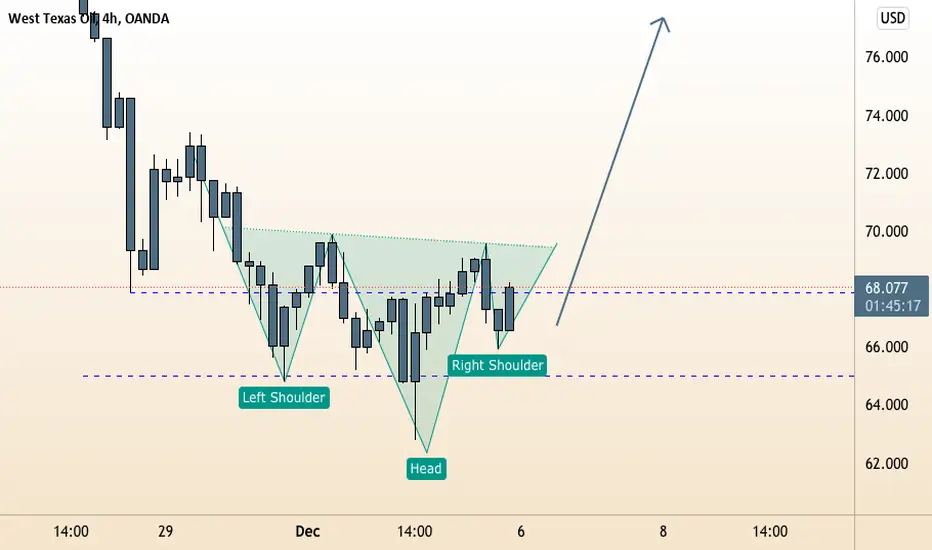
WTICOUSD (USOIL) Rejection at KL/INV HSThe most anticipated event of the week, a decision by OPEC+ on whether or not to cease its monthly 400,000 b/d oil production rise, turned out to be a bit of a non-event, with the nations agreeing to remain with the previous plan but retaining the flexibility to reverse that decision if required. While oil prices initially fell as a result of the revelation, later disclosures about the caveats involved allayed market concerns about OPEC+ ignoring Omicron dangers. First, OPEC+ promised to reassemble soon if market circumstances changed. Second, nations that have already overproduced their quotas will have their future production objectives limited in order to balance their yearly statistics. These limitations helped fuel the rise in oil prices towards the conclusion of the week.
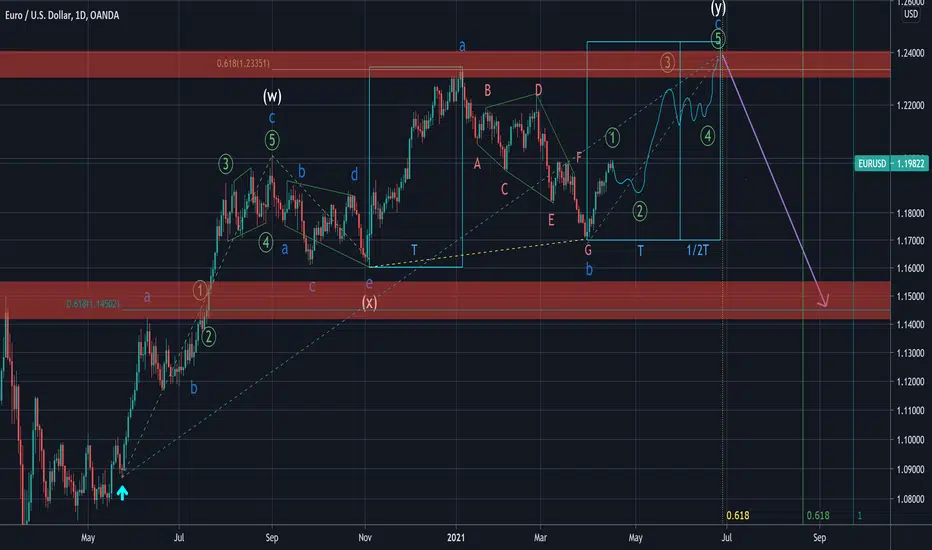
EURUSD would possibly go upSO as it might seem a bit confusing I'll go through the details
The market appears to be forming a double combination which is a zigzag-flat and in between, they're followed by a neutral triangle as an X-Wave.
so if the market unfolds the flat pattern and the C of the Y-Wave behaves impulsively the flat would be the best scenario for now, if not the pattern could change in to shape of a triangle or other time-consuming patterns.
considering the existing scenario correct, as time specifications are plotted on the chart, C-Wave of a flat would normally take 61.8% of the time consumed by waves A and B summed up or it will take 161.8% of the time of wave A in the undergoing case
Segment Y would often have 61.8% of the W-Wave in terms of price and would take a longer time In comparison to sagment W and the retrace after the WXY pattern is completed would be around 61.8% of the whole rally
it's just a general idea of where the market is and how it might behave
I hope it helps you all.
EURUSD Bullish Momentum Over !Trade Analysis Based on Fundamentals and Price Action.
With Risk Management You Will Never Loss.
Thank You.
Feel free to share Your View and Comments Below.
Sterling Pushing upside on Brexit, could extend deadline to JanSuggestion:
BUY GBPUSD 1.299-30 SL BELOW 1.2960 TGT 1.3090/3100
ELSE
SELL BELOW 1.2960 FOR 1.2895/2830 SL ABV 1.3030
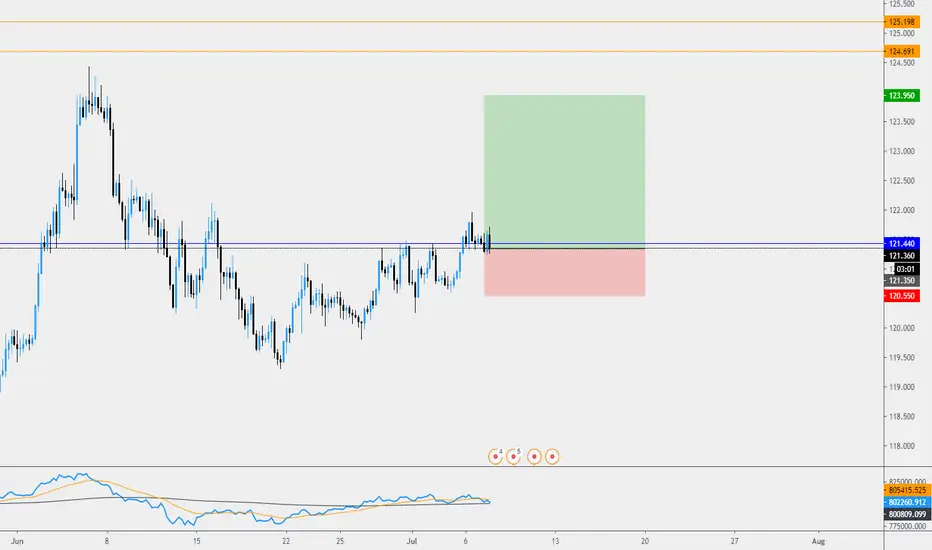
EUR/JPY Long SetupEntry --> 121.35
Stop Loss ---> 120.55
Take Profit--> 123.95
Risk/Reward --> 3.25
Please Comment, Like, & Follow!
This information is not a recommendation to buy or sell. It is to be used for educational purposes only. Please follow a proper risk management program when trading.7
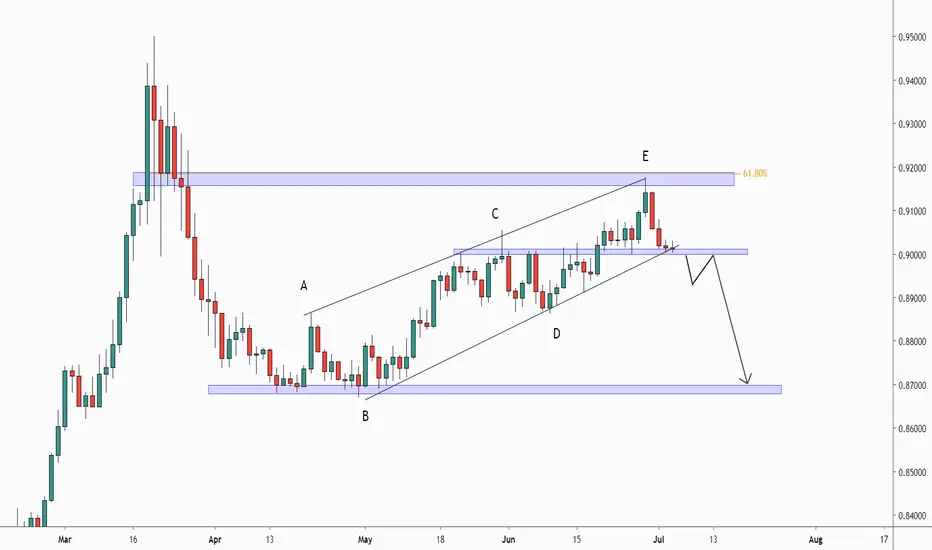
EURGBP ShortThis pair has been in a long term correction. Now, as it hit the 61.8% fibonacci retracement level and considered as the end of wave E, we might see a bearish run for this week. Looking to enter short after a lower high confirmation.
EUR/USD Long SetupEntry --> 1.1243
Stop Loss ---> 1.1217
Take Profit--> 1.1315
Risk/Reward --> 2.8
Please Comment, Like, & Follow!
This information is not a recommendation to buy or sell. It is to be used for educational purposes only. Please follow a proper risk management program when trading.

EURUSD, Trading the TrendLooking at the Euro’s value in US dollars (EURUSD) to find the general trend and potential entries and exits.
We can see historically, due to the momentum of the trend, that using a trend indicator like our Directional Bias Indicator has led to having a rather successful long./ short bias.
Above the yellow line, the bar color is green, and the bias is long. Below, bar color is red, and bias is short.
We always want to trade the direction of the trend, but in general, we will want to enter and exit positions along the trend as well.
To find entries and exits, we can use our Triggers indicator.
In an uptrend, we go long and take profits at L tp (purple arrow), and in a downtrend, we got short and take profits on S tp (blue arrow).
Likewise, if we want to find re-entry, we can look for the purple x marked L e for a long entry, and a blue x marked S e for a short entry.
In other words, we want to first and foremost listen to the long signals from Triggers in an uptrend and the short signals from Triggers in a downtrend.
Right now we have a long bias according to Directional Bias and a long entry according to Triggers. A cross below the yellow line means a short bias from Directional Bias and that means the long is invalidated. Otherwise, the bias from Triggers and Directional Bias is currently bullish on the US dollar against the Euro at the moment... although looking at how close we are to the previous range as defined by Directional Bias, that could change quickly.

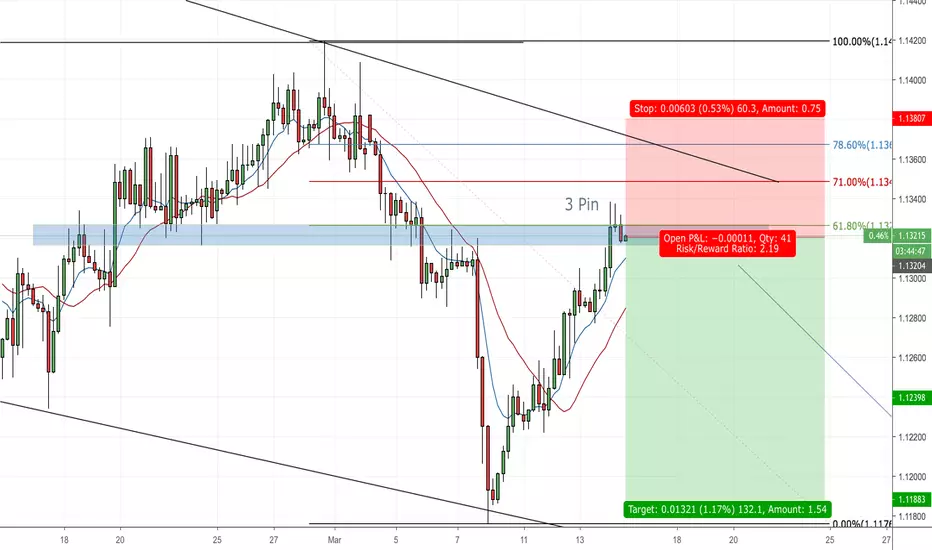
EURO ShortI believe the pullback is near the end. The bearish trend pullback to Fib 61.8%, which is also a resistance level now. 4H TF forms a 3-pin pattern reversal formation. DXY 4H TF shows a morning star formation. If we can get a EURUSD Daily TF reversal signal today, it would be great.
However, any trade is risk, let's see what happens.
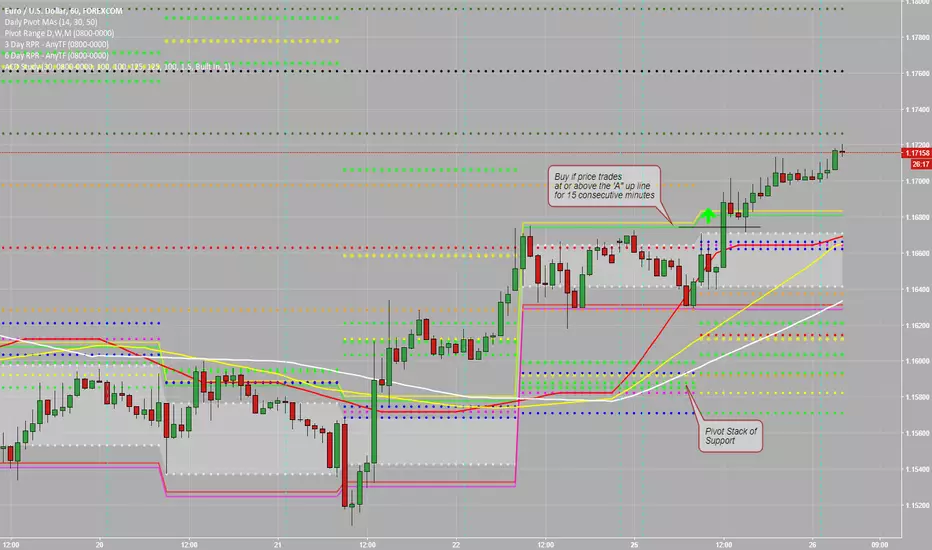
EURUSD 'A' Up Trade Setup - PrudenceA continuation pattern is setting up for the Euro Currency (EURUSD) as we head into the start of the week. The bias remains to the buy side with the Daily Pivot Range well below our current level. Mixed in with the DPR is the 3 Day and 6 Day Rolling Pivot Ranges which is a good Pivot Stack support level.
The Daily Pivot Moving Averages are turned upward and steep coming off a flat period last week.
The action to take is to buy if the price trades at or above the 'A" up line for 15 consecutive minutes, and place the stop loss at the Opening Range low if triggered.
Place the profit targets as stated, which are at are just through the Monthly Pivot Range levels (dark green and black dots).
Entry Price: 1.16743
Stop Loss: 1.16410
Profit Targets: First profit target 1.17350. Second profit target 1.17580. Once price reaches the first profit target bring the stop loss to breakeven (entry price).

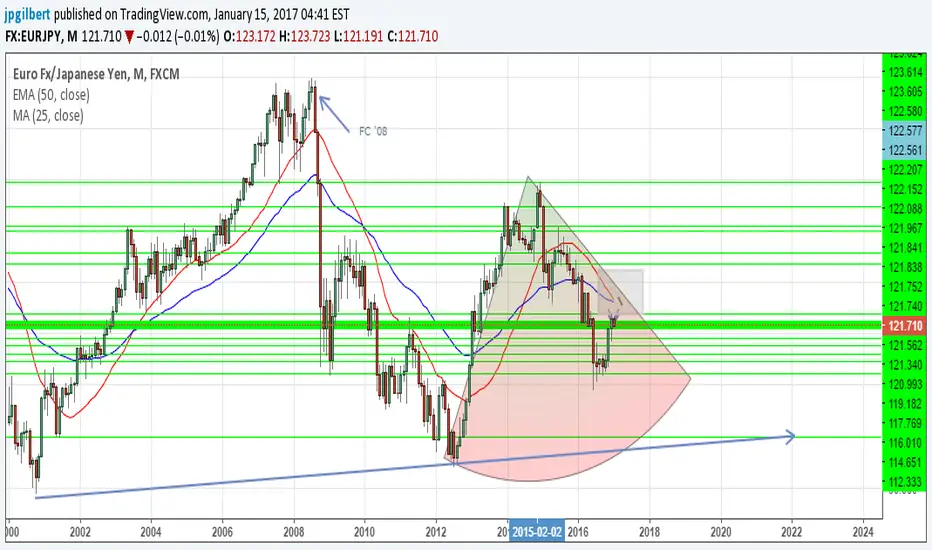
Bleak outlook for EURJPYWith major elections in 2017 looming in numerous EU countries in 2017, and with GB struggling with BRIXIT, suggests weakening euro uncertainty.
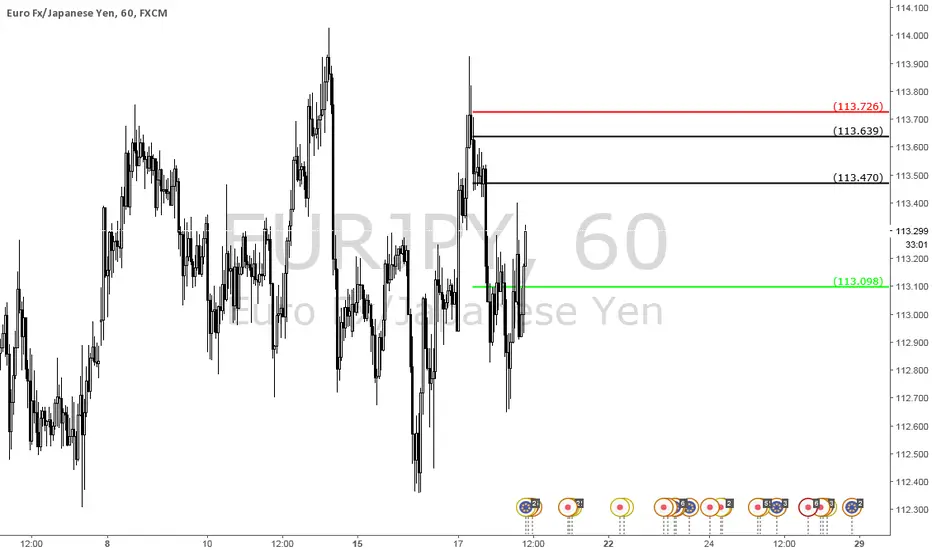
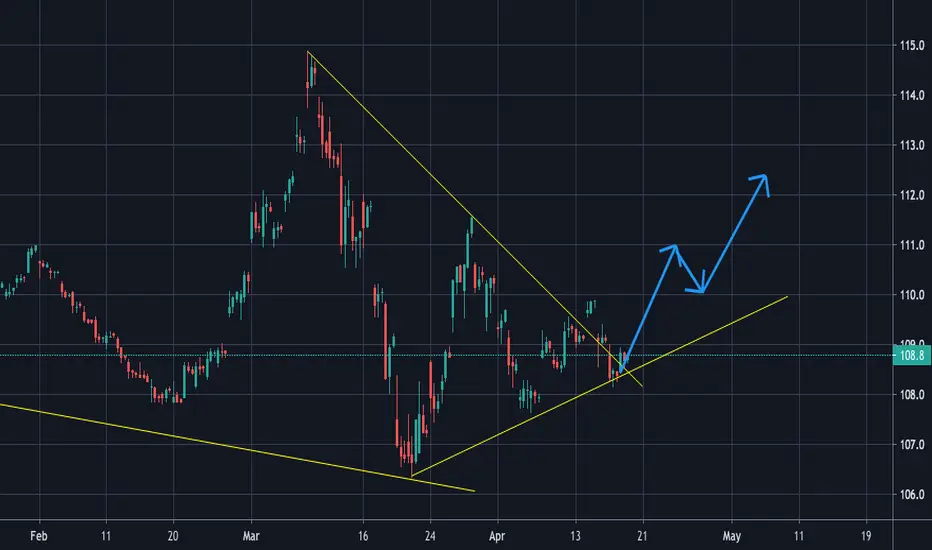
Intraday Swing TradeThis is a quick trade. I anticipate it should hit soon. Profit target not far away, but since I feel it's a high probability setup, I suggest jumping in anyway. I'm a set and forget trader, but in this market, I'll do a confirmation entry. The only downside to confirmation is that you may miss out on the opportunity. My personal strategy, if price trades from the 113.417 area, the wicks protruding from my entry, I will scrub the trade. I move my entry to the real bodies of the candles to cut down on the risk.