BTC Technical Market Update! $110,000?Bitcoin (BTC) Technical Market Update
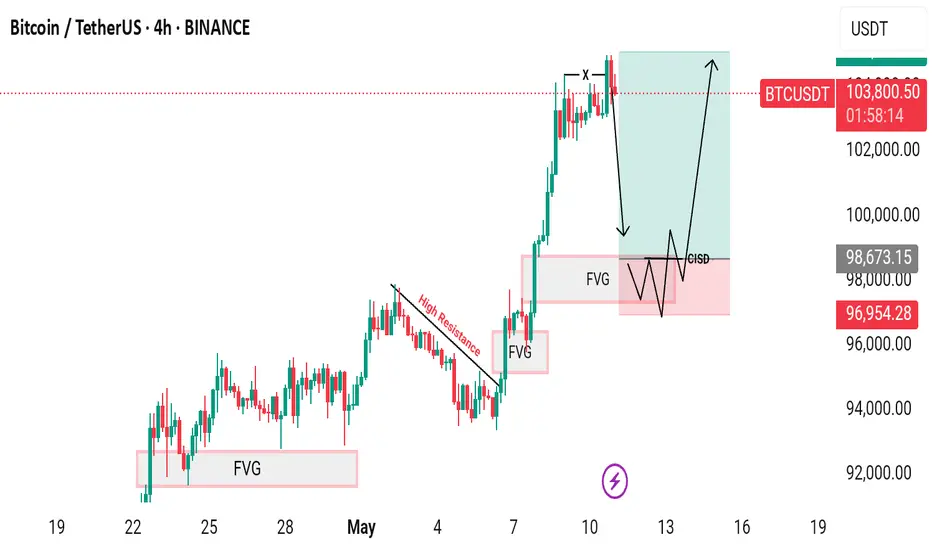
Over the past several trading sessions, Bitcoin (BTC) has demonstrated a pattern of strength, particularly visible on the 4-hour chart. Price action has consistently respected the Fair Value Gap (FVG) zones on this timeframe, taking support from these areas without breaching any significant downside levels. This repeated behavior indicates a strong underlying bullish sentiment, suggesting that market participants are actively defending key support zones.
Furthermore, Bitcoin recently approached a high-liquidity resistance zone—a level that historically acts as a supply barrier—and not only absorbed the liquidity but also decisively broke through it. This move implies that bullish momentum is firmly in control, and short-term resistance levels are being invalidated one after another. The market structure remains intact, with higher highs and higher lows supporting the current trend.
As of now, BTC has just bounced from a 4H FVG and is trading above that support. However, a short-term pullback remains possible. If such a retracement occurs, it is expected to revisit the next significant 4H FVG support zone, which lies approximately between $98,800 and $97,400. This area could act as a strong accumulation zone for buyers, potentially fueling another bullish wave. In the case of renewed upward momentum from this level, Bitcoin could target the $101,000 to $105,000 range in the short to mid-term.
Market participants are advised to remain cautious and observe price behavior as it unfolds in the coming days. Technical setups are aligning in favor of the bulls, but volatility may increase near key resistance and support levels. Always base your trades and investment decisions on thorough analysis, and keep in mind that no setup guarantees results.
Disclaimer: This is not financial advice. Please ensure you conduct your own independent research and analysis (DYOR) before making any trading or investment decisions.
Eruusd
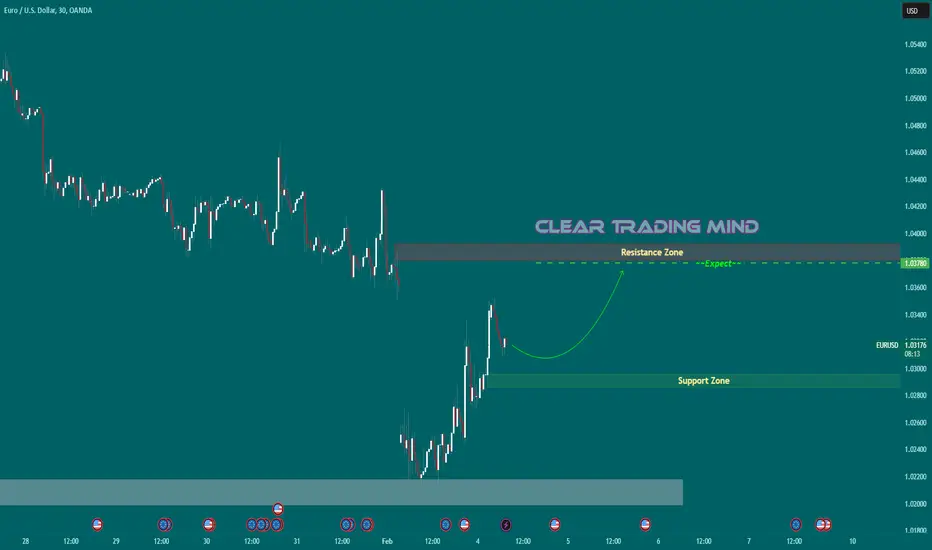
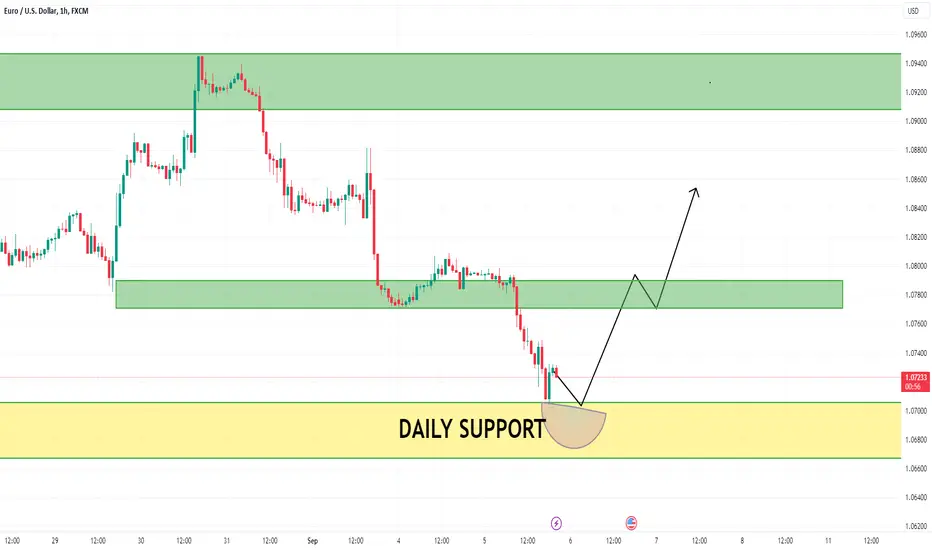
EUR/USD Bulls Charge: 1.03780 in SightEUR/USD looks bullish, aiming for 1.03780 after rebounding from a key support zone. A break above the highlighted resistance area would confirm upside momentum, while holding above the support zone remains crucial for continuation.
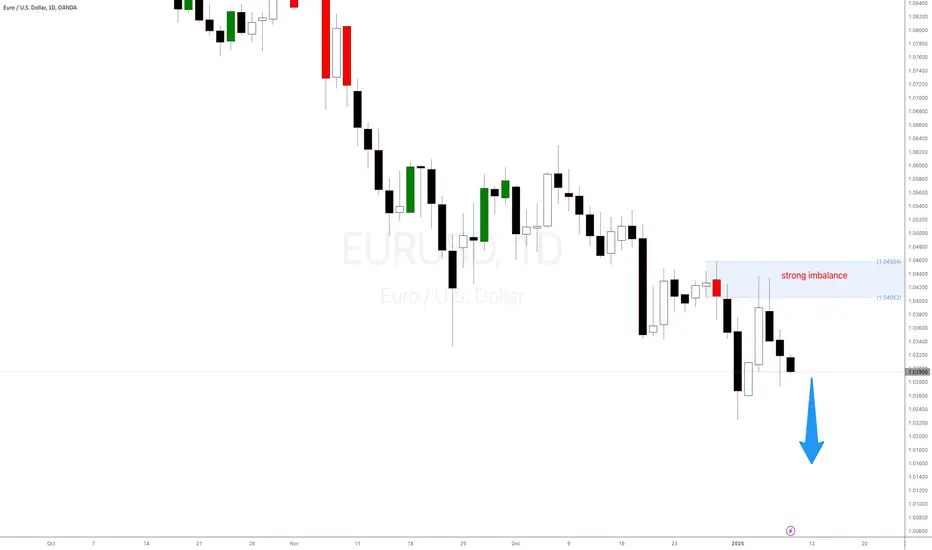
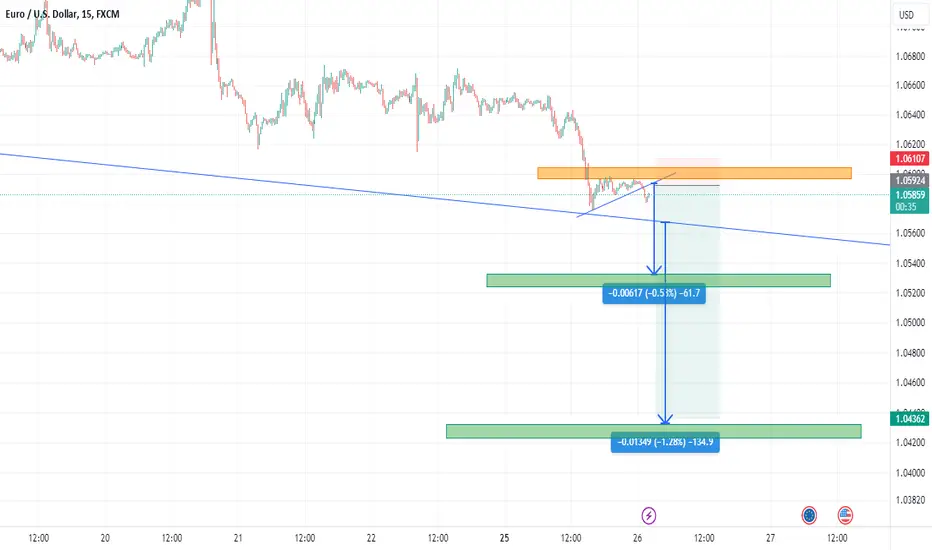
EURUSD dropping as expected. New supply levelsThe EURUSD is dropping as expected with the strong daily supply level in control. Expecting new lows in the following hours. You can use smaller timeframe intraday Forex strategies to take advantage of it.
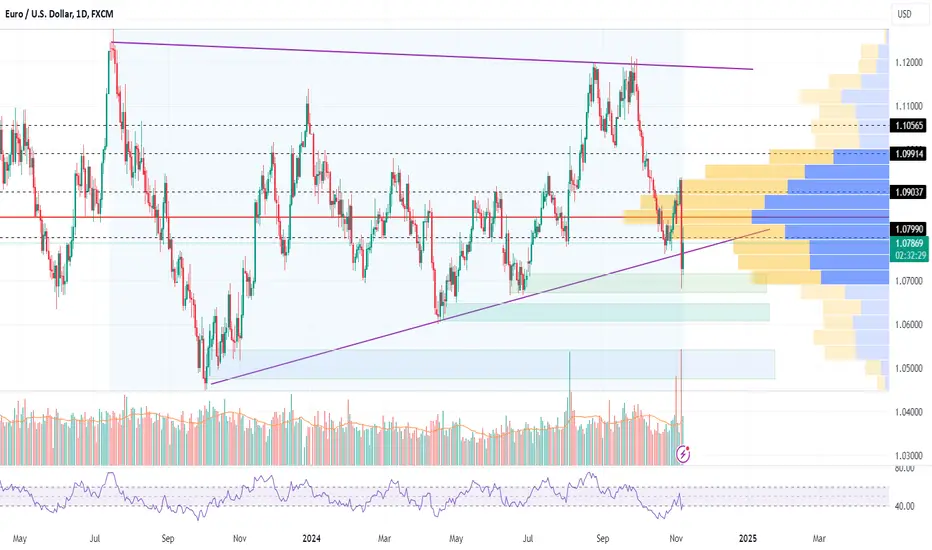
EUR/USD Daily AnalysisThe EUR/USD currency pair appears to be consolidating within a large, slightly narrowing symmetrical triangle pattern that has been forming over the past year. Key observations:
1.Support and Resistance:
The pair recently tested support near the lower boundary of the triangle (around the 1.0700 area), which aligns with a long-term uptrend line, creating a potential zone of support.
Resistance is seen at the upper boundary of the triangle, currently around the 1.1200 level, marking an area to watch for potential breakout attempts.
2.Volume Profile:
The Volume Profile visible range highlights significant buying and selling interest around the 1.0799 to 1.0903 levels, suggesting this zone could act as a magnet for price action in the near term.
3.Key Levels:
A break above the 1.0903 level could lead to a test of the next resistance at 1.1056.
On the downside, if the pair falls below the recent swing low near 1.0700, it may open up further downside potential toward lower support zones around 1.0500.
4.Indicators:
RSI is currently rebounding from oversold levels, indicating some bullish momentum in the short term. However, watch for a shift if RSI approaches the overbought territory.
5.Price Action:
The recent bounce from support with increased volume may indicate renewed buying interest, but a breakout beyond the triangle boundaries will likely provide a clearer direction.
This setup suggests that EUR/USD may see increased volatility as it approaches the apex of the triangle.
Outlook: T raders should be cautious and watch for a confirmed breakout beyond the triangle's boundaries for clearer directional cues. Bulls will look for a breakout above 1.0903 to target higher levels, while bears may aim for support zones below 1.0700 in case of a downside break.
Euro can make movement up and then continue to declineHello traders, I want share with you my opinion about Euro. Looking at the chart, we can see how the price some time ago entered to wedge, where it rebounded from the support line and rose to the resistance line, which is located in the support zone. After this, the price turned around from the resistance line made a correction to the support line, and then made an impulse up. Euro broke the 1.1010 level, after which it exited from the wedge and started to trades inside range. Inside range, EUR at once rose to the seller zone, but soon turned around and started to decline, making a fake breakout of the resistance level. In a short time later, the price tried to grow, but turned around and made a correction to the support level, after which made an upward impulse to the 1.1175 resistance level. Euro some time traded near this level and not a long time ago started to decline. Therefore I think that the price can make movement up and then continue to decline to the support level, which coincides with the bottom part of the range. For this case, I set my TP at 1.1010 support level. Please share this idea with your friends and click Boost 🚀

ETHUSDT (June 22)Hello my friends.
Ethereum is approaching the bottom of the long-term channel from where it can move towards the historical price ceiling

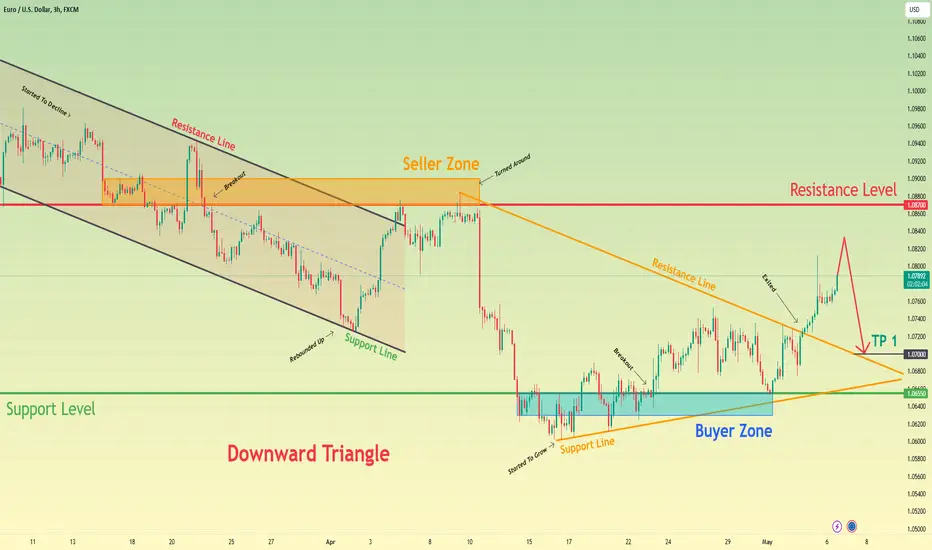
Euro can make small move up, turn around and start to declineHello traders, I want share with you my opinion about Euro. Looking at the chart, we can see how the price some days ago started to trades inside the downward channel, where it at once rebounded from the support line and then started to decline. In a short time price fell to the resistance level, which coincided with the seller zone, some time traded near and then broke the 1.0870 level and continued to decline. Later price fell to the support line of the channel and then made an impulse up to the resistance level, thereby exiting from the channel and some time trading near the 1.0870 level. After this, the Euro entered to seller zone, where it turned around and started to trades in a triangle. In this pattern, the price fell to the support line from the resistance line, breaking the 1.0655 support level, which coincided with the buyer zone, but in a short time later, the EUR broke this level again and continued to grow. Soon, the price reached a resistance line and broke it, exiting from the triangle pattern, and at the moment, the Euro continues to rise. I think that the price can rise a little and then the Euro will decline to support line, therefore I set my target at 1.0700 points. Please share this idea with your friends and click Boost 🚀
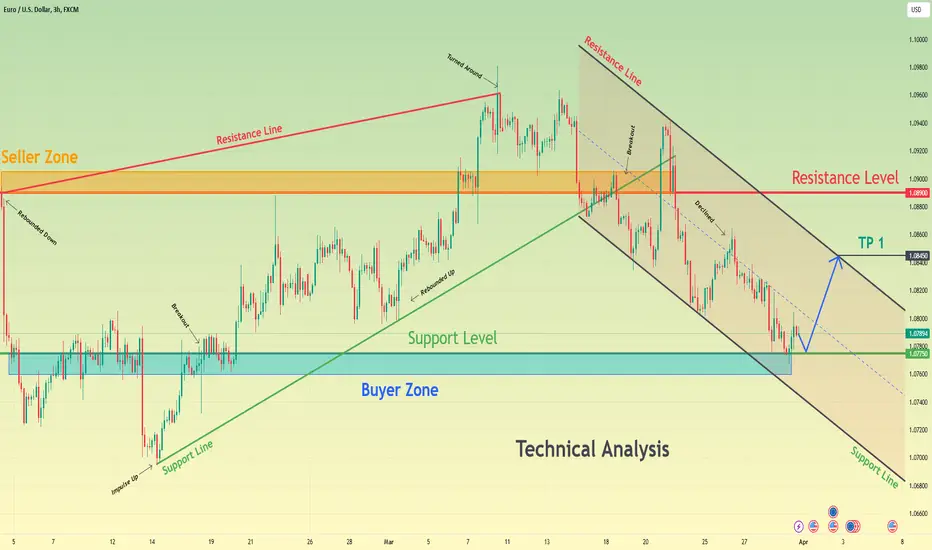
Euro can bounce up of support level to 1.0845 points in channelHello traders, I want share with you my opinion about Euro. Some days ago price rebounded from the resistance line, which is located in the seller zone, and in a short time declined to the 1.0775 level, which coincided with the buyer zone, thereby breaking the 1.0890 level. After this, the EUR soon declined to the support line, breaking the support level too, but then the price turned around and started to rise. In a short time, the Euro reached a support level, broke it one more time, and continued to move up. After this, the price made a correction to the support line and then rebounded and made a strong impulse up to the resistance line, thereby breaking the 1.0890 level. But soon, the EUR turned around and soon declined to this level and even broke it again. As well then, the price continued to decline in a downward channel, where the Euro broke the support line too and later fell to the 1.0775 support level. But a not long time ago price rebounded and started to rise, so, I think that the Euro can rebound from the support level to the resistance line of the downward channel. For this case, I set my target at 1.0845 points. Please share this idea with your friends and click Boost 🚀
eurusd sell longEUR/USD targets 1.1000 on weaker Dollar post-Payrolls
EUR/USD picks up extra upside traction and opens the door to a potential test of the psychologial 1.1000 hurdle on the back of increased selling pressure in the Greenback following February's Non-farm Payrolls (+275K).
1.0960 (Fibonacci 61.8% retracement of the latest downtrend) aligns as first resistance for EUR/USD ahead of 1.1000 (psychological level, static level) and 1.1035 (Fibonacci 78.6% retracement).
EUR/USD is the forex ticker that tells traders how many US Dollars are needed to buy a Euro. The Euro-Dollar pair is popular with traders because its constituents represent the two largest and most influential economies in the world. Follow real-time EUR/USD rates and improve your technical analysis with the interactive chart. Discover the factors that can influence the EUR/USD forecast and stay up to date with the latest EUR/USD news and analysis articles.
confirm signal

EURUSD Long Term Sell Trading IdeaHello Traders
In This Chart EURUSD DAILY Forex Forecast By FOREX PLANET
today EURUSD analysis 👆
🟢This Chart includes_ (EURUSD market update)
🟢What is The Next Opportunity on EURUAD Market
🟢how to Enter to the Valid Entry With Assurance Profit
This CHART is For Trader's that Want to Improve Their Technical Analysis Skills and Their Trading By Understanding How To Analyze The Market Using Multiple Timeframes and Understanding The Bigger Picture on the Charts
Euro can exit from wedge, make retest and continue to riseHello traders, I want share with you my opinion about Euro. By observing the chart, we can see that the price some days ago rebounded from the resistance level, which coincided with the seller zone and declined until to 1.0725 points, thereby breaking the support level. But soon, the price turned around and made a strong upward impulse to the seller zone, breaking the 1.0820 support level one more time. After this, the Euro started to trades in a downward wedge, where later it made a correction from the seller zone to the support line. Then price bounced from this line and made an upward impulse to the resistance line of the wedge, breaking the 1.0980 resistance level, but in a short time, EUR bounced from this line and started to decline. Euro fell lower than the 1.0980 resistance level, breaking it again, and then some time traded near this level, after which the price declined lower. Price fell to the support line of the wedge, which coincided with the support level with the buyer zone, and then rebounded up to the resistance line. Now Euro trades near this line and in my mind, the Euro can decline a little more and then bounce up to the resistance line. Next, EUR will break this line, exiting from the wedge, make retest, and then it can continue to move up. So, that's why I set take profit at the 1.0930 level. Please share this idea with your friends and click Boost 🚀

The market is bearish and looks good to analysteruusd looks very bearish and looks good to take a good position follow for more
EURUSD Long Term Trading Idea
Hello Traders
In This Chart EURUSD HOURLY Forex Forecast By FOREX PLANET
today EURUSD analysis 👆
🟢This Chart includes_ (EURUSD market update)
🟢What is The Next Opportunity on EURUAD Market
🟢how to Enter to the Valid Entry With Assurance Profit
This CHART is For Trader's that Want to Improve Their Technical Analysis Skills and Their Trading By Understanding How To Analyze The Market Using Multiple Timeframes and Understanding The Bigger Picture on the Charts
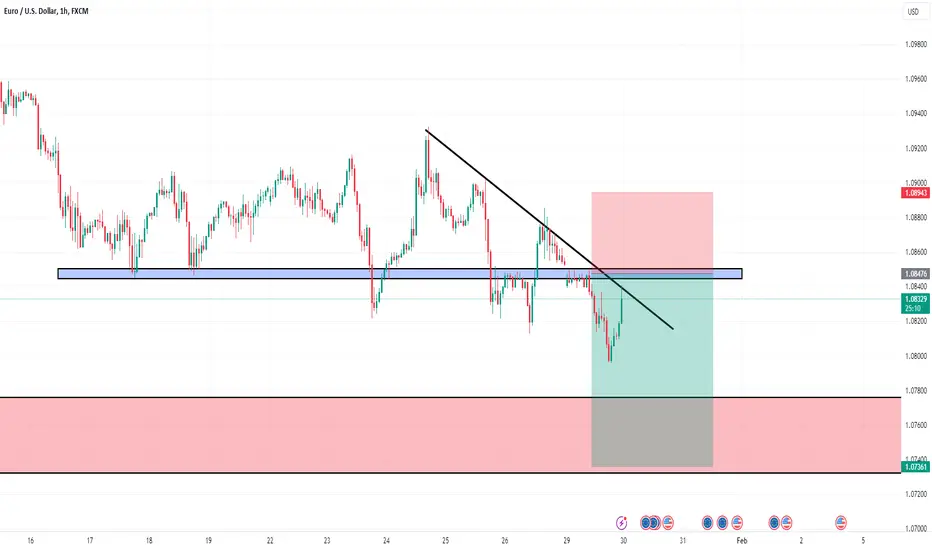
EURUSD NFP, it was all already written!I observed on the EUR/USD chart how the post-NFP decline was anticipated, as the price bounced precisely off a support zone before and turned into resistance afterward. As the price went down, it broke the swing low at the 1.0782 level, effectively setting the stage for a potential long entry on Monday at the London or New York opening. I remember that this strategy involves entries at two very specific times and, as confirmation, foresees a structural upward shift, in this case, on the M15 chart.
Nonetheless, I'm truly impressed by how everything played out exactly as I had predicted. Please comment and leave a like to support my work. Happy trading, and have a great weekend, everyone!

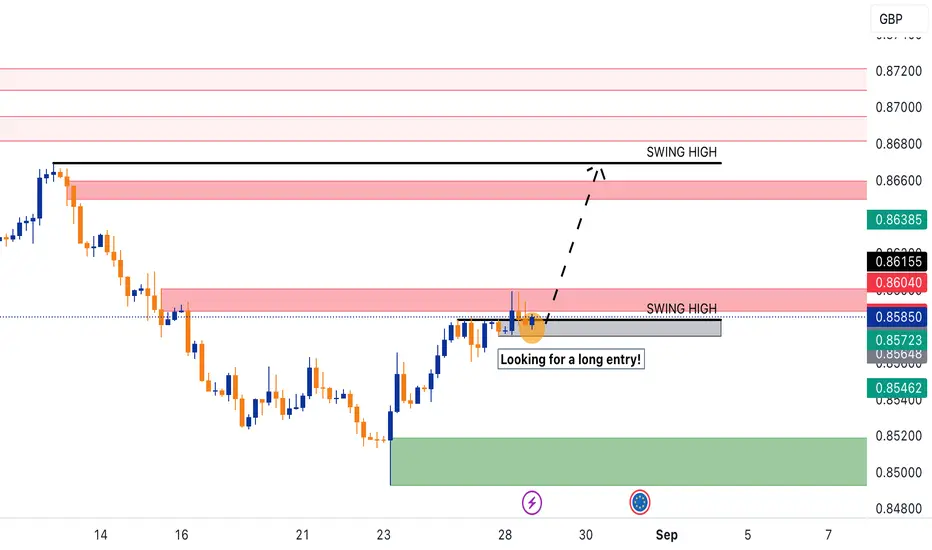
EURGBP Looking for a Long entry!In the EURGBP pair, we have a long setup where the price has broken a previous swing high at the level of 0.8585. The price then retraced within the last bearish candle on the H4 timeframe, which led to the breakout of the swing high. In this area, I'm looking for a bullish entry if the market on the M5 timeframe shows signs of a bullish structure, namely forming higher highs and higher lows. Of course, the stop loss, in case of a long entry, will be positioned around 0.8550, and the target will be the level of the previous swing high at 0.8660.
GBPAUD Two possible Long entries!On GBPAUD, I've identified an interesting long setup. The price could potentially move from 1.9780 to 2.02 without apparent obstacles. My idea is to open a long position on this currency pair. Currently, the price is in a zone that we could define as "hot," as it's situated between a demand zone and a supply zone.
Within this same zone, the market has generated an Optimal Entry Point (POI), which I've identified through confirmation from candlestick charts on the 1-hour and 15-minute timeframes, along with the Volume Profile Point of Control. This signal further strengthens the hypothesis of a long entry.
In addition to the opportunity described above, thanks to my "Forex48 block" strategy, I've identified another possible entry area for a long trade, positioned at the level of 1.9690.
I'd be interested to know your opinion on this situation. I invite you to comment and leave a like to support our work. Warm regards from me, Nicola, CEO of Forex48 Trading Academy.

#EURUSD | BUY☑️Broke the structure on the 4H timeframe
☑️Broke the structure on the 1H timeframe (confirmation) - NO
If we break the market structure down on the 4H timeframe, the analysis becomes invalid🙅♂️
Good luck 🙌💪

EURUSD 5 MIN SMOLL TIME GOOD EUR USDAs an AI language model, I don't have real-time data or access to external platforms like TradingView. However, I can provide you with a general description of how you might write a short description for a EUR/USD trade on a 5-minute timeframe based on hypothetical information.
Title: EUR/USD - Short Position on 5-Minute Timeframe
Description:
In this trade, we are considering a short position on the EUR/USD currency pair using a 5-minute timeframe. The rationale behind this decision is based on technical analysis indicators and market observations.
Key Points:
1. Timeframe: 5-minute
2. Currency Pair: EUR/USD
3. Position: Short
4. Trade Date: July 4th, 2023
Reasoning:
Provide a brief explanation of the analysis that led to the decision to take a short position. This could include technical indicators such as moving averages, trendlines, support and resistance levels, or other factors like news events or market sentiment.
Target and Stop Loss:
Specify the target price level where you plan to exit the trade if it moves in your favor, as well as the stop-loss level that will protect your position in case the trade goes against you.
Risk Management:
Mention any risk management strategies or considerations you have in place, such as position sizing, risk-reward ratio, or trailing stops.
Disclaimer:
Include a standard disclaimer stating that this description is for informational purposes only and should not be considered as financial advice. Encourage users to conduct their own analysis and consult with a qualified financial professional before making any investment decisions.
Remember, it's crucial to conduct thorough research and analysis, and consult with a professional or utilize a trusted trading platform for real-time data and accurate market information.
EURUSD: SAME PATTERN?Hi guys,
this is my view looking at the weakness of USD in the global market.
Let's see if Dollar can push the change rate higher than this.

EURUSD 4H EURUSD
stabilizing above 1.0743 will support rising to touch 1.0783 then 1.0814 then 1.0843
stabilizing under 1.0746 will support falling to touch 1.07090 the 1.0690
the condition is closing 4h candle
Pivot Price: 1.0743
Resistance prices: 1.0783 & 1.0144 & 1.0843
Support prices: 1.0709 & 1.0690 & 1.0662
Tendency: consolidate

EURUSD 4HEURUSD
The EURUSD can stay at the bearish trend as we mentioned in the previous idea
but otherwise stabilizing above 1.07090 then will try to get 1.07437
Pivot Price: 1.0743
Resistance prices: 1.07837 & 1.08468 & 1.08922
Support prices: 1.06684 & 1.06349 & 1.06170
timeframe 4H

EURUSD 4HEURUSD
The EURUSD can stay at the bearish trend as we mentioned in the previous idea
but otherwise stabilizing above 1.08144 then will try to get 1.09244
Pivot Price: 1.0743
Resistance prices: 1.07956 & 1.08468 & 1.09244
Support prices: 1.06925 & 1.06541 & 1.06175

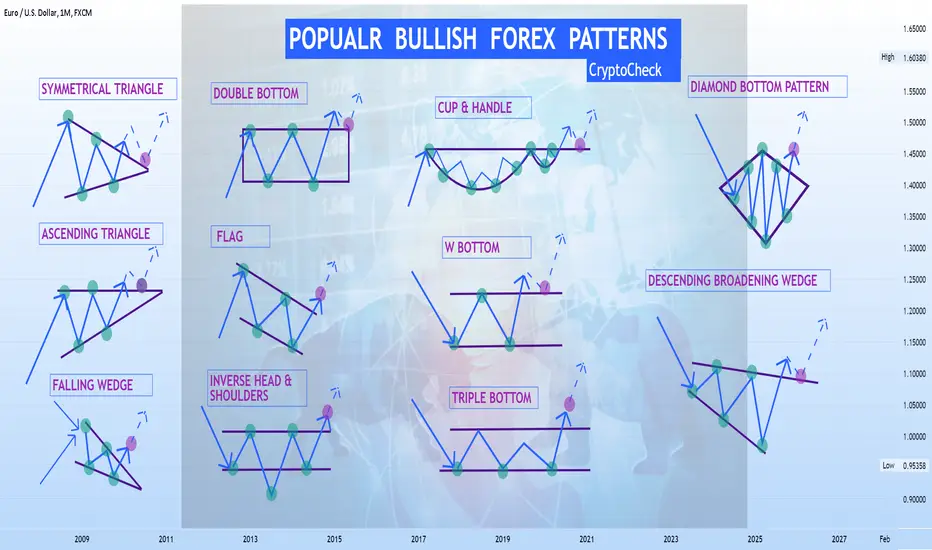
Easy-to-Spot Bullish Forex PatternsHi Traders, Investors and Speculators 📈📉
Ev here. Been trading crypto since 2017 and later got into stocks. I have 3 board exams on financial markets and studied economics from a top tier university for a year. Daytime job - Math Teacher. 👩🏫
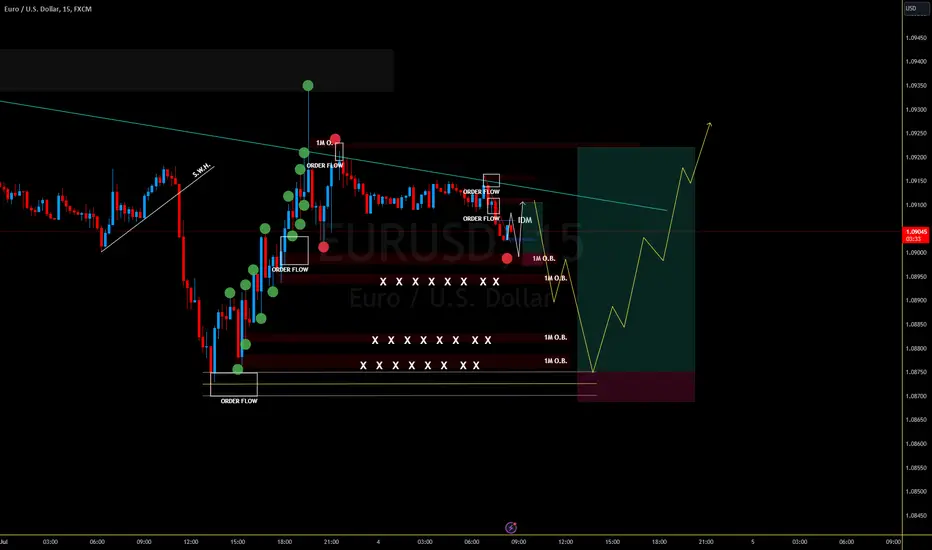
For the biggest part, I prefer to trade reactive rather than predictive. Chart patterns really come in handy with this strategy. Here are my top easy to spot chart patterns, specifically focused on bullish chart patterns today. The green highlight dots are to help identify the margins of the pattern and the purple highlighted dot is where a long entry can be taken.
While you're here 👀 See this related idea on EURUSD from the monthly timeframe:
_______________________
📢Follow us here on TradingView for daily updates and trade ideas on crypto , stocks and commodities 💎Hit like & Follow 👍
We thank you for your support !
CryptoCheck