S&P 500 (ES1!): Short Term Sells For Longer Term Buys TargetsWelcome back to the Weekly Forex Forecast for the week of Sept 1 - 5th.
In this video, we will analyze the following FX market: S&P 500 (ES1!)
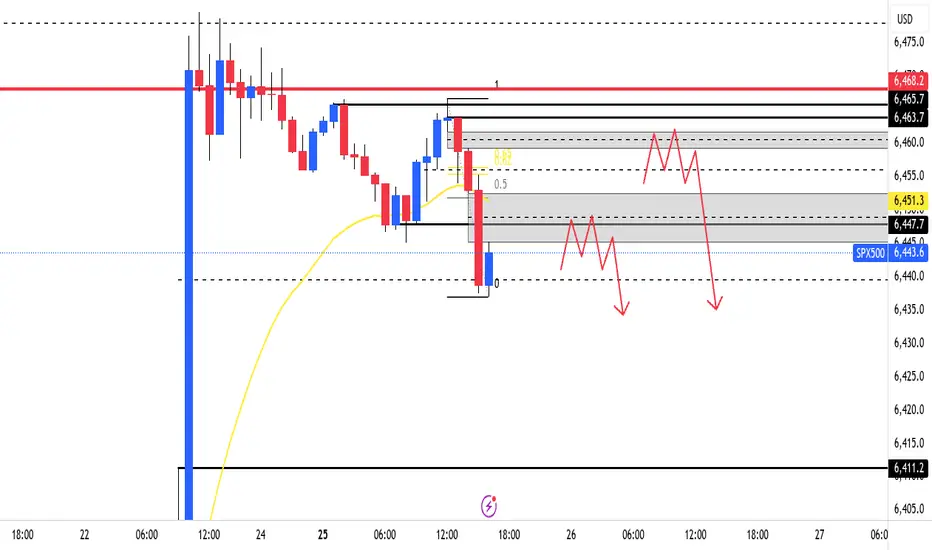
The S&P500 has been strong, but gave a bearish close on Friday. Looking at the Daily, it is easy to see price is retracing lower, perhaps to the +FVG, which is a great place to look for longs once contacted.
Short term sells are permissible, but be mindful the HTFs are bullish.
Enjoy!
May profits be upon you.
Leave any questions or comments in the comment section.
I appreciate any feedback from my viewers!
Like and/or subscribe if you want more accurate analysis.
Thank you so much!
Disclaimer:
I do not provide personal investment advice and I am not a qualified licensed investment advisor.
All information found here, including any ideas, opinions, views, predictions, forecasts, commentaries, suggestions, expressed or implied herein, are for informational, entertainment or educational purposes only and should not be construed as personal investment advice. While the information provided is believed to be accurate, it may include errors or inaccuracies.
I will not and cannot be held liable for any actions you take as a result of anything you read here.
Conduct your own due diligence, or consult a licensed financial advisor or broker before making any and all investment decisions. Any investments, trades, speculations, or decisions made on the basis of any information found on this channel, expressed or implied herein, are committed at your own risk, financial or otherwise.
Es1

E mini Nasdaq 100. Weekly Outlook. September 01, 2025CME_MINI:NQ1!
Expecting all out meltdown on Nasdaq. And the other two indexes. August was insane. But September will be extremely volatile

Day 19 — Trading Only S&P Futures | Lessons From a Red DayWelcome to Day 19 of Trading Only S&P Futures!
Not every day is green — today I finished -630.
I’ve realized something important: my trading performance may be tied directly to my routine and supplements. Since I injured my back, I’ve been on painkillers and haven’t taken my usual supplement stack. Today I felt distracted, unfocused, and off my game — even though the setups were there, I just couldn’t execute with clarity.
It’s a reminder that trading isn’t just charts and signals — your health, focus, and routines matter just as much as strategy.
📰 News Highlights
U.S. Q2 GDP RISES +3.3%, EST. +3.0%; PREV. -0.5%
🔑 Key Levels for Tomorrow
Above 6485 = Remain Bullish
Below 6460 = Flip Bearish

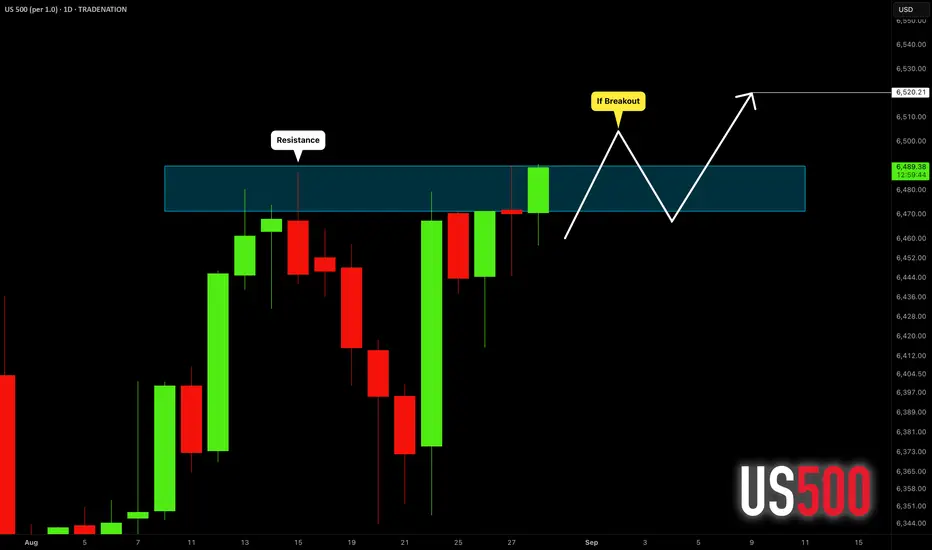
S&P500 INDEX (US500): To the New Highs?!
US500 is going to break a resistance based on a current all-time high.
A daily candle close above the underlined structure will provide a confirmation.
A bullish continuation will be expected at least to 6520 then.
❤️Please, support my work with like, thank you!❤️
I am part of Trade Nation's Influencer program and receive a monthly fee for using their TradingView charts in my analysis.
Day 18 — Trading Only S&P Futures | NVDA Miss, Market DropsWelcome to Day 18 of Trading Only S&P Futures!
Today started with heavy sell signals — we had X10 chip stock sell signals and NVDA X7 sell signal right at the open. I leaned short early but got stopped out around 10:20 as the market squeezed higher.
Instead of chasing longs into bullish structure, I waited for a cleaner level. When price tapped 6495 max resistance (gamma wall), I reloaded shorts. That patience paid off, and by the EU close I was sitting on +416.75 for the day.
The key lesson here? Even when structure flips bullish, respecting higher-level resistance zones can deliver high-reward trades.
📰 News Highlights
NVIDIA STOCK FALLS 3% AFTER DATA-CENTER SALES MISS FORECASTS, LACKLUSTER GUIDANCE
🔑 Key Levels for Tomorrow
Above 6445 = Remain Bullish
Below 6435 = Flip Bearish

Day 17 — Trading Only S&P Futures | A+ Setup, Done by 10AMWelcome to Day 17 of Trading Only S&P Futures!
Today was all about conviction. I spotted a rare A+ setup: X7 ES buy signals, bullish market structure, and a buy right at MOB support. That kind of alignment doesn’t happen often — so I sized up 3x my usual and went long.
The trade worked perfectly, and I wrapped up the day by 10AM with +295.37, making this the fastest finish to a session I’ve ever had in this challenge.
📰 News Highlights
STOCKS CLOSE HIGHER, VIX DIPS AS NVIDIA NASDAQ:NVDA EARNINGS LOOM
🔑 Key Levels for Tomorrow
Above 6450 = Remain Bullish
Below 6435 = Flip Bearish

Bulls and Bears zone for 08-26-2025It seems that traders were taking profit yesterday after Friday's huge move up.
Level to watch: 6452 --- 6454
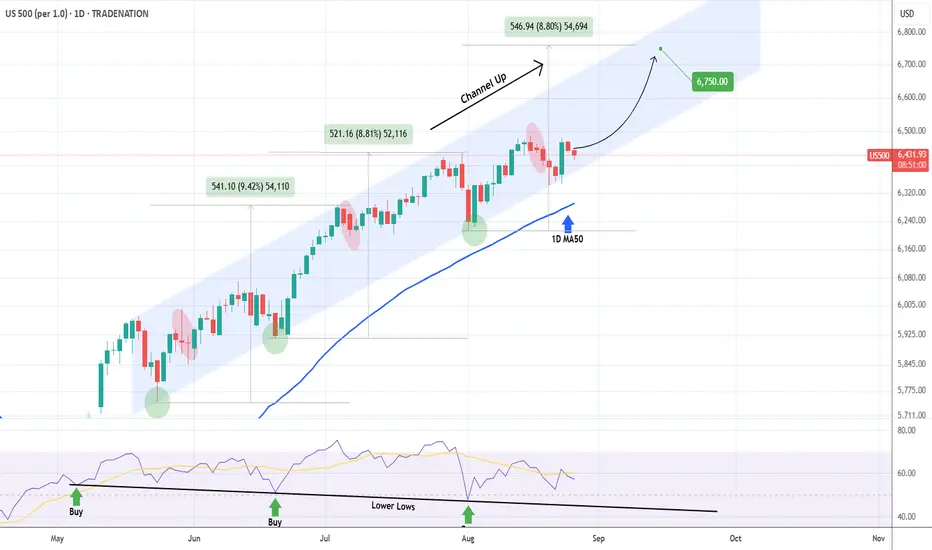
S&P500 3-month Channel Up still valid. Buy.The S&P500 index (SPX) kept its 3-month Channel Up intact last week despite a short-term correction as the price stopped exactly on its bottom (Higher Lows trend-line) and following Chair Powell's remarks on rate cut possibilities, it rebounded aggressively.
Given also that the 1D MA50 (blue trend-line) has been its long-term Support since May 01, the stage is set for the pattern's new Bullish Leg. With the last one being +8.80%, we expect the index to hit at least 6750 next.
-------------------------------------------------------------------------------
** Please LIKE 👍, FOLLOW ✅, SHARE 🙌 and COMMENT ✍ if you enjoy this idea! Also share your ideas and charts in the comments section below! This is best way to keep it relevant, support us, keep the content here free and allow the idea to reach as many people as possible. **
-------------------------------------------------------------------------------
Disclosure: I am part of Trade Nation's Influencer program and receive a monthly fee for using their TradingView charts in my analysis.
💸💸💸💸💸💸
👇 👇 👇 👇 👇 👇
Possible shorts incoming on ES (S&P 500)Price tapped a daily resistance, and the 1h is bearish. Shorts only with a confirmation
Day 16 — Trading Only S&P Futures | Rocky Start, Strong FinishWelcome to Day 16 of Trading Only S&P Futures!
Started the session following bullish structure while the market whipped up and down, which made it tricky to hold conviction early. Toward the end of the day, a short at 6482 finally gave clean follow-through, helping me turn a rocky start into a solid +296.25 finish.
The price action was choppy at times but still provided opportunities if you stayed patient.
🔑 Key Levels for Tomorrow
Above 6415 = Remain Bullish
Below 6405 = Flip Bearish

S&P 500: Bullish! Buy It!In this video, we will analyze the following FX market for the week of Aug 25 - 29th:
S&P 500 (ES1!)
The S&P 500 ended the week with strong bullish momentum, closing above the previous 3 days. The structure is bullish on the HTFs, and there is not good reason to look for sells.
Buy the bullish price action.
No sells until there is a definitive bearish break of market structure!
Enjoy!
May profits be upon you.
Leave any questions or comments in the comment section.
I appreciate any feedback from my viewers!
Like and/or subscribe if you want more accurate analysis.
Thank you so much!
Disclaimer:
I do not provide personal investment advice and I am not a qualified licensed investment advisor.
All information found here, including any ideas, opinions, views, predictions, forecasts, commentaries, suggestions, expressed or implied herein, are for informational, entertainment or educational purposes only and should not be construed as personal investment advice. While the information provided is believed to be accurate, it may include errors or inaccuracies.
I will not and cannot be held liable for any actions you take as a result of anything you read here.
Conduct your own due diligence, or consult a licensed financial advisor or broker before making any and all investment decisions. Any investments, trades, speculations, or decisions made on the basis of any information found on this channel, expressed or implied herein, are committed at your own risk, financial or otherwise.

Day 15 — Trading Only S&P Futures | +$121 Rate Cut RallyWelcome to Day 15 of Trading Only S&P Futures!
Running on only 3 hours of sleep, I knew today wasn’t the day to overtrade. With two major events at 10am and 12pm, I kept it simple — placed my basket orders, let the setups work, and went 2-for-2 green. Locked in +121.69 and wrapped it up by noon.
Sometimes the best edge is knowing when not to force trades.
📰 News Highlights
STOCKS SURGE TO END THE WEEK, VIX PLUNGES AFTER POWELL OPENS DOOR TO RATE CUT IN JACKSON HOLE
🔑 Key Levels for Tomorrow
Above 6415 = Remain Bullish
Below 6405 = Flip Bearish

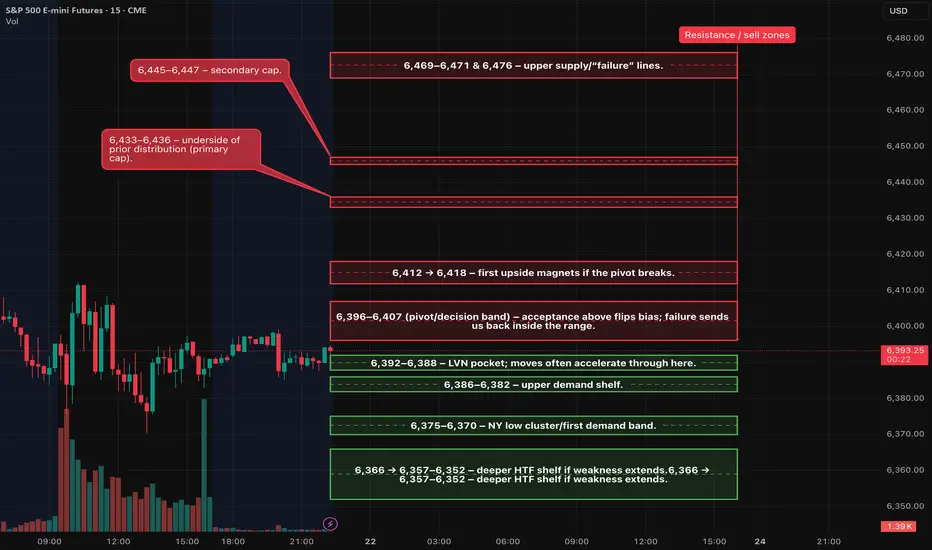
ES Futures — Plan for Fri, Aug 22 Intraday trend on 15m/30m remains down. The 6,396–6,407 band is the pivot/decision zone. Tomorrow’s session is dominated by Powell’s Jackson Hole keynote (10:00 ET) — plan around it.
Fundamentals & Risk Clock (ET)
• 10:00 — Fed Chair Powell speaks at the Jackson Hole Economic Policy Symposium. Treat this as the day’s primary catalyst; no new entries 09:55–10:05 per risk rules.  
• Otherwise, the U.S. calendar is relatively light vs. today’s prints; markets will key off the Powell tone and subsequent positioning.  
Structure Map (carry-forward levels)
Resistance / sell zones
• 6,396–6,407 (pivot/decision band) – acceptance above flips bias; failure sends us back inside the range.
• 6,412 → 6,418 – first upside magnets if the pivot breaks.
• 6,433–6,436 – underside of prior distribution (primary cap).
• 6,445–6,447 – secondary cap.
• 6,469–6,471 & 6,476 – upper supply/“failure” lines.
Support / buy zones
• 6,392–6,388 – LVN pocket; moves often accelerate through here.
• 6,386–6,382 – upper demand shelf.
• 6,375–6,370 – NY low cluster/first demand band.
• 6,366 → 6,357–6,352 – deeper HTF shelf if weakness extends.
Preferred Setup (A++): Range-Continuation Short
Take only with confirmation; score ≥9.
• Trigger: First 5-minute close ≤ 6,390.5 after a failed probe of 6,396–6,407, and the next bar fails to reclaim 6,392–6,394.
• Entry: 6,390.5 (MOS).
• Stop: 6,396.5 (≈6 pts).
• Targets:
• TP1: 6,375.5 (+15)
• TP2: 6,366.0 (+24)
• TP3: 6,358.0 (+32)
• Management: Scale ½ at TP1; move stop → BE only after a fresh 5m lower-low or a clean close through the TP1 zone. If no extension within 2×5m bars, cut to half/scratch.
• Disqualifiers: Thick support immediately stacks under entry or a 15m acceptance back above 6,396–6,407.
Flip Setup (A++ if accepted): Acceptance Long above Pivot
Counter-trend unless 15m turns; size accordingly.
• Trigger: First 5-minute close ≥ 6,407.5 and the next bar does not reclaim < 6,405.
• Entry: 6,407.5 (MOS).
• Stop: 6,401.5 (≈6 pts).
• Targets:
• TP1: 6,418.0 (+10.5 from trigger; acceptable given clean path)
• TP2: 6,435.0 (+27.5)
• TP3: trail toward 6,446+ if momentum persists.
• Disqualifier: Quick slip back < 6,405 after trigger.
Timing & Playbook
• Primary trade windows: 09:45–11:30 ET and 13:50–15:45 ET.
• Powell (10:00 ET): Plan around the speech; entries before the print must have exceptional quality, otherwise wait for post-event structure.
• MOC module (15:40–16:10 ET): Use the imbalance as a tiebreaker: modest (<$0.5B) = range; strong (≥$1B) can drive a directional push into the cross.
Day 14 — Trading Only S&P Futures | Powell Speech CautionWelcome to Day 14 of Trading Only S&P Futures!
Today was a major event day with Powell’s speech on deck, so I played it cautious. With the market under my posted levels and a lot of quick signal flips, I avoided rushing in. Instead, I waited for high-probability setups at major moving average levels and focused only on clean entries.
That patience paid off, wrapped up the day with +187.94 while avoiding traps in choppy conditions.
🔑 Key Levels for Tomorrow
Above 6435 = Flip Bullish
Below 6420 = Remain Bearish

S&P 500 (ES1!) : Time For A Pullback From The Highs?In this video, we will analyze the following FX market for the week of Aug 18 - 22nd:
S&P 500 (ES1!)
The S&P 500 hit ATHs again last week, but the last three trading days were narrow in range. Friday was a bearish close.
There is an untested Weekly and Monthly +FVG that price would potentially rebalance before going higher.
I believe this will be the draw on liquidity next week.
Enjoy!
May profits be upon you.
Leave any questions or comments in the comment section.
I appreciate any feedback from my viewers!
Like and/or subscribe if you want more accurate analysis.
Thank you so much!
Disclaimer:
I do not provide personal investment advice and I am not a qualified licensed investment advisor.
All information found here, including any ideas, opinions, views, predictions, forecasts, commentaries, suggestions, expressed or implied herein, are for informational, entertainment or educational purposes only and should not be construed as personal investment advice. While the information provided is believed to be accurate, it may include errors or inaccuracies.
I will not and cannot be held liable for any actions you take as a result of anything you read here.
Conduct your own due diligence, or consult a licensed financial advisor or broker before making any and all investment decisions. Any investments, trades, speculations, or decisions made on the basis of any information found on this channel, expressed or implied herein, are committed at your own risk, financial or otherwise.

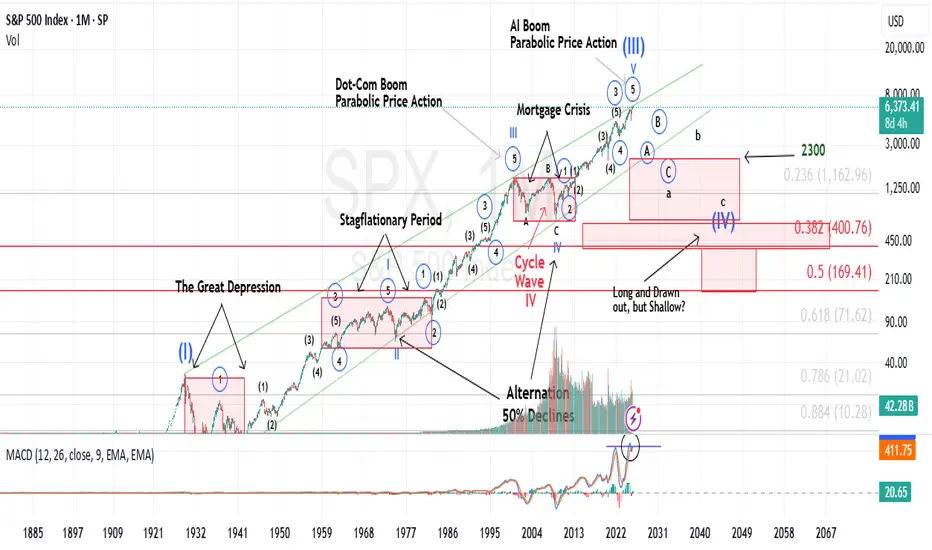
Are Longterm Interest Rates Telling Us Something?I rarely cite financial news in my market updates.
My reasoning is simple: all perspectives, bullish or bearish, are ultimately reflected in price action. That price action forms patterns, and those patterns can be analyzed to produce reasonable forecasts. After years of applying Elliott Wave theory, this approach has consistently stood the test of time.
That said, I’ll break from tradition today, as I believe the following excerpt is particularly relevant to my latest Trading View update. It comes from Barbara Kollmeyer’s article, “There’s a slow-motion crisis in bonds — and this bearish strategist thinks it will hit stocks.”
For context, I regularly track multiple market indices, futures contracts, single stocks, and notably, the yield on the 30-year U.S. Treasury Bond. For the past year, I’ve highlighted the counterintuitive rise in long-term yields that ironically began when the Fed started cutting its benchmark rate in September 2024. While brief divergences between long-term yields and Fed policy aren’t unusual, this persistent uptrend is different. The yield has been carving out a clear pattern of higher highs and higher lows, appearing now on the verge of a breakout—not just toward incremental new highs, but potentially into a runaway scenario for long-term rates.
This is why Albert Edwards’ recent comments caught my attention:
“There is a slow-motion crisis unfolding in the government bond markets that equity investors continue to ignore at their peril. The upward grind for long bond yields has been relentless, yet investors keep ignoring that to focus instead on more bullish metrics such as the latest reporting season driven by the mega-cap IT stocks, that promises a pot of gold at the end of the AI rainbow.”
His perspective resonated with me.
Having lived through the dot-com boom and bust, I recall how new technologies can fuel outsized market optimism. AI undoubtedly carries transformational potential, much like the Internet. But just as it took nearly two decades for the Internet to fully translate from speculative boom to tangible economic value, AI’s payoff will likely follow a similarly extended trajectory. It’s not an immediate catalyst.
What I am certain of is this: the cost of long-term money is rising, with implications far beyond bond charts. Higher yields directly affect mortgage rates and other long-term financing costs. More importantly, sustained upward pressure in long-term rates has the potential to weigh heavily on equities, broader markets, and asset valuations for far longer than many currently expect.
ES 08/21 — Key Levels - Short Bias - Setups - Fundamental Setups (A++ first)
1) SHORT — Retest-and-fail of supply (preferred)
• Zones: 6,433–36 or 6,445–47 (upper band 6,469–71).
• Trigger: 5-minute bearish close back below the shelf (no retest required); size to full only if a 15-minute bearish prints within the next 3×5m bars.
• Risk: entry +6–8 pts.
• TPs: +15 / +27 / +42 pts from entry (e.g., 6,445 → 6,430 / 6,418 / 6,403).
• Continuation guard: within 2×5m price must extend the low or print a lower high while failing to reclaim the shelf; otherwise cut ½ or scratch to BE.
2) SHORT — Breakdown & acceptance
• Trigger: 5m close < 6,418 and no immediate reclaim next bar.
• Risk: entry +6–8 pts.
• TPs: toward 6,406 → 6,392 → 6,382–76.
3) LONG — Only if promoted
• Trigger: 5m close & hold ≥ 6,436 (offers pull/flip; next bar holds).
• Risk: 6–8 pts (around 6,430).
• TPs: 6,451 → 6,459–60 → 6,471–72.
• Stand-down: lose 6,436 on a 5m close or see offers reload overhead.
Execution windows: 9:45–10:45 ET and 13:50–15:30 ET; avoid new risk 11:30–13:30 without momentum/confirmation.
Key levels (from HTF → LTF)
• Pivot / line-in-sand: 6,463 (short bias while ≤ this).
• Supply / sell zones: 6,433–36, 6,445–47, 6,469–71 (cap), 6,476.
• Supports / magnets: 6,419–18, 6,406–03, 6,392–88, 6,382–76, 6,370, 6,357–52.
Fundamentals — Thu, Aug 21, 2025 (ET)
• 08:30 — Weekly Initial Jobless Claims (DOL). Weekly claims are published Thursdays at 8:30 a.m. ET. 
• 08:30 — Philadelphia Fed Manufacturing Index (Aug). Next release Aug 21, 8:30 a.m. ET. 
• 10:00 — Existing Home Sales (July, NAR). NAR schedules the Jul report for Thu, Aug 21 at 10:00 a.m. ET. 
• 10:00 — Conference Board LEI (July). Thu, Aug 21, 10:00 a.m. ET.  
• 10:30 — EIA Weekly Natural Gas Storage. Standard release Thursdays 10:30 a.m. ET; next release Aug 21.  
• S&P Global Flash US PMI (Aug). Scheduled for Thursday (check S&P calendar; release times shown in UTC on their site). 
• Jackson Hole Economic Policy Symposium begins (Aug 21–23). 2025 theme: “Labor Markets in Transition.” 
How I’ll adapt intraday
• A stronger-than-expected Claims/PMI/Philly Fed that lifts yields and the USD into 6,433–36 / 6,445–47 favors setup #1 (fade the pop).
• EHS/LEI at 10:00 can whipsaw a breakdown—prefer acceptance before pressing setup #2.
• If Jackson Hole headlines skew risk-on and we accept ≥ 6,436, switch to setup #3 toward 6,451/60/71–72.
Day 13 — Trading Only S&P Futures | +$131 Relief BounceWelcome to Day 13 of Trading Only S&P Futures!
Today I thought we might get a relief rally after the market bounced off 6410. I took the 9:30 long signal but got stopped out as the market broke down further. Instead of forcing trades, I waited for cleaner setups and caught small bounces off 6388 and 6374.
When my second attempt at 6374 failed, I stayed patient. By 11:20 we finally got buy signals, plus confirmation with doji and BFC candles. That’s when I went long, rode the bounce, and wrapped up the day with +131.49.
Overall, a solid day where patience paid off.
📰 News Highlights
S&P 500 FALLS FOR A FOURTH DAY, NASDAQ POSTS BACK-TO-BACK LOSSES AS TECH SHARES EXTEND SLIDE
🔔 VX Algo Signals (9:30am – 2pm EST)
8:00 AM Market Structure flipped bearish on VX Algo X3!
9:30 AM VXAlgo NQ X3 Buy Signal
9:32 AM VXAlgo ES X3 Sell Signal
11:00 AM VXAlgo ES X1 Buy signal (double signal)
12:00 PM VXAlgo NQ X1DD Sell Signal
12:16 PM Market Structure flipped bullish on VX Algo X3!
1:40 PM VXAlgo NQ X1DD Buy Signal
🔑 Key Levels for Tomorrow
Above 6445 = Flip Bullish
Below 6430 = Remain Bearish

E mini Nasdaq 100. NYSE. 20.08.2025, WednesdayCME_MINI:NQU2025
Outlined the daily Institutional Order flow. And the Market Efficiency Paradigm

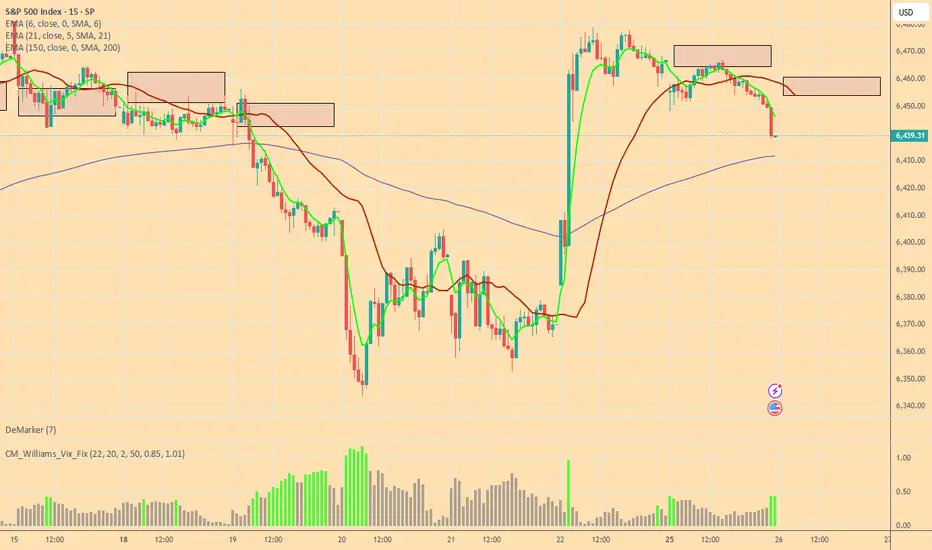
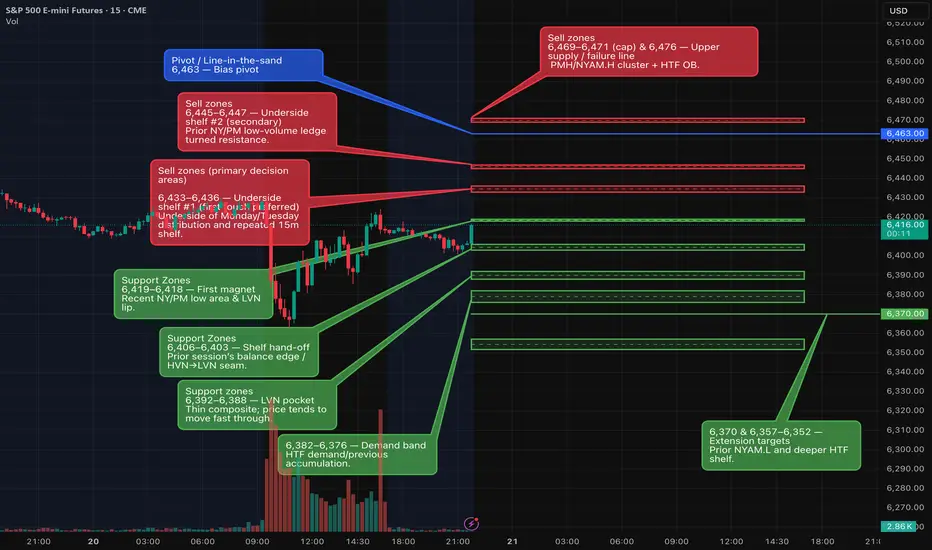
S 08/20 — Short bias below, Key Levels (watch FOMC minutes)Overview
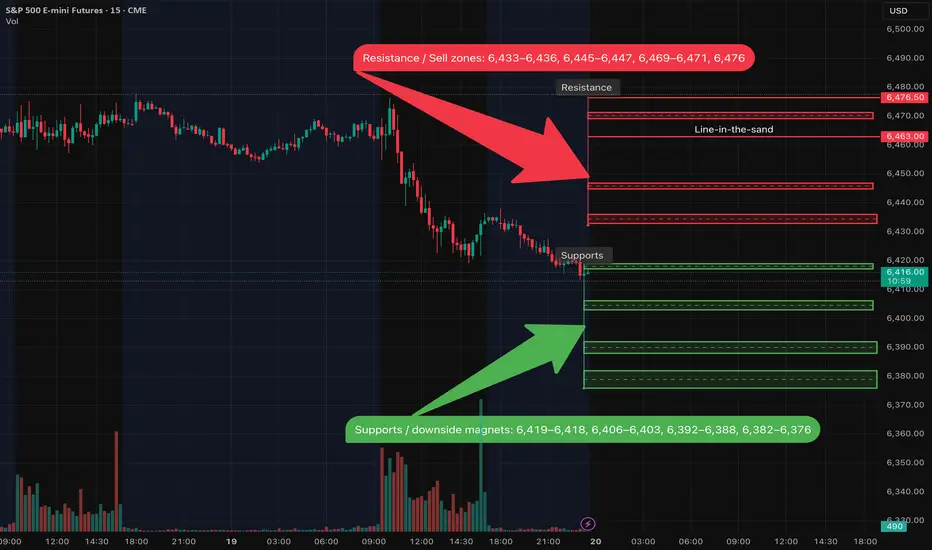
Higher-timeframe trend has shifted lower. After failing at ~6,476, price broke the 6,446 shelf and printed a new low near 6,419 with expanding volume. As long as we remain below 6,463, I keep a short bias and will fade bounces into supply.
Key Levels
• Line-in-the-sand: 6,463
• Resistance / Sell zones: 6,433–6,436, 6,445–6,447, 6,469–6,471, 6,476
• Supports / downside magnets: 6,419–6,418, 6,406–6,403, 6,392–6,388, 6,382–6,376
Primary Plan — Bearish continuation
• Prefer selling failed retests into 6,433–6,436 or 6,445–6,447.
• Targets: first back to 6,419–6,418, then 6,406–6,403, and if momentum persists 6,392–6,388 / 6,382–6,376.
• Confirmation I want to see: intraday rejection wicks at the zone, momentum rolling over, and sellers stepping back in.
Alternative — Breakdown
• If price accepts below 6,418, I’ll look for continuation toward 6,403, then 6,392 / 6,376.
Invalidation / Neutralization
• Reclaiming 6,463 neutralizes the immediate short bias.
• Acceptance ≥ 6,471–6,476 opens squeeze risk toward 6,491 / 6,500; I’d stand aside on shorts until structure turns back down.
Event Risk (ET) — Wed 08/20
• 07:00 MBA Mortgage Applications
• 10:30 EIA Weekly Petroleum Status Report
• 13:00 U.S. 20-Year Treasury Auction
• 14:00 FOMC Minutes (Jul meeting)
Note: Expect headline-driven volatility around 14:00—I avoid initiating new positions into the release.
Posting Notes
This idea reflects levels visible on 1D/4H/1H (with 30m/15m for execution). I’ll update intraday if acceptance/rejection flips at the zones.
Day 12 — Trading Only S&P Futures | Big Loss LessonWelcome to Day 12 of Trading Only S&P Futures!
Today was a tough one. I started off leaning bearish after NVDA flashed a strong sell signal — chips usually lead the market — so I went in heavy shorting 6461. Got stopped out at 6471 for a big hit, and of course right after, the market flushed under 6450.
Tried again, but with poor entries, I was quickly down -592 on the day. At that point, I reminded myself of one thing: live to fight another day. Instead of forcing it, I scaled back, waited for cleaner setups, and clawed some of it back to finish at -295.
🔔 VX Algo Signals (9:30am – 2pm EST)
9:30 AM Market Structure flipped bearish on VX Algo X3!
9:42 AM VXAlgo NVDA X7 Sell Signal
10:30 AM Market Structure flipped bullish on VX Algo X3!
11:00 AM Market Structure flipped bearish on VX Algo X3!
11:20 AM VXAlgo ES X1 Buy signal
12:10 PM VXAlgo NQ X1DD Sell Signal
1:20 PM VXAlgo ES X1 Buy signal (double buy)
🔑 Key Levels for Tomorrow
Above 6465 = Flip Bullish
Below 6455 = Remain Bearish

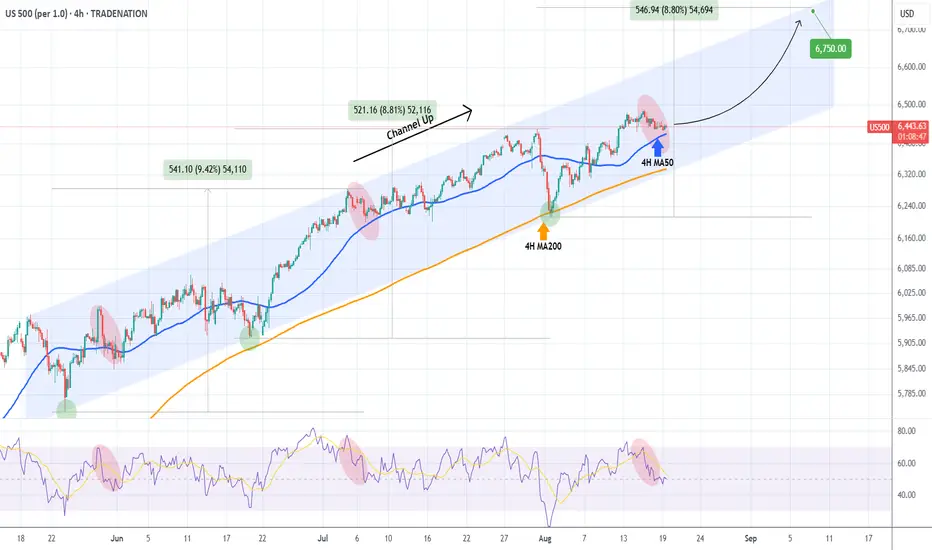
S&P500 Can the 4H MA50 save the day again?The S&P500 index (SPX) is on a short-term pull-back following the new All Time High (ATH) on August 15 of the 3-month Channel Up. It is just above the 4H MA50 (blue trend-line), which has been the most common level of Support throughout this pattern, before the 4H MA200 (orange trend-line), which formed its last Higher Low.
As a result, as long as it holds, it is more likely to see a continuation of the Bullish Leg that started on the 4H MA200 bounce (August 01). The previous Bullish Leg peaked on a +8.80% rise, so that gives us a medium-term Target of 6750.
-------------------------------------------------------------------------------
** Please LIKE 👍, FOLLOW ✅, SHARE 🙌 and COMMENT ✍ if you enjoy this idea! Also share your ideas and charts in the comments section below! This is best way to keep it relevant, support us, keep the content here free and allow the idea to reach as many people as possible. **
-------------------------------------------------------------------------------
Disclosure: I am part of Trade Nation's Influencer program and receive a monthly fee for using their TradingView charts in my analysis.
💸💸💸💸💸💸
👇 👇 👇 👇 👇 👇
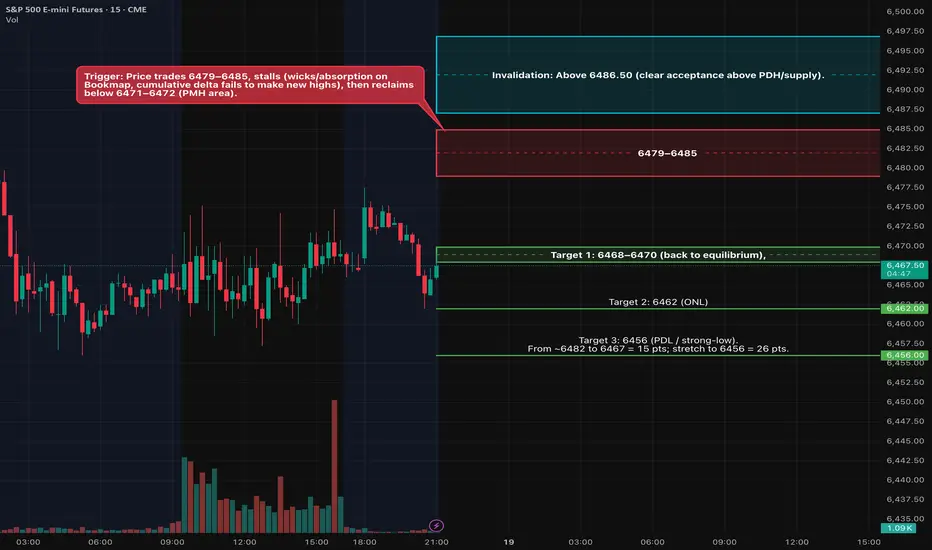
ES Analyses 08/19 Rejection short from 6479–6485 (OB + PDH)Fundamentals (what can move ES)
• 08:30 ET – U.S. New Residential Construction (Housing Starts/Permits). First move risk right at the print; can nudge yields and risk appetite. We’ll let the initial spike settle and then act on the HTF levels below. 
⸻
Key levels from your charts
Numbers rounded to the quarter where needed.
• PDH: 6484.25
• PDL: 6456.00
• ONH: 6475.25
• ONL: 6462.00
• RTH VWAP (today): 6466.50
• PMH / Asia H cluster: 6470.5–6471.75
• 30-min supply / OB: 6479–6485 (overlaps PDH)
• Liquidity/defense zone (“strong low”/Mon swing): 6452–6456
Think of 6468–6472 as the intraday “equilibrium” band we’ve been ping-ponging around; acceptance away from this band is what should start the 15+ pt drive.
Context: We press into the 30-min supply shelf that capped NYPM today.
Trigger: Price trades 6479–6485, stalls (wicks/absorption on Bookmap, cumulative delta fails to make new highs), then reclaims below 6471–6472 (PMH area).
Entry style: Stop-market on the reclaim or limit into a micro pullback after the failed pop.
Invalidation: Above 6486.50 (clear acceptance above PDH/supply).
Targets:
6468–6470 (back to equilibrium),
6462 (ONL),
6456 (PDL / strong-low).
From ~6482 to 6467 = 15 pts; stretch to 6456 = 26 pts.
Order-flow tells: Offers replenish 6480–6485; iceberg/absorption on up-ticks; delta divergence into the level.
Timing
08:30 ET data: stand aside for the first 2–5 minutes; let the impulse show its hand, then look for our triggers.
Federal Reserve Bank of New York
NY AM window: 09:45–11:30 ET.
NY PM window: 13:30–15:30 ET (if morning doesn’t give clean structure).