S&P 500: Buyers Are Still In Control! Continue To Look For LongsWelcome back to the Weekly Forex Forecast for the week of July 21-25th.
In this video, we will analyze the following FX market:
S&P 500 (ES1!)
The Stock Indices are strong, and showing no signs of selling off. Buy it until there is a bearish BOS.
Enjoy!
May profits be upon you.
Leave any questions or comments in the comment section.
I appreciate any feedback from my viewers!
Like and/or subscribe if you want more accurate analysis.
Thank you so much!
Disclaimer:
I do not provide personal investment advice and I am not a qualified licensed investment advisor.
All information found here, including any ideas, opinions, views, predictions, forecasts, commentaries, suggestions, expressed or implied herein, are for informational, entertainment or educational purposes only and should not be construed as personal investment advice. While the information provided is believed to be accurate, it may include errors or inaccuracies.
I will not and cannot be held liable for any actions you take as a result of anything you read here.
Conduct your own due diligence, or consult a licensed financial advisor or broker before making any and all investment decisions. Any investments, trades, speculations, or decisions made on the basis of any information found on this channel, expressed or implied herein, are committed at your own risk, financial or otherwise.
S&P 500 E-Mini Futures

Emini Nasdaq 100. Daily Market Walkthrough. Entries & Exits. Explained in depth overview of NQ. What exactly my thought process was in a specific time window

DIYWallSt Trade Journal:$238 Lessons From Monthly Expiration07/18/25 Trade Journal, and ES_F Stock Market analysis
EOD accountability report: +238.75
Sleep: 5. hours
Overall health: Was working late last night and didn't get much sleep.
VX Algo System Signals from (9:30am to 2pm)
— 8:30 AM Market Structure flipped bullish on VX Algo X3!
— 10:30 AM Market Structure flipped bearish on VX Algo X3!
— 11:10 AM VXAlgo ES X1 Buy signal (didn't work that well)
— 12:10 PM VXAlgo NQ X1DD Sell Signal
— 12:19 PM Market Structure flipped bullish on VX Algo X3!
What’s are some news or takeaway from today? and What major news or event impacted the market today?
Today was monthly expiration for options and we got a lot of X7 Sell signals but structure was bullish so I tried to take a long at MOB and got burned. Flipped bearish and started shorting the rest of the day and ended up making money back.
News
*US STOCKS MOVE LOWER AFTER REPORT SAYS TRUMP PUSHES FOR 15-20% MINIMUM TARIFF ON ALL EU GOODS
What are the critical support levels to watch?
--> Above 6335= Bullish, Under 6315= Bearish
Video Recaps -->https://tradingview.sweetlogin.com/u/WallSt007/#published-charts

Trade Journal: Missed Morning Move & Trading Into New Highs07/17/25 Trade Journal, and ES_F Stock Market analysis
EOD accountability report: +447.50
Sleep: 5 hours
Overall health: My health ring is signaling that my body isn't well the last few days.
VX Algo System Signals from (9:30am to 2pm)
— 8:53 AM Market Structure flipped bullish on VX Algo X3!
— 12:17 PM VXAlgo ES X1 Sell Signal (triple sell signal)
— 1:12 PM VXAlgo ES X3 Sell Signal
— 1:40 PM VXAlgo NQ X1DD Buy Signal
What’s are some news or takeaway from today? and What major news or event impacted the market today?
Today was a bit of a rough trading day, I missed the morning move and was a bit hesitant to make trades.
Saw a lot of MM positioning high up around 6340s and wasn't sure where to get a good entry. Wanted to go in at the MOB but they never went down there.
Sell signals were not as effective today because MM wanted to make ATH but i couldn't figure out the reasoning.
News
S&P 500 ENDS AT A NEW RECORD HIGH, VIX FALLS AS STOCKS RALLY ON SOLID EARNINGS, STRONG ECONOMIC DATA
What are the critical support levels to watch?
--> Above 6300= Bullish, Under 6290= Bearish
Video Recaps -->https://tradingview.sweetlogin.com/u/WallSt007/#published-charts

SP500 ES Weekly Recap | ATH Deviation → Pullback or Powell Pump?Overview:
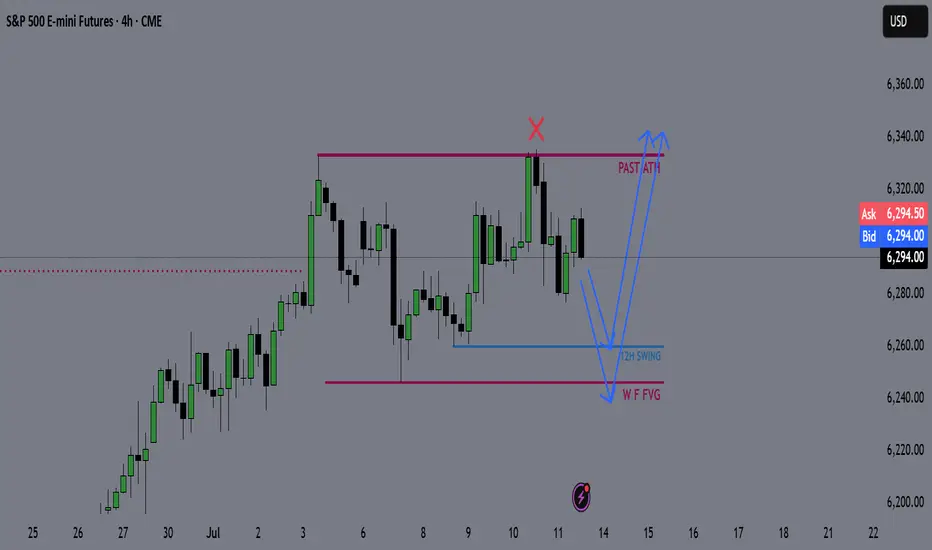
ES made a new all-time high last week, sweeping the previous high with strong momentum.
However, the move ended up being a deviation, and the price quickly reversed — suggesting short-term exhaustion.
Bearish Scenario (Baseline):
🔻 Rejection from ATH
🔻 Possible retracement targets:
12H Swing Low (turquoise line)
Weekly Fair Value Gap (purple zone)
I believe a pullback into those levels could provide bullish continuation setups for new highs. I’ll look for LTF confirmation once price reaches those zones.
Bullish Scenario (Catalyst-Driven):
🚨 If Fed Chair Powell resigns this week (a circulating macro rumor), the market may not wait for retracement.
This could lead to an aggressive breakout, driving ES and risk assets straight into new ATHs again.
Plan:
✅ Watch for LTF confirmation after pullback
✅ Stay open to both scenarios
✅ Focus on HTF bullish structure as long as key levels hold
DIYWallSt Trade Journal: How I Navigated Powell Firing Rumors & 07/16/25 Trade Journal, and ES_F Stock Market analysis
EOD accountability report: +428.75
Sleep: 7 hours
Overall health: Good
VX Algo System Signals from (9:30am to 2pm)
— 4:17 AM Market Structure flipped bullish
— 9:50 AM Market Structure flipped bearish
— 12:00 PM VXAlgo NQ X3 Buy Signal
— 1:02 PMMarket Structure flipped bullish
What’s are some news or takeaway from today? and What major news or event impacted the market today?
Today was a crazy trading day with a bunch of wild moves because Trump said they were going to fire Powell and then cancelled the threat.
Overall health and sleep have been good this week and our trading balance is reflecting that.
News
— 10:30 AM *SCOTT BESSENT: “FORMAL PROCESS” TO REPLACE FED CHAIR POWELL UNDERWAY
— 12:11 PM
*TRUMP ASKED IF HE WILL FIRE POWELL: NOT PLANNING ON DOING ANYTHING
What are the critical support levels to watch?
--> Above 6290= Bullish, Under 6280= Bearish
Video Recaps -->https://tradingview.sweetlogin.com/u/WallSt007/#published-charts

DIYWallSt Trade Journal: Perfect Morning Signals & Rate Cut bets07/15/25 Trade Journal, and ES_F Stock Market analysis
EOD accountability report: +404.50
Sleep: 7 hours
Overall health: Good
VX Algo System Signals from (9:30am to 2pm)
— 8:41 AM Market Structure flipped bullish on VX Algo X3!
— 9:33 AM VXAlgo ES X1 Sell Signal (triple sell)
— 9:40 AM Market Structure flipped bearish on VX Algo X3!
— 1:20 PM VXAlgo ES X1 Buy signal (triple buy)
What’s are some news or takeaway from today? and What major news or event impacted the market today?
We got great signals at the start of the day and that really helped with today's trading. I had some meetings today and stufff to take care of so i decided to lock out the funded account around noon and called a day.
News
— 9:54 AM
*TRADERS STICK TO BETS ON SEPTEMBER FED RATE CUT AFTER INFLATION REPORT
What are the critical support levels to watch?
--> Above 6295= Bullish, Under 6285= Bearish
Video Recaps -->https://tradingview.sweetlogin.com/u/WallSt007/#published-charts

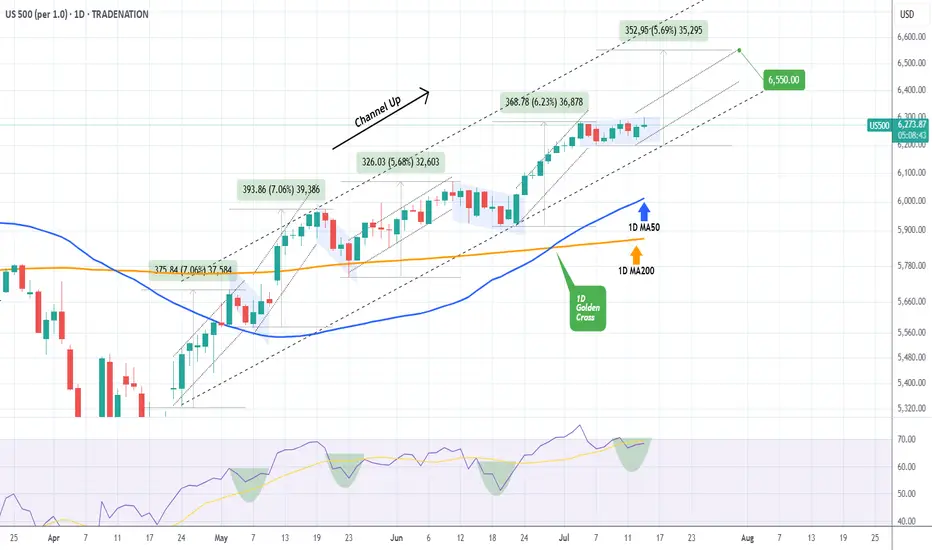
S&P500 Accumulation almost over. New rally begins.The S&P500 index (SPX) has been trading within a 3-month Channel Up pattern, within which, it's been replicating almost the same structure. This involves an aggressive Bullish Leg Phase (dotted Channel Up), followed by a correction/ Accumulation Phase (blue Channels), which eventually leads to the new Bullish Leg.
The 1D RSI fractals among those patterns are similar and right now it seems that we are about to complete the latest Accumulation Phase. Having completed a 1D Golden Cross 2 weeks ago, the time-frame looks more bullish than ever and as long as the 1D MA50 (blue trend-line) holds, we expect at least a +5.68% rise (the minimum of the previous Bullish Legs), targeting 6550.
-------------------------------------------------------------------------------
** Please LIKE 👍, FOLLOW ✅, SHARE 🙌 and COMMENT ✍ if you enjoy this idea! Also share your ideas and charts in the comments section below! This is best way to keep it relevant, support us, keep the content here free and allow the idea to reach as many people as possible. **
-------------------------------------------------------------------------------
Disclosure: I am part of Trade Nation's Influencer program and receive a monthly fee for using their TradingView charts in my analysis.
💸💸💸💸💸💸
👇 👇 👇 👇 👇 👇
Bulls and Bears zone for 07-15-2025ETH session market is trading higher and expected to Open gap up.
Would traders be able to keep that momentum going rest of the RTH session.
Level to watch: 6328 --- 6330
Market Watch UPDATES! Stock Indices, Gold, Silver, US OILWelcome to the Market Watch Updates for Monday, July 14th.
In this video, we will give the forecast updates for the following markets:
S&P500, NASDAQ, DOW JONES, GOLD, SILVER and US OIL.
Enjoy!
May profits be upon you.
Leave any questions or comments in the comment section.
I appreciate any feedback from my viewers!
Like and/or subscribe if you want more accurate analysis.
Thank you so much!
Disclaimer:
I do not provide personal investment advice and I am not a qualified licensed investment advisor.
All information found here, including any ideas, opinions, views, predictions, forecasts, commentaries, suggestions, expressed or implied herein, are for informational, entertainment or educational purposes only and should not be construed as personal investment advice. While the information provided is believed to be accurate, it may include errors or inaccuracies.
I will not and cannot be held liable for any actions you take as a result of anything you read here.
Conduct your own due diligence, or consult a licensed financial advisor or broker before making any and all investment decisions. Any investments, trades, speculations, or decisions made on the basis of any information found on this channel, expressed or implied herein, are committed at your own risk, financial or otherwise.

S&P 500: Time For A Pullback??
In this Weekly Market Forecast, we will analyze the S&P 500 for the week of July 14 - 18th.
The S&P 500 had a strong week, until Tariff Tensions Friday arrived.
This by itself doesn't mean we should start looking for sells. With Tuesday CPI Data coming, this short term consolidation is to be expected until the news is announced.
Let the markets pick a direction, and flow with it.
Have a plan of action in place so you can react to the price action promptly!
Enjoy!
May profits be upon you.
Leave any questions or comments in the comment section.
I appreciate any feedback from my viewers!
Like and/or subscribe if you want more accurate analysis.
Thank you so much!
Disclaimer:
I do not provide personal investment advice and I am not a qualified licensed investment advisor.
All information found here, including any ideas, opinions, views, predictions, forecasts, commentaries, suggestions, expressed or implied herein, are for informational, entertainment or educational purposes only and should not be construed as personal investment advice. While the information provided is believed to be accurate, it may include errors or inaccuracies.
I will not and cannot be held liable for any actions you take as a result of anything you read here.
Conduct your own due diligence, or consult a licensed financial advisor or broker before making any and all investment decisions. Any investments, trades, speculations, or decisions made on the basis of any information found on this channel, expressed or implied herein, are committed at your own risk, financial or otherwise.

Watch me trade NQ LIVE!This is a just a quick video showing what I look for in order to take a trade.
I entered a short on NQ minutes ago, looking for 2.44 RR!
Apologies for this rough cut video. It was spur of the moment, and I wanted to share with my followers and viewers!
Enjoy!
May profits be upon you.
Leave any questions or comments in the comment section.
I appreciate any feedback from my viewers!
Like and/or subscribe if you want more accurate analysis.
Thank you so much!
Disclaimer:
I do not provide personal investment advice and I am not a qualified licensed investment advisor.
All information found here, including any ideas, opinions, views, predictions, forecasts, commentaries, suggestions, expressed or implied herein, are for informational, entertainment or educational purposes only and should not be construed as personal investment advice. While the information provided is believed to be accurate, it may include errors or inaccuracies.
I will not and cannot be held liable for any actions you take as a result of anything you read here.
Conduct your own due diligence, or consult a licensed financial advisor or broker before making any and all investment decisions. Any investments, trades, speculations, or decisions made on the basis of any information found on this channel, expressed or implied herein, are committed at your own risk, financial or otherwise.

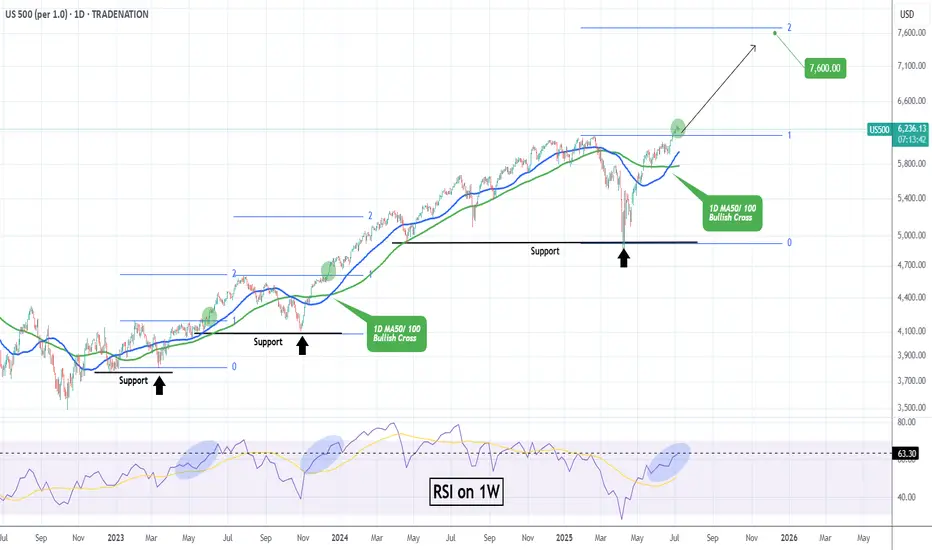
S&P500 Strong Buy Signal flashed for the 3rd time in 2 years!The S&500 index (SPX) is comfortably trading above its previous All Time High (ATH) and shows no signs of stopping here. Coming off a 1D MA50/ 100 Bullish Cross, we expect the 1D MA50 (blue trend-line) to turn now into the first long-term Support going towards the end of the year.
The last 1D MA50/ 100 Bullish Cross (December 15 2023) was nothing but a bullish continuation signal, which extended the uptrend all the way to the 2.0 Fibonacci extension, before a pull-back test of the 1D MA100 (green trend-line) again.
The 1W RSI is now on the same level (63.30) it was then. In fact it is also on the same level it was on June 05 2023, which was another such bullish continuation signal that peaked on the 2.0 Fib ext.
This suggests that we have a rare long-term Buy Signal in our hands, only the 3rd time in 2 years that has emerged. Based on that, we should be expecting to see 7600 as the next Target before it hits the 2.0 Fib ext and pulls back to the 1D MA100 again and there is certainly enough time to do this by the end of the year, assuming the macroeconomic environment favors (trade deals, potential Fed Rate cuts etc).
-------------------------------------------------------------------------------
** Please LIKE 👍, FOLLOW ✅, SHARE 🙌 and COMMENT ✍ if you enjoy this idea! Also share your ideas and charts in the comments section below! This is best way to keep it relevant, support us, keep the content here free and allow the idea to reach as many people as possible. **
-------------------------------------------------------------------------------
Disclosure: I am part of Trade Nation's Influencer program and receive a monthly fee for using their TradingView charts in my analysis.
💸💸💸💸💸💸
👇 👇 👇 👇 👇 👇
ES1! S&P500 Might Lose Momentum As Tariffs Deal Not Set...price could probably be testing all time highs. Before plunging....
if the volumes comes with it and reaches the all times high levels, that could be a nice short entry point for potential profits.
Otherwise, it could probably just fill the gap on week open and keep going down in a regular pattern until August as Trumps Tariffs Deals deadline is around that time possiblily...
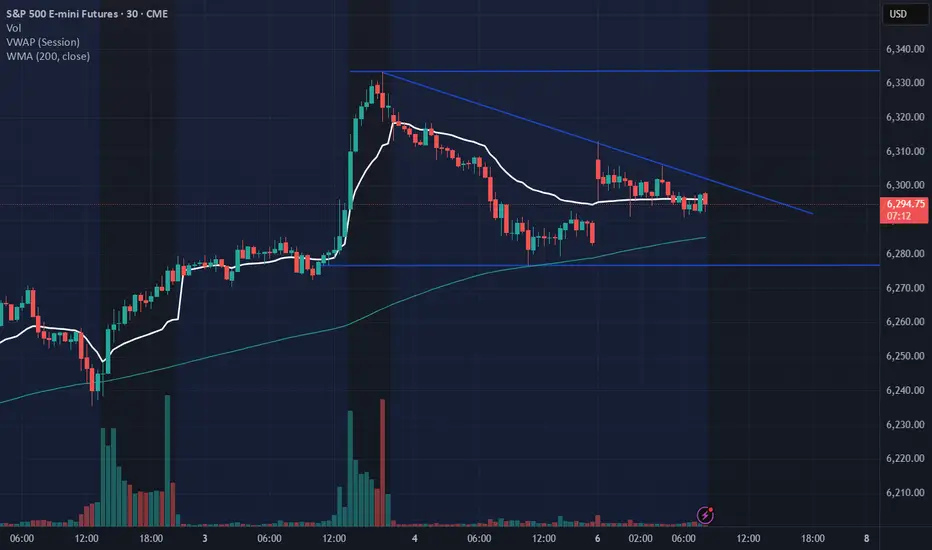
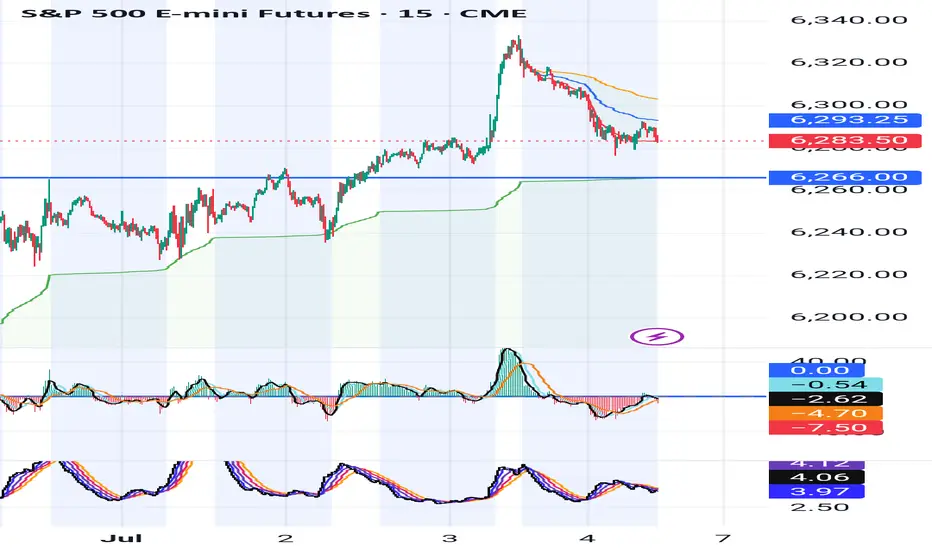
ES, SPY, SPX will be testing key support on Sunday After a welcome rally into new highs for the s&p, there appears to be a critical crossroad forming. Using the ES continuous contract I have placed 2 anchored VWAP's. The first being anchored to the last higher low on Thursday, June 19. And the the second, being anchored to this last Thursdays high on July 3rd.
For this post we will call the anchor from June 19 - VWAP1. And for the July 3rd anchor - VWAP2
VWAP1 r1 has acted as a key support line since the higher low was set. Successfully bouncing and holding support several times.
As we headed lower on this Thursdays July 3rd session, we remained between the center and r1 of VWAP2 indicating strong selling pressure for the day. With it being a shortened trading day with less liquidity however, I have less concern over the days price action. The forming crossroads and the upcoming Sundays open will be more telling for where we likely head this week.
The blue Horizontal Line at 6266 is placed directly on VWAP1s r1 (green line) which has acted as support. If we trade into this level on the Sunday open, it's a clear signal the sellers are still in control. If however, price can consolidate at that level (6266) and form structure, a breakout of the structure would be evidence of sellers backing off and buyers stepping in creating a good buying opportunity for the week.
Another possible scenario, if we first manage to trade up into s1 of VWAP2 (orange line) around the 6300 level, I will be looking for a short scalp down to the r1 of VWAP1 at 6266. From here it would be prudent to sit and wait for more confirmation on if this is a reversal, or just another pullback in the uptrend.
These are my two trade setups and ideas for Sunday's open. Hope this analysis helps. Happy trading 🤙💰📈
July 7 - 11: Buy Stock Indices DIPs! Watch For Gold, Oil FVGs!In this Weekly Market Forecast, we will analyze the S&P 500, NASDAQ, DOW JONES, Gold and Silver futures, for the week of July 7 - 11th.
Stock Indices are strong, so dip opportunities should present themselves next week.
Gold is bullish-neutral. Could see strength enter this market as July 9th approaches.
Silver is bullish. No reason to short it.
Oil is in a Monthly +FVG. If the FVG fails, it will confirm bearishness. Couple that with the fundamentals, I am watching for that confirmations to sell US Oil.
Enjoy!
May profits be upon you.
Leave any questions or comments in the comment section.
I appreciate any feedback from my viewers!
Like and/or subscribe if you want more accurate analysis.
Thank you so much!
Disclaimer:
I do not provide personal investment advice and I am not a qualified licensed investment advisor.
All information found here, including any ideas, opinions, views, predictions, forecasts, commentaries, suggestions, expressed or implied herein, are for informational, entertainment or educational purposes only and should not be construed as personal investment advice. While the information provided is believed to be accurate, it may include errors or inaccuracies.
I will not and cannot be held liable for any actions you take as a result of anything you read here.
Conduct your own due diligence, or consult a licensed financial advisor or broker before making any and all investment decisions. Any investments, trades, speculations, or decisions made on the basis of any information found on this channel, expressed or implied herein, are committed at your own risk, financial or otherwise.

Live Market Walkthrough Emini Nasdaq 100Outlined the orderflow distribution and trading All time highs

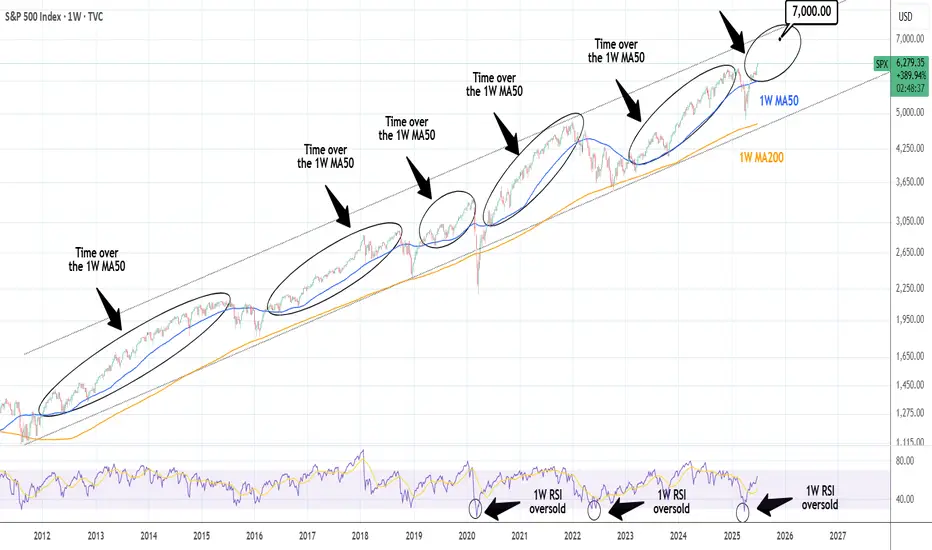
S&P500: Once it breaks the 1W MA50, it doesn't look back.S&P500 has turned overbought on its 1D technical outlook (RSI = 75.570, MACD = 96.940, ADX = 23.950) and rightly so as it is extending the rally after crossing above the 1W MA50. The Channel Up since late 2011 shows that when the index crosses above its 1W MA50, it tends to spend a notable time over it (and every contact is a buy opportunity), with the most recent example being the March 2023 - December 2024 period. The shortest such period has been in 2019, which was suddently disrupted by the black Swan event of COVID. We may have gotten out of a similar situation as Trump's tariffs disrupted the uptrend earlier this year with a huge, unexpected correction. There 1W MA200 supported and this brings us to a new 'above the 1W MA50 bullish phase', which even if it is as short as 2019, it can still target 7,000.
See how our prior idea has worked out:
## If you like our free content follow our profile to get more daily ideas. ##
## Comments and likes are greatly appreciated. ##
Bulls and Bears Zone for 07-02-2025S&P keeps going higher after new ATH high earlier this week. Markets could go higher for a while if we see any pullback.
Level to watch: 6232 ---6234
DIYWallSt Trade Journal: Why Traders Are Rotating from Nasdaq to**07/01/25 Trade Journal, and ES_F Stock Market analysis **
EOD accountability report: +1160
Sleep: 5 hours
Overall health: Need to catch up on sleep again
** VX Algo System Signals from (9:30am to 2pm) 4/4 success**
9:39 AM Market Structure flipped bullish on VX Algo X3! :check:
11:00 AM Market Structure flipped bearish on VX Algo X3 :check:
11:24 AM VXAlgo ES X1 Buy signal :check:
12:00 PM Market Structure flipped bullish on VX Algo X3! :check:
**What’s are some news or takeaway from today? and What major news or event impacted the market today? **
RTY and YM leading the way today
NQ lagging
Why is this?
The answer is, Simple Supply and Demand theory.
Money has to come from somewhere.
If Money is going to YM and RTY,
Money has to leave from NQ or ES or both.
There is not an infinite amount of money, So if one index is outperforming like crazy over the other. It must be draining from it
Why would it drain from NQ? Easy
Because NQ and ES already hit ATH,
YM and RTY has not hit ATH yet.
So people are selling NQ and buying YM because it is on Discount
News
N/A
**What are the critical support levels to watch?**
--> Above 6235= Bullish, Under 6210= Bearish
Video Recaps -->https://tradingview.sweetlogin.com/u/WallSt007/#published-charts


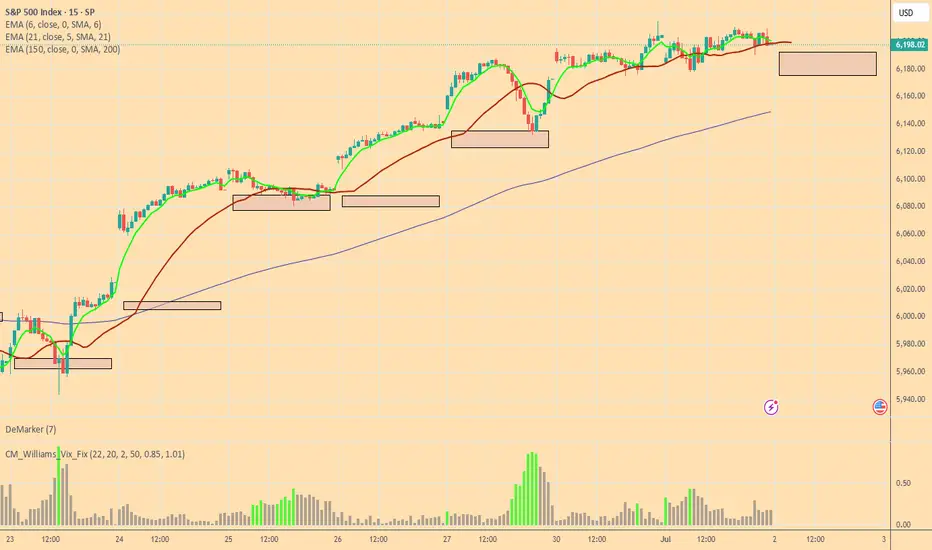
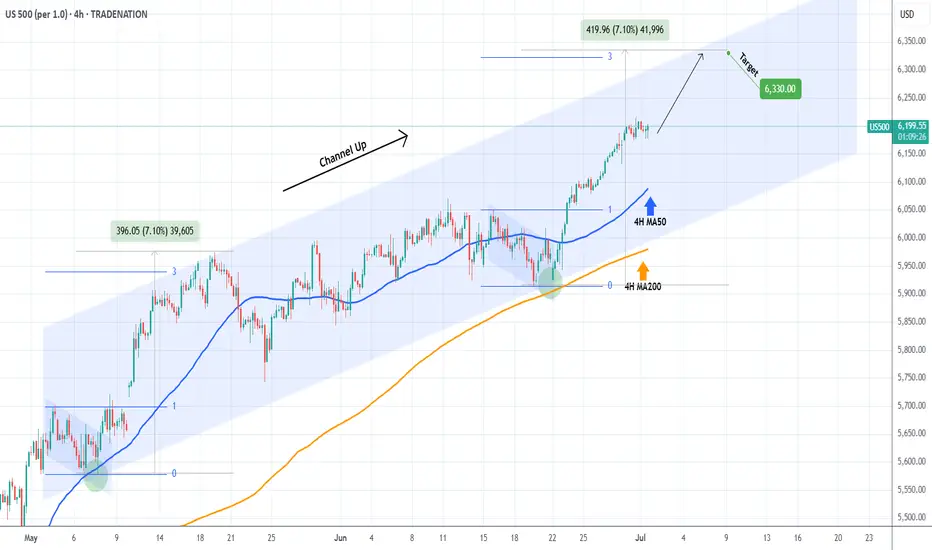
S&P500 Bullish Leg not over yet.The S&P500 index (SPX) has been trading within a Channel Up since the May 07 Low and is currently unfolding the latest Bullish Leg.
As you can see, it is far from having topped, not just by a plain trend-line (Higher Highs) perspective but also based on the Fibonacci and % rise terms relative to the previous Bullish Leg.
That peaked after a +7.10% rise, a little above the 3.0 Fibonacci extension. As a result, a 6330 Target on the short-term is more than fitting.
-------------------------------------------------------------------------------
** Please LIKE 👍, FOLLOW ✅, SHARE 🙌 and COMMENT ✍ if you enjoy this idea! Also share your ideas and charts in the comments section below! This is best way to keep it relevant, support us, keep the content here free and allow the idea to reach as many people as possible. **
-------------------------------------------------------------------------------
Disclosure: I am part of Trade Nation's Influencer program and receive a monthly fee for using their TradingView charts in my analysis.
💸💸💸💸💸💸
👇 👇 👇 👇 👇 👇
Risk On! Buy Stock Indices, Sell Gold, Silver.In this Weekly Market Forecast, we will analyze the S&P 500, NASDAQ, DOW JONES, Gold and Silver futures, for the week of June 29 - July 4th..
Stock Indices are pointed to the all time highs. Take advantage of the "risk on" environment while it lasts!
Gold and Silver have seen the outflows and profit taking... so look for lower prices this week.
Oil ... be patient. After a huge dump in prices when the tensions eased up between Israel/US and Iran, price is moving sideways in consolidation. I suspect lower prices to come, but I urge patience! Wait for the signature of price to show it intends to move lower. A sweep of the range highs and a run of the range lows right after... is the signal to sell.
Enjoy!
May profits be upon you.
Leave any questions or comments in the comment section.
I appreciate any feedback from my viewers!
Like and/or subscribe if you want more accurate analysis.
Thank you so much!
Disclaimer:
I do not provide personal investment advice and I am not a qualified licensed investment advisor.
All information found here, including any ideas, opinions, views, predictions, forecasts, commentaries, suggestions, expressed or implied herein, are for informational, entertainment or educational purposes only and should not be construed as personal investment advice. While the information provided is believed to be accurate, it may include errors or inaccuracies.
I will not and cannot be held liable for any actions you take as a result of anything you read here.
Conduct your own due diligence, or consult a licensed financial advisor or broker before making any and all investment decisions. Any investments, trades, speculations, or decisions made on the basis of any information found on this channel, expressed or implied herein, are committed at your own risk, financial or otherwise.
