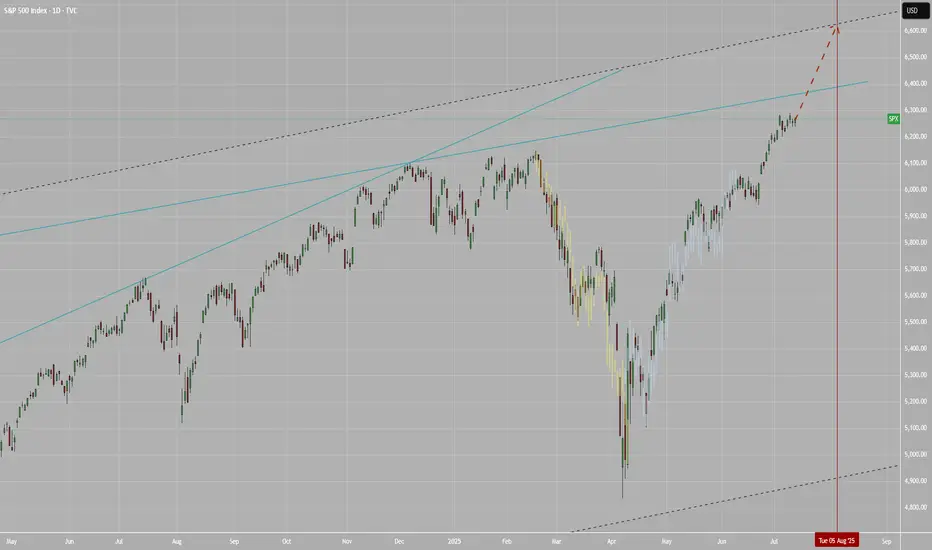
SPX to 6600+ by Aug 5This leg up in SPX is not over yet. Target at upper bound of the channel around 6.6K+ by Aug 5.
S&P 500 E-Mini Futures
S&P 500 (ES1): Post FOMC, Buyers Pushing Back To The Highs!In this video, we will analyze the following FX market for July 31 - Aug 1st.
S&P 500 (ES1!)
In the Weekly Forecast for the S&P 500, we highlighted:
- price is bullish, and expected to go higher. It did move to ATH before pulling back.
- the sell side liquidity under the ascending lows would draw price.... which it did.
- the Area of Fair Value below the lows, with the Demand Zone as the potential level where a
a high probability long could setup.... which was spot on!
Did you benefit from the forecast? Let me hear from you if you did, in the comment section.
Enjoy!
May profits be upon you.
Leave any questions or comments in the comment section.
I appreciate any feedback from my viewers!
Like and/or subscribe if you want more accurate analysis.
Thank you so much!
Disclaimer:
I do not provide personal investment advice and I am not a qualified licensed investment advisor.
All information found here, including any ideas, opinions, views, predictions, forecasts, commentaries, suggestions, expressed or implied herein, are for informational, entertainment or educational purposes only and should not be construed as personal investment advice. While the information provided is believed to be accurate, it may include errors or inaccuracies.
I will not and cannot be held liable for any actions you take as a result of anything you read here.
Conduct your own due diligence, or consult a licensed financial advisor or broker before making any and all investment decisions. Any investments, trades, speculations, or decisions made on the basis of any information found on this channel, expressed or implied herein, are committed at your own risk, financial or otherwise.
08/1/25 Trade Journal, and ES_F Stock Market analysis EOD accountability report: +440
Sleep: 6 hours
Overall health: Good
VX Algo System Signals from (9:30am to 2pm)
— 9:30 AM Market Structure flipped bearish on VX Algo X3!
— 10:12 AM VXAlgo ES X1 Buy signal
— 10:20 AM VXAlgo NQ X1 Buy Signal
—12:30 PM Market Structure flipped bullish on VX Algo X3!
— 1:00 PM Market Structure flipped bearish on VX Algo X3!
— 1:50 PM VXAlgo ES X1 Buy signal,
— 3:00 PM Market Structure flipped bullish on VX Algo X3!**
What’s are some news or takeaway from today? and What major news or event impacted the market today?
Market range expanded a lot today, we dropped over 100 points today and sometimes i forget to adjust my bracket orders to go for 10 -15 points take profits when the volatility is so high. But overall, it was a good day, I knew to be patient as market was wild and sometimes you want to just snipe a few trades and call it a day before you get caught on the wrong side.
The great thing about big moves is that it will eventually hit a major level and it will react really well, you just have to wait for it.
a great question is will the market recover? Or is going back down to April prices?
News
*STOCKS TUMBLE TO END THE WEEK, VIX SPIKES AS SOFT JOBS DATA STOKE ECONOMIC JITTERS
What are the critical support levels to watch?
--> Above 6330= Bullish, Under 6310= Bearish

Daily Orderflow on ES and NQ. 01.08.2025, NFP FridayCME_MINI:NQ1! CME_MINI:ES1!
Orderflow explanation. Sessional delivery and New York Price action

**07/31/25 Trade Journal, and ES_F Stock Market analysis **
EOD accountability report: +
Sleep: 5.5 hours
Overall health: Good
** VX Algo System Signals from (9:30am to 2pm) **
— 9:00 AM Market Structure flipped bullish on VX Algo X3
— 9:30 AM VXAlgo ES X7 Sell signal
— 9:32 AM Bullish market structure got cancelled
— 11:40 AM VXAlgo NQ X1 Buy Signal
— 12:40 PM VXAlgo NQ X1 Sell Signal
— 1:00 PM Market Structure flipped bullish on VX Algo X3!
— 1:22 PM if we lose 6415 and stayy under it . Bullish Market structure is cancelled.
— 1:55 PM VXAlgo NQ X1 Buy Signal
What’s are some news or takeaway from today? and What major news or event impacted the market today?
Today marked the 4th day of the structure signals being iffy as they try to tip the volumes bullish just to cancel it right afterwards.
I was starting to get a bit tilted today as I had a bunch of orders at area that didn't get filled and eventually just gave up trying to have a green day and walked away.
looking at some of the other charts, i also we are getting a doji on the longer time frames and it is starting to look like bear's wet dream.
However, Mag 7 stock earnings were really great, the only downside was rate cut isn't happening.
News
*U.S. STOCKS END LOWER, VIX JUMPS AS S&P 500, NASDAQ RETREAT FROM RECORDS DESPITE MONSTER META AND MICROSOFT EARNINGS
What are the critical support levels to watch?
--> Above 6415= Bullish, Under 6403= Bearish

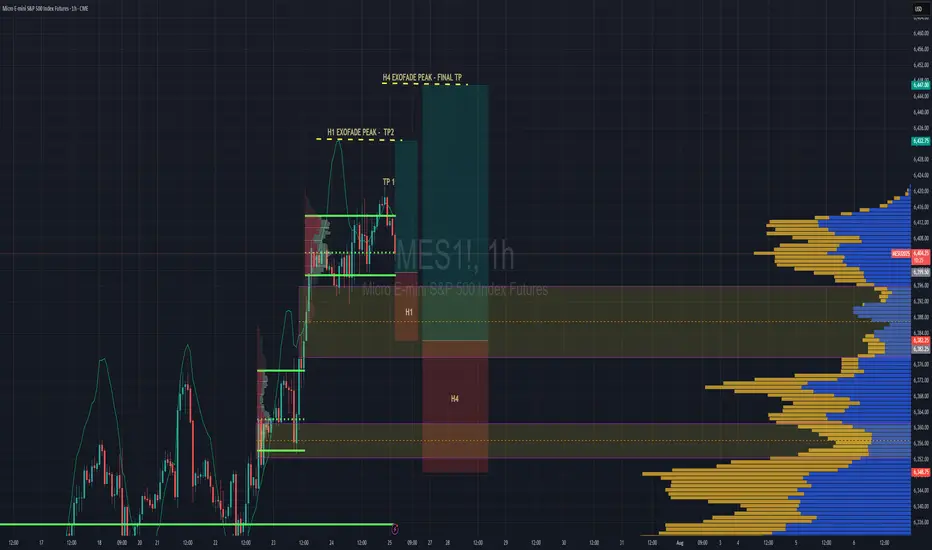
S&P 500 Intraday & Swing Entries H1 entry is close to getting activated for intraday.
If you want a swing trade then wait for H4 entry (you might be waiting a while obviously)
Reason for entries - We have broken out of Balance since July 25th and currently in a trend phase until we establish a new value area, or return to the one we broke out from.
So since Trend and Momentum is UP, then we should find Low Volume Areas to enter in the direction of the trend for a classic pullback entry trade.
07/30/25 Trade Journal, and ES_F Stock Market analysis EOD accountability report: +960
Sleep: 5 hours
Overall health: still struggling with sleep due to heat waves
VX Algo System Signals from (9:30am to 2pm)
— 8:30 AM Market Structure flipped bearish on VX Algo X3!✅
— 9:45 AM Market Structure flipped bullish on VX Algo X3! ✅
— 10:30 AM Market Structure flipped bullish on VX Algo X3!❌
— 11:30 AM Market Structure flipped bearish on VX Algo X3!❌
— 12:00 PM VXAlgo NQ X1DD Buy Signal, ✅
— 12:30 PM Market Structure flipped bullish on VX Algo X3!✅
What’s are some news or takeaway from today? and What major news or event impacted the market today?
I have started to noticed that the last 3 days, we have been getting false triggers on market structure signals and it almost feels MM are trying to do it to break people's algo that trade on that.
This is a good reminder that no matter how successful the signal has been for the last 30 days, you still need to have risk management. additionally, it's also a good way to test people's faith and trick new traders in going back to doing random things because it makes them think market can behave randomly and nothing works.
this is why i always tell people to religiously test out a system for 30 days before giving up.
News
*FEDERAL RESERVE SKIPS RATE CUT, KEEPS FED FUNDS RATE AT 4.50%
What are the critical support levels to watch?
--> Above 6410= Bullish, Under 6400= Bearish

07/29/25 Trade Journal, and ES_F Stock Market analysis EOD accountability report: +734
Sleep: 5 hours
Overall health: Been struggling with sleep due to heat waves
VX Algo System Signals from (9:30am to 2pm)
— 8:00 AM Market Structure flipped bearish✅
— 9:30 AM VXAlgo NQ X3 Buy Signal✅
— 9:36 AM Market Structure flipped bullish on VX Algo X3! ❌
— 11:49 AM VXAlgo ES X1 Buy signal✅
— 11:59 AM VXAlgo NQ X1 Buy Signal❌
What’s are some news or takeaway from today? and What major news or event impacted the market today?
Today was one of the few short the resistance day and refreshing to see after we been grinding ATH (all time highs)
News
— 1:30 PM
🇺🇸🇨🇳 *CHINA SAYS IT AGREES WITH US TO EXTEND TARIFF TRUCE
What are the critical support levels to watch?
--> Above 6395= Bullish, Under 6374= Bearish

07/28/25 Trade Journal, and ES_F Stock Market analysis EOD accountability report: +405
Sleep: 5 hours
Overall health: meh
VX Algo System Signals from (9:30am to 2pm)
— 9:00 AM Market Structure flipped bullish❌
— 10:04 AM VXAlgo ES X1 Buy signal! ✅
— 11:21 AM Under 6424, the structure is bearish. Don't avg down! ✅
— 11:40 AMVXAlgo NQ X1 Buy Signal! ✅
— 12:40 PM VXAlgo NQ X1DD Sell Signal! ✅
— 1:30 PM VXAlgo ES X3DD Sell Signal! ✅
What’s are some news or takeaway from today? and What major news or event impacted the market today?
Today was one of the few short the resistance day and refreshing to see after we been grinding ATH (all time highs)
News
Eu trade deal over the weekend,
& china tariff extension.
What are the critical support levels to watch?
--> Above 6395= Bullish, Under 6374= Bearish

Bulls and Bears zone for 07-28-2025Last week 4 out of 5 sessions S&P 500 made new ATH. However they were all trading within a tight range.
Level to watch: 6434---6436
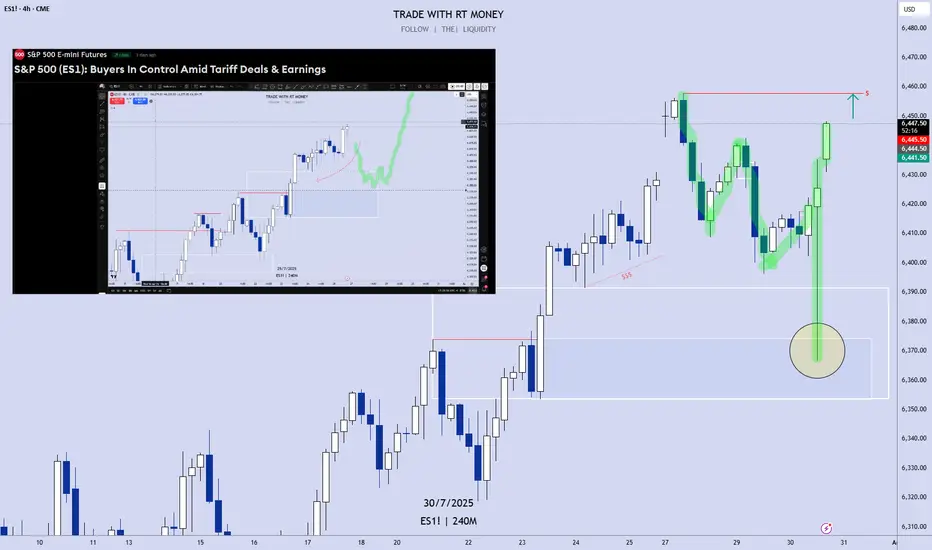
S&P 500 (ES1): Buyers In Control Amid Tariff Deals & EarningsWelcome back to the Weekly Forex Forecast for the week of July 28 - Aug 1st.
In this video, we will analyze the following FX market:
S&P 500 (ES1!)
The S&P 500 rose Friday to fresh highs, following a busy week of tariff updates and earnings. The S&P ended the week with its fifth straight record close, its longest such streak in over a year.
No reason to consider selling. Wait for pullbacks to FVGs for high probability buys.
FOMC and NFP loom. Be careful to avoid new entries during news times.
Enjoy!
May profits be upon you.
Leave any questions or comments in the comment section.
I appreciate any feedback from my viewers!
Like and/or subscribe if you want more accurate analysis.
Thank you so much!
Disclaimer:
I do not provide personal investment advice and I am not a qualified licensed investment advisor.
All information found here, including any ideas, opinions, views, predictions, forecasts, commentaries, suggestions, expressed or implied herein, are for informational, entertainment or educational purposes only and should not be construed as personal investment advice. While the information provided is believed to be accurate, it may include errors or inaccuracies.
I will not and cannot be held liable for any actions you take as a result of anything you read here.
Conduct your own due diligence, or consult a licensed financial advisor or broker before making any and all investment decisions. Any investments, trades, speculations, or decisions made on the basis of any information found on this channel, expressed or implied herein, are committed at your own risk, financial or otherwise.

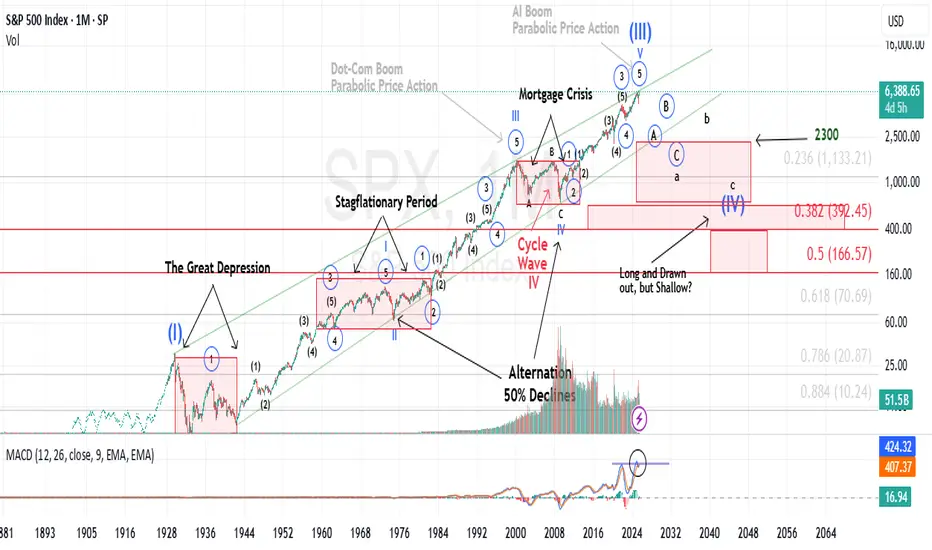
History does not repeat itself, however it tends to rhymeIt’s widely accepted that Mark Twain once said (or wrote) that “history does not repeat itself, however it tends to rhyme”.
Historical Parallels to a Super Cycle Wave (I) Top in U.S. Equities
The road to a major market top is often paved with echoing patterns from the past, and today's landscape bears an uncanny resemblance to pivotal historical events that preceded economic upheaval.
The 1918 Spanish Flu—though less economically damaging in the U.S. than elsewhere, still triggered a 1.5% drop in GDP and a 2.1% decline in consumer spending. The resulting economic weakness, paired with rising inflation, eroded real returns on equities and short-term government bonds for years.
Then came the 1929 stock market crash, the spark that ignited the Great Depression. Driven by a perfect storm of extreme speculation, sky-high valuations, and a regulatory vacuum, the collapse revealed the systemic fragility beneath the euphoria.
Adding fuel to the fire, the Smoot-Hawley Tariff Act of 1930 slammed the brakes on global trade. By sharply raising tariffs on imports, it invited swift retaliatory measures from abroad. The result: a devastating plunge in both U.S. exports and imports, deepening the economic crisis and worsening unemployment. Smoot-Hawley has since become a textbook example of how protectionist policy can magnify economic damage.
Modern Echoes: A Cycle Repeating?
Fast forward to the present and we see unsettling similarities.
The Covid-19 pandemic serves as a modern analog to the 1918 flu, disrupting global supply chains and triggering a steep drop in GDP and consumer spending. Unlike the post-WWI period, however, inflation didn’t precede the crisis, it exploded afterward, fueled by pent-up demand and fiscal stimulus, giving rise to persistent “sticky” inflation....and NOT TRANSITORY.
In a similar inversion of sequence, the Trump-era tariffs—modern-day echoes of Smoot-Hawley, were enacted before any major equity downturn, not after. Still, their long-term impact on global trade and supply chain reliability remains a pressure point for the economy.
Most critically, speculation and valuation excess are again center stage. Just as the roaring ’20s were characterized by euphoric risk-taking, today’s U.S. equity market is trading at record-high P/E ratios, despite rising macroeconomic uncertainty and deteriorating breadth.
These historical and contemporary markers suggest we may be approaching the apex of a Super Cycle Wave (III), a turning point that, like its predecessors, may only be fully recognized in hindsight.
It is my contention, that history is currently rhyming.
Best to all,
Chris
07/25/25 Trade Journal, and ES_F Stock Market analysis
EOD accountability report: +228
Sleep: 5 hours
Overall health: Still struggling to catch up on sleep. gonna take gg sleeping pills today
** VX Algo System Signals from (9:30am to 2pm) **
— 9:07 AMMarket Structure flipped bearish on VX Algo X3! :white_check_mark:
— 9:53 AM Market Structure flipped bullish on VX Algo X3! :white_check_mark:
— 10:30 AM Market Structure flipped bullish on VX Algo X3! :white_check_mark:
— 11:00 AM VXAlgo ES X1 Sell Signal :x:
**What’s are some news or takeaway from today? and What major news or event impacted the market today? **
Market structure algo was flipping a lot today, even in premarket, which tells me that MM was changing position a lot and things could be unreliable so i decided to end the trading day early at $200 and closed up shop on my main acccount.
**News**
*S&P 500 ENDS AT A NEW RECORD HIGH
**What are the critical support levels to watch?**
--> Above 6395= Bullish, Under 6372= Bearish
Video Recaps -->https://tradingview.sweetlogin.com/u/WallSt007/#published-charts

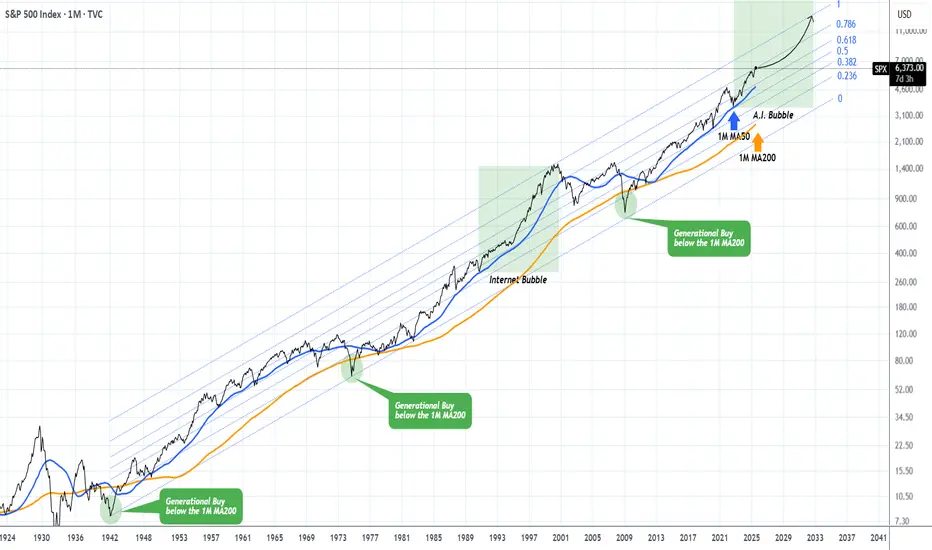
S&P500 This is why every CORRECTION is a GIFT.The S&P500 index (SPX) has been steadily rising since the April bottom to new All Time Highs (ATH). On the grand 100 year scale, the February - March tariff fueled correction, has been nothing significant. The last true technical correction has been the 2022 Inflation Crisis because it touched, and instantly rebounded on, the 1M MA50 (blue trend-line).
This is not the first time we bring forward our multi-decade perspective on stock and in particular this chart. But it serves well, keeping us into the meaningful long-term outlook of the market. This suggests that since the Great Depression and the first signs of recovery after the 1935 - 1941 Bear Cycle, the market has entered a multi-decade Channel Up, which is divided into long-term aggressive expansion periods (Bull Cycles) and shorter term depressions (Bear Cycles).
During a Bull Cycle, every test of the 1M MA50 is a instant cyclical buy opportunity and in fact that isn't presented very often. During a Bear Cycle, the market makes an initial aggressive correction below the 1M MA50, turns increasingly volatile for 5-7 years, trading sideways within the Channel Up with its second peak resulting into a 2nd correction that eventually breaks below the 1M MA200 (orange trend-line).
That is what we call a 'generational buy opportunity' as in the past 80 years, it has only been taken place 2 times.
Right now (again this is not something we mention for the first time), the market is at the start of the A.I. Bubble, with incredibly strong similarities with the Internet Bubble of the 1990s.
In fact, relative to the Internet Bubble, it appears that we are on a stage similar to 1993 - 1994, before the market turned parabolic to the eventual Dotcom Bust of 2000.
As a result, from a technical perspective, every 'small' correction such as the one we had this year, is a blessing in disguise (buy opportunity). As the index grew by 5 times during the Internet Bubble (300 to 1500), it is also very possible to see it approach this feat going from roughly 3500 (late 2022) to 14000 (by late 2032) and touch the top of the multi-decade Channel Up.
Are you willing to miss out on this generational wealth creation opportunity?
-------------------------------------------------------------------------------
** Please LIKE 👍, FOLLOW ✅, SHARE 🙌 and COMMENT ✍ if you enjoy this idea! Also share your ideas and charts in the comments section below! This is best way to keep it relevant, support us, keep the content here free and allow the idea to reach as many people as possible. **
-------------------------------------------------------------------------------
💸💸💸💸💸💸
👇 👇 👇 👇 👇 👇
07/23/25 Trade Journal, and ES_F Stock Market analysis EOD accountability report: -1243
Sleep: 4 hours
Overall health: having issues with sleep the last 2 nights
VX Algo System Signals from (9:30am to 2pm)
9:23 AM Market Structure flipped bullish on VX Algo X3!
9:34 AM Market Structure flipped bearish on VX Algo X3!
11:47 AM Market Structure flipped bullish on VX Algo X3!
12:17 PM NQ X1 Sell Signal (triple sell)
What’s are some news or takeaway from today? and What major news or event impacted the market today?
After going on a long green streak, I got a bit greedy and wanted to make a big profit and went a bit risky dicky at the end of the session, having been able to read everything pretty well, I was pretty sure $6400 was going to be a pretty tight resistance between reading the gammabot data and options data, it showed that we would stall at $6400 on ES so i decided to put a few big ES short positions there with a tight stoploss at 6405 thinking, it surely can't go wrong with only a few minutes left in the session.
and surely it did, it went completely wrong and i went from being positive for the day to negative and throwing my profits away.
News
*STOCKS SURGE AFTER US-JAPAN TRADE DEAL AS S&P 500 AND NASDAQ CLINCH FRESH RECORDS
What are the critical support levels to watch?
--> Above 6339= Bullish, Under 6320= Bearish
Video Recaps -->https://tradingview.sweetlogin.com/u/WallSt007/#published-charts

S&P500: Rally ContinuesYesterday, the S&P 500 managed to notch modest gains once again. In line with our primary scenario, the ongoing magenta wave (B) is likely to continue climbing toward resistance at 6,675 points. Once this corrective upswing reaches its peak—still below that level—we anticipate a pullback as part of wave (C), which should drive the index below support at 5,127 points. Beneath this threshold, our green long Target Zone spans from 4,988 to 4,763 points. We expect the low of wave (C) and the conclusion of the broader green wave to occur within this range. From there, a sustained rally is expected to unfold in wave , which should lift the index above resistance at 6,675 points and complete the cyclical blue wave (III). As a result, this price range can be considered for long entries. The alternative scenario, which calls for a direct breakout above the 6,675-point level without a prior pullback, remains in play with a 40% probability.
📈 Over 190 precise analyses, clear entry points, and defined Target Zones - that's what we do (for more: look to the right).

Daily Orderflow on $ES $NQ $GC. 23.07.2025, WednesdayOutlining the orderflow along with the examples of todays trades. Outlined PM session expansion as well

07/22/25 Trade Journal, and ES_F Stock Market analysis
EOD accountability report: +
Sleep: 6 hours
Overall health: Good
** VX Algo System Signals from (9:30am to 2pm) **
— 9:40 AM Market Structure flipped bearish on VX Algo X3!
— 10:20 AM VXAlgo ES X1 Buy signal
— 11:30 AM VXAlgo NQ X1DD Sell Signal
— 2:00 PM Market Structure flipped bullish on VX Algo X3!
**What’s are some news or takeaway from today? and What major news or event impacted the market today? **
Very clean trading day for me, signals worked out really well and everything played out accordingly
**News**
S&P 500 CLOSES AT A NEW ALL-TIME HIGH ABOVE 6,000
**What are the critical support levels to watch?**
--> Above 6339= Bullish, Under 6320= Bearish
Video Recaps -->https://tradingview.sweetlogin.com/u/WallSt007/#published-charts

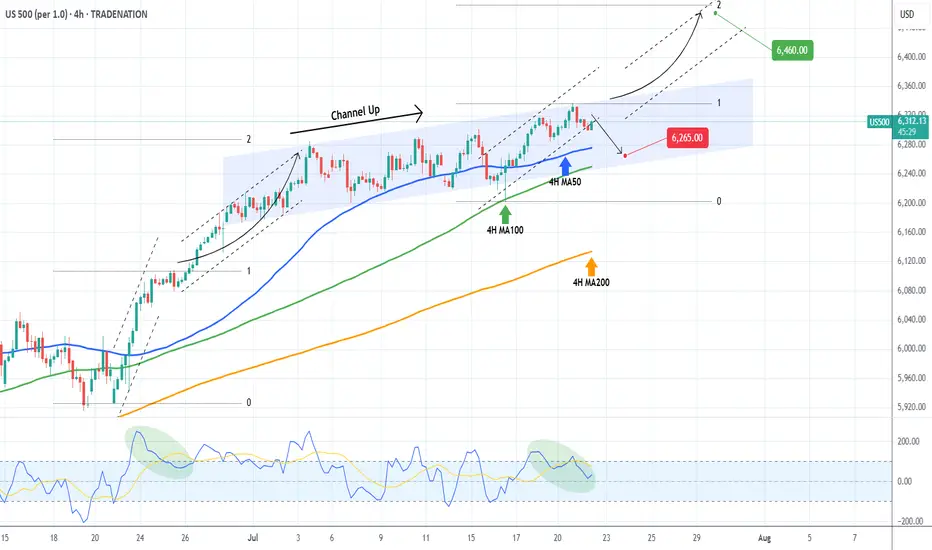
S&P500 Critical short-term crossroads.The S&P500 index (SPX) has been trading within a Channel Up since for the entirety of July and right now is ahead of important crossroads. It either breaks out above the pattern or pulls back to price a new Higher Low.
Based on the 4H CCI and the similarities with the June 24 - 25 consolidation, there are higher probabilities to break upwards. That fractal reached the 2.0 Fibonacci extension after it broke out. We will wait for confirmation and if it's delivered, we will buy the break-out and target 6460 (just below Fib 2.0 ext).
Until then, being so close to the Channel Up top, makes a solid short opportunity targeting a Higher Low (bottom). The previous one was priced exactly on the 4H MA100 (green trend-line) so that's our target or 6250 if it comes earlier.
-------------------------------------------------------------------------------
** Please LIKE 👍, FOLLOW ✅, SHARE 🙌 and COMMENT ✍ if you enjoy this idea! Also share your ideas and charts in the comments section below! This is best way to keep it relevant, support us, keep the content here free and allow the idea to reach as many people as possible. **
-------------------------------------------------------------------------------
Disclosure: I am part of Trade Nation's Influencer program and receive a monthly fee for using their TradingView charts in my analysis.
💸💸💸💸💸💸
👇 👇 👇 👇 👇 👇
DIYWallSt Trade Journal: $531 Profit & Navigating Volatile Morn**07/21/25 Trade Journal, and ES_F Stock Market analysis **
EOD accountability report: +531.25
Sleep: 6 hours
Overall health: worked on the newsletter last night and didn't get much sleep.
** VX Algo System Signals from (9:30am to 2pm) **
— 9:30 AM VXAlgo NQ X3 Buy
— 9:42 AM Market Structure flipped bullish on VX Algo X3!
— 10:40 AM VXAlgo ES X1 Sell Signal
— 12:42 PM VXAlgo ES X1 Buy signal
**What’s are some news or takeaway from today? and What major news or event impacted the market today? **
market moved very well this morning after bullish market structure signal, but because it was so violent, it was hard to hold that position for long.
throughout the rest of the day, it moved extremely slow and eventually formed a double top and came all the way down to market opening price lol.
**News**
*FED CHAIR POWELL HIT WITH CRIMINAL REFERRAL BY HOUSE GOP TRUMP ALLY - FOXNEWS
**What are the critical support levels to watch?**
--> Above 6339= Bullish, Under 6320= Bearish
Video Recaps -->https://tradingview.sweetlogin.com/u/WallSt007/#published-charts

S&P 500: Buyers Are Still In Control! Continue To Look For LongsWelcome back to the Weekly Forex Forecast for the week of July 21-25th.
In this video, we will analyze the following FX market:
S&P 500 (ES1!)
The Stock Indices are strong, and showing no signs of selling off. Buy it until there is a bearish BOS.
Enjoy!
May profits be upon you.
Leave any questions or comments in the comment section.
I appreciate any feedback from my viewers!
Like and/or subscribe if you want more accurate analysis.
Thank you so much!
Disclaimer:
I do not provide personal investment advice and I am not a qualified licensed investment advisor.
All information found here, including any ideas, opinions, views, predictions, forecasts, commentaries, suggestions, expressed or implied herein, are for informational, entertainment or educational purposes only and should not be construed as personal investment advice. While the information provided is believed to be accurate, it may include errors or inaccuracies.
I will not and cannot be held liable for any actions you take as a result of anything you read here.
Conduct your own due diligence, or consult a licensed financial advisor or broker before making any and all investment decisions. Any investments, trades, speculations, or decisions made on the basis of any information found on this channel, expressed or implied herein, are committed at your own risk, financial or otherwise.

Emini Nasdaq 100. Daily Market Walkthrough. Entries & Exits. Explained in depth overview of NQ. What exactly my thought process was in a specific time window

DIYWallSt Trade Journal:$238 Lessons From Monthly Expiration07/18/25 Trade Journal, and ES_F Stock Market analysis
EOD accountability report: +238.75
Sleep: 5. hours
Overall health: Was working late last night and didn't get much sleep.
VX Algo System Signals from (9:30am to 2pm)
— 8:30 AM Market Structure flipped bullish on VX Algo X3!
— 10:30 AM Market Structure flipped bearish on VX Algo X3!
— 11:10 AM VXAlgo ES X1 Buy signal (didn't work that well)
— 12:10 PM VXAlgo NQ X1DD Sell Signal
— 12:19 PM Market Structure flipped bullish on VX Algo X3!
What’s are some news or takeaway from today? and What major news or event impacted the market today?
Today was monthly expiration for options and we got a lot of X7 Sell signals but structure was bullish so I tried to take a long at MOB and got burned. Flipped bearish and started shorting the rest of the day and ended up making money back.
News
*US STOCKS MOVE LOWER AFTER REPORT SAYS TRUMP PUSHES FOR 15-20% MINIMUM TARIFF ON ALL EU GOODS
What are the critical support levels to watch?
--> Above 6335= Bullish, Under 6315= Bearish
Video Recaps -->https://tradingview.sweetlogin.com/u/WallSt007/#published-charts
