Day 12 — Trading Only S&P Futures | Big Loss LessonWelcome to Day 12 of Trading Only S&P Futures!
Today was a tough one. I started off leaning bearish after NVDA flashed a strong sell signal — chips usually lead the market — so I went in heavy shorting 6461. Got stopped out at 6471 for a big hit, and of course right after, the market flushed under 6450.
Tried again, but with poor entries, I was quickly down -592 on the day. At that point, I reminded myself of one thing: live to fight another day. Instead of forcing it, I scaled back, waited for cleaner setups, and clawed some of it back to finish at -295.
🔔 VX Algo Signals (9:30am – 2pm EST)
9:30 AM Market Structure flipped bearish on VX Algo X3!
9:42 AM VXAlgo NVDA X7 Sell Signal
10:30 AM Market Structure flipped bullish on VX Algo X3!
11:00 AM Market Structure flipped bearish on VX Algo X3!
11:20 AM VXAlgo ES X1 Buy signal
12:10 PM VXAlgo NQ X1DD Sell Signal
1:20 PM VXAlgo ES X1 Buy signal (double buy)
🔑 Key Levels for Tomorrow
Above 6465 = Flip Bullish
Below 6455 = Remain Bearish
Es1

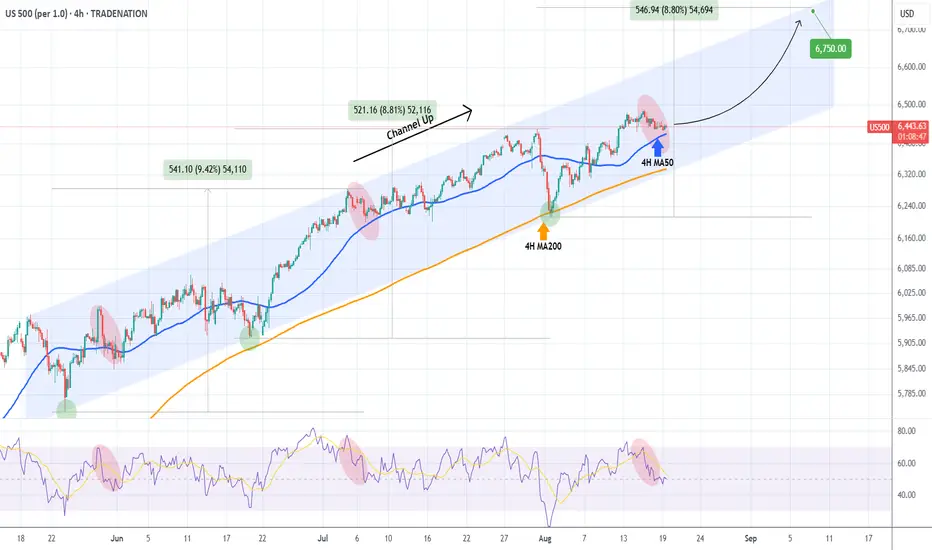
S&P500 Can the 4H MA50 save the day again?The S&P500 index (SPX) is on a short-term pull-back following the new All Time High (ATH) on August 15 of the 3-month Channel Up. It is just above the 4H MA50 (blue trend-line), which has been the most common level of Support throughout this pattern, before the 4H MA200 (orange trend-line), which formed its last Higher Low.
As a result, as long as it holds, it is more likely to see a continuation of the Bullish Leg that started on the 4H MA200 bounce (August 01). The previous Bullish Leg peaked on a +8.80% rise, so that gives us a medium-term Target of 6750.
-------------------------------------------------------------------------------
** Please LIKE 👍, FOLLOW ✅, SHARE 🙌 and COMMENT ✍ if you enjoy this idea! Also share your ideas and charts in the comments section below! This is best way to keep it relevant, support us, keep the content here free and allow the idea to reach as many people as possible. **
-------------------------------------------------------------------------------
Disclosure: I am part of Trade Nation's Influencer program and receive a monthly fee for using their TradingView charts in my analysis.
💸💸💸💸💸💸
👇 👇 👇 👇 👇 👇
ES Analyses 08/19 Rejection short from 6479–6485 (OB + PDH)Fundamentals (what can move ES)
• 08:30 ET – U.S. New Residential Construction (Housing Starts/Permits). First move risk right at the print; can nudge yields and risk appetite. We’ll let the initial spike settle and then act on the HTF levels below. 
⸻
Key levels from your charts
Numbers rounded to the quarter where needed.
• PDH: 6484.25
• PDL: 6456.00
• ONH: 6475.25
• ONL: 6462.00
• RTH VWAP (today): 6466.50
• PMH / Asia H cluster: 6470.5–6471.75
• 30-min supply / OB: 6479–6485 (overlaps PDH)
• Liquidity/defense zone (“strong low”/Mon swing): 6452–6456
Think of 6468–6472 as the intraday “equilibrium” band we’ve been ping-ponging around; acceptance away from this band is what should start the 15+ pt drive.
Context: We press into the 30-min supply shelf that capped NYPM today.
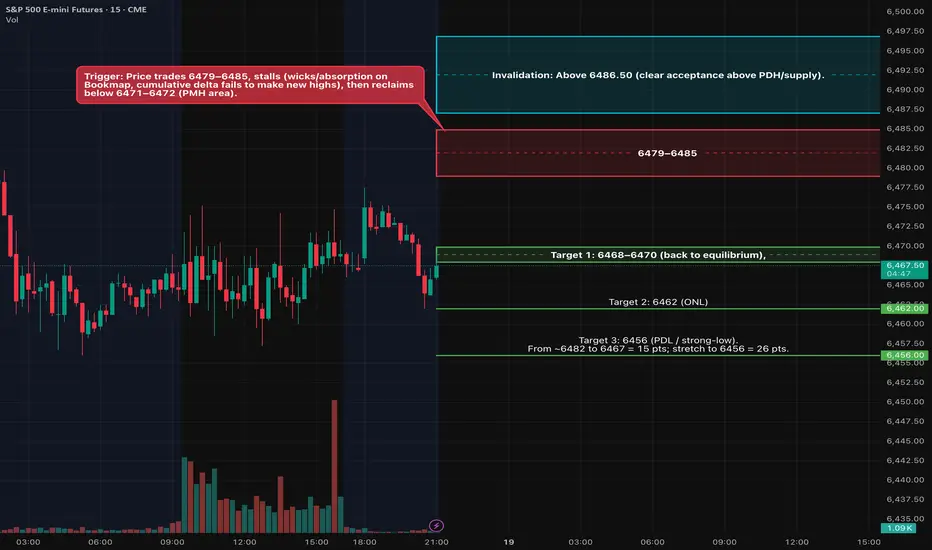
Trigger: Price trades 6479–6485, stalls (wicks/absorption on Bookmap, cumulative delta fails to make new highs), then reclaims below 6471–6472 (PMH area).
Entry style: Stop-market on the reclaim or limit into a micro pullback after the failed pop.
Invalidation: Above 6486.50 (clear acceptance above PDH/supply).
Targets:
6468–6470 (back to equilibrium),
6462 (ONL),
6456 (PDL / strong-low).
From ~6482 to 6467 = 15 pts; stretch to 6456 = 26 pts.
Order-flow tells: Offers replenish 6480–6485; iceberg/absorption on up-ticks; delta divergence into the level.
Timing
08:30 ET data: stand aside for the first 2–5 minutes; let the impulse show its hand, then look for our triggers.
Federal Reserve Bank of New York
NY AM window: 09:45–11:30 ET.
NY PM window: 13:30–15:30 ET (if morning doesn’t give clean structure).
Day 11 — Trading Only S&P Futures — Mixed Signals, +$199Welcome to Day 11 of Trading Only S&P Futures!
Today was all about adapting and not forcing trades. I’ve noticed I usually perform best later in the day, so I’ve been starting with smaller contracts to warm up. Profits started rolling in, but things felt different — market makers kept flipping structure and trying to trap traders.
I was expecting more downside, but once I saw the MM games, I decided to protect profits and lock in +$199.20 instead of being greedy.
📰 News Highlights
STOCKS END MOSTLY FLAT TO START THE WEEK AS INVESTORS LOOK AHEAD TO POWELL SPEECH, RETAIL EARNINGS
🔔 VX Algo Signals (9:30am – 2pm EST)
7:01 AM Market Structure flipped bullish on VX Algo X3!
9:58 AM Market Structure flipped bearish on VX Algo X3!
9:58 AM VXAlgo ES X3DD Sell Signal
11:30 AM VXAlgo NQ X1DD Sell Signal
12:30 PM Market Structure flipped bullish on VX Algo X3!
12:50 PM VXAlgo NQ X1DD Sell Signal
2:00 PM Market Structure flipped bullish on VX Algo X3!
🔑 Key Levels for Tomorrow
Above 6460 = Remain Bullish
Below 6450 = Bearish

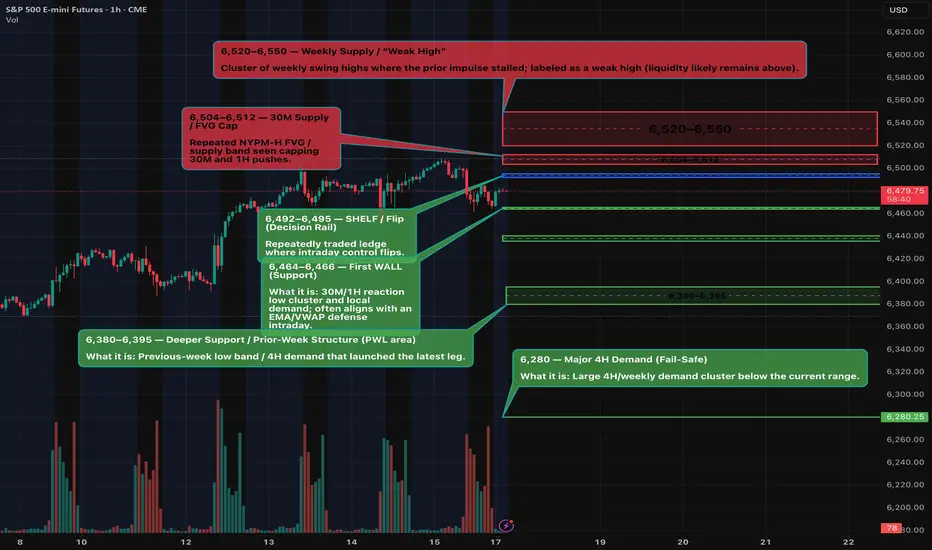
ES (S&P 500 Futures) - Week Plan Aug 18–22Context (W/D/4H/1H/30M): ES is consolidating just under 6,500. Price is boxed roughly 6,466 ↔ 6,504/12 with a cluster of highs above and recurring demand tests below.
Key Levels (zones, not single ticks):
Resistance: 6,504–6,512 (near-term lid). Above that: 6,520–6,550 (weekly supply/“weak high”).
Decision level: 6,492–6,495 (where control often flips intraday).
Supports: 6,464–6,466 (first support) → 6,436–6,440 → 6,380–6,395 (deeper support).
How to read it:
Bull path: A firm break and hold above 6,504 favors a push toward 6,520 → 6,535 → 6,550.
Bear path: Failure at 6,495 or a clean break below 6,464 opens 6,440 → 6,390.
If price stays between 6,466 and 6,504, expect range behavior until a catalyst pushes it out.
Scenarios (next week):
Range continues: Chop between 6,466–6,512 until mid-week events.
Upside break: Hold above 6,504 → test 6,520–6,550 (watch for reaction there).
Downside break: Lose 6,464 with momentum → 6,440, then 6,390 if pressure persists.
Key events (ET):
Wed: Federal Reserve meeting minutes (afternoon).
Thu: Weekly claims; flash PMIs; existing home sales (morning block).
Thu–Sat: Jackson Hole economic symposium (watch for policy remarks).
Notes: Levels are zones and may see initial reactions before acceptance or rejection. This post is for market commentary/education only.
Weekly Outlook. Index Triad. $ES $NQ $YM. 17.08.2025, SundayCME_MINI:ES1!
CME_MINI:NQ1!
CBOT_MINI:YM1!
Looking for a Weekly Power of Three on NQ ES and YM. A push down towards discount levels and again a massive push up towards new All Time Highs

Day 10 — Trading Only S&P Futures | $200+ Goal HitWelcome to Day 10 of Trading Only S&P Futures!
After waking up super early and not getting back to sleep, I spent most of my morning going through 13F filings to see where hedge funds are putting their money. The trading day started strong — market structure flipped bearish and price action followed perfectly.
I missed the exact market bottom by just 2 points, but patience paid off. I eventually caught the reversal back to the 5-min MOB and closed the day with a +212.54 gain — hitting the $200 daily goal I’ve been aiming for all week.
📈 What you’ll learn
How to stay patient after missing a perfect entry
Using market structure & MOB zones together
Why having a daily profit target helps discipline
Combining trading with ongoing market research
⏰ Timestamps
0:00 — Intro & Day 10 Recap
0:50 — Early Start & Hedge Fund 13F Research
1:40 — Market Structure Sets the Tone
2:10 — Missing the Bottom by 2 Points
3:00 — Catching the Reversal at 5-min MOB
4:00 — Key Levels for Tomorrow
4:30 — Closing Thoughts
📰 News Highlights
FED CHAIR CANDIDATE MARC SUMERLIN SUPPORTS 50BPS RATE CUT DUE TO INVERSION OF CURVE
🔔 VX Algo Signals (9:30am – 2pm EST)
8:30 AM Market Structure flipped bearish on VX Algo X3!
9:39 AM VXAlgo Market Structure flipped bearish - 9:31
9:40 AM VXAlgo NQ X1DD Sell Signal
11:00 AM VXAlgo NQ X1DD Sell Signal
12:40 PM VXAlgo NQ X1DD Sell Signal
12:50 PM VXAlgo NQ X3 Buy Signal
1:30 PM Market Structure flipped bullish on VX Algo X3!
🔑 Key Levels for Tomorrow
Above 6460 = Remain Bullish
Below 6440 = Bearish

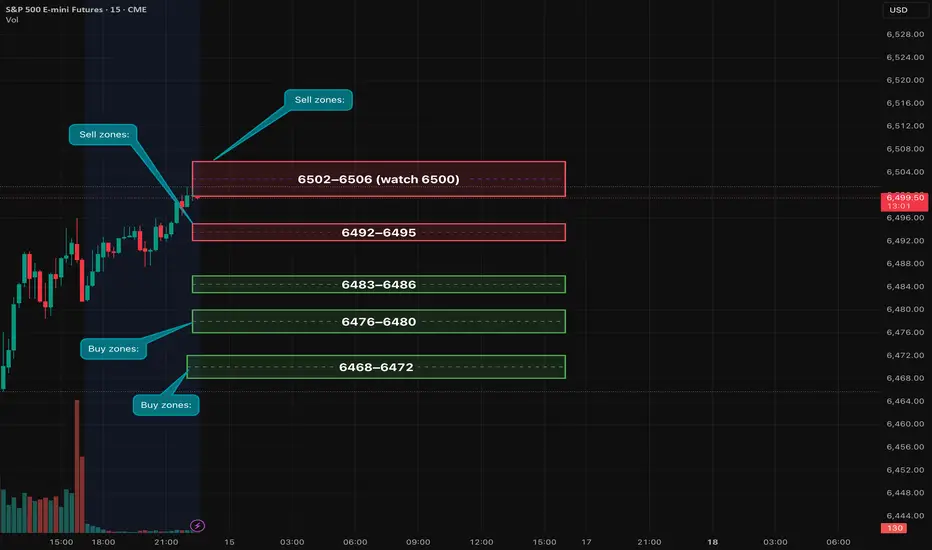
ES1! Plan — Fri Aug 15 | OPEX + U. Mich (10:00 ET). Key levelsES held above 6480 and is pressing into 6490s ahead of monthly OPEX and U. Michigan Sentiment at 10:00 ET. Yesterday’s hot PPI (3.3% YoY) keeps rates sticky; 6500 is a logical magnet/pin.
Levels:
• Sell zones: 6492–6495, 6502–6506 (watch 6500).
• Buy zones: 6483–6486, 6476–6480, 6468–6472.
A++ Setups (≥15-pt TP1):
1. Short 6492–6495 (or 6502–6506) on absorption + LH/ChoCH → TP1 6477–6480, TP2 6468–6472.
2. Long 6476–6480 (or defended 6483–6486) on absorption + HH/VWAP reclaim → TP1 6492–6495, TP2 6502–6506.
Risk: Stop 6–8 pts beyond zones or ≥1.25× 1-min ATR past last swing. Scale 40–50% at TP1; BE+2 on balance; trail swings.
Event risk: 10:00 ET U. Mich; late-day OPEX flows (14:00–16:00) and MOC around 15:50 ET.
Not financial advice.
Day 9 — Trading Only S&P Futures — Small Win, Staying DisciplineWelcome to Day 9 of Trading Only S&P Futures!
Today was a slower day for me. I had a meeting in the morning, didn’t start trading until after 11, and took a loss right away on my first trade. Instead of forcing trades, I decided to step back, protect my gains from the week, and focus on other projects.
I still managed to close the day +93.03, keeping my consistency goal intact. The endgame here is to build a system where I can copy trade 10 accounts at once, making $100–$200 per day.
📈 What you’ll learn
Why stepping away can be a winning move
Importance of avoiding revenge trading after a loss
Long-term consistency over short-term action
Vision for scaling to multiple accounts
⏰ Timestamps
0:00 — Intro & Day 9 Recap
0:40 — Why I Started Late Today
1:20 — First Loss & Market Read
2:00 — Decision to Step Back Early
3:00 — Consistency Over Aggression
3:30 — Key Levels for Tomorrow
📰 News Highlights
Traders are still pricing in a 90% likelihood that the Fed will cut rates by 25bps next month despite the hottest PPI reading in three years.
🔔 VX Algo Signals (9:30am – 2pm EST)
8:32 AM Market Structure flipped bearish on VX Algo X3!
10:30 AM Market Structure flipped bullish on VX Algo X3!
10:57 AM VXAlgo NQ X1 Sell Signal
11:30 AM Market Structure flipped bearish on VX Algo X3!
11:50 AM VXAlgo NQ X1 Buy Signal (double signal)
12:30 PM VXAlgo ES X3DD Sell Signal
1:30 PM Market Structure flipped bullish on VX Algo X3!
1:40 PM VXAlgo NQ X1 Sell Signal
🔑 Key Levels for Tomorrow
Above 6460 = Remain Bullish
Below 6440 = Bearish

Day 8 — Trading Only S&P Futures — From -400 to +155Welcome to Day 8 of Trading Only S&P Futures!
Today was a battle of patience and discipline. I started the day with a -400 loss from an overnight short order that got stopped out before the market even opened. It was tempting to close up shop, but I traded small, stayed disciplined, and waited for the right setup.
Once I saw the X7 Sell Signal align with X3 Bearish Structure, I sized up — turning the day from deep red to +155 before fees.
📈 What you’ll learn
How to manage a big overnight loss without spiraling
The importance of sizing down until confidence returns
Using structure + signal alignment for A+ setups
Patience in clawing back losses
⏰ Timestamps
0:00 — Intro & Day 8 Recap
0:40 — The Overnight Loss & Mindset Shift
1:40 — Clawing Back With Small Trades
2:20 — The X7 + X3 Bearish Alignment Trade
3:00 — Market News & Impact
3:30 — Key Levels for Tomorrow
📰 News Highlights
DOW jumps over 400 points, VIX falls as stocks end higher on rate cut bets.
🔔 VX Algo Signals (9:30am – 2pm EST)
3:00 AM Market Structure flipped bullish on VX Algo X3!
9:30 AM VXAlgo ES X1 Sell Signal
9:42 AM VXAlgo NQ X1 Sell Signal
10:00 AM VXAlgo ES X1 Sell Signal
10:26 AM VXAlgo ES X7 Sell signal
10:30 AM Market Structure flipped bearish on VX Algo X3!
11:20 AM VXAlgo ES X1 Buy signal (double buy)
1:25 PM VXAlgo NQ X3 Buy Signal
2:13 PM Market Structure flipped bullish on VX Algo X3!
🔑 Key Levels for Tomorrow
Above 6440 = Remain Bullish
Below 6410 = Bearish


Day 7 Trading Only S&P Futures — Trusting Structure Over GreedWelcome to Day 7 of Trading Only S&P Futures!
Today was a mixed day with a small loss of -$16.65. I started strong, up $133 early on, but after a big push up, I expected the market structure to flip bearish and missed a key long entry. Later, I shorted the 6451 resistance but let greed get the best of me, holding too long and turning a winner into a loss.
The key lesson? Trust the market structure and the double down (DD) signals — don’t fight the system.
📈 What you’ll learn
Why trusting structure and signals beats guessing the market
How greed can sabotage even well-planned trades
The importance of taking profits on key moves
Reading VX Algo signals for better trade timing
⏰ Timestamps
0:00 — Intro & Day 7 Recap
0:30 — Trading Wins & Mistakes
1:30 — VX Algo Signal Review
2:30 — Market News & Impact
3:30 — Key Levels for Tomorrow
🔔 VX Algo Signals (9:30am – 2pm EST)
8:29 AM Market Structure flipped bullish on VX Algo X3!
10:10 AM VXAlgo NQ X1 Buy Signal
10:20 AM VXAlgo NQ X1DD Buy Signal (double buy)
11:30 AM VXAlgo ES X1 Sell Signal
11:50 AM VXAlgo ES X1 Sell Signal
12:10 PM VXAlgo NQ X1 Sell Signal (double sell)
12:40 PM VXAlgo NQ X1 Sell Signal
📰 News Highlights
S&P 500 closes at a new record high.
🔑 Key Levels for Tomorrow
Above 6410 = Remain Bullish
Below 6390 = Bearish

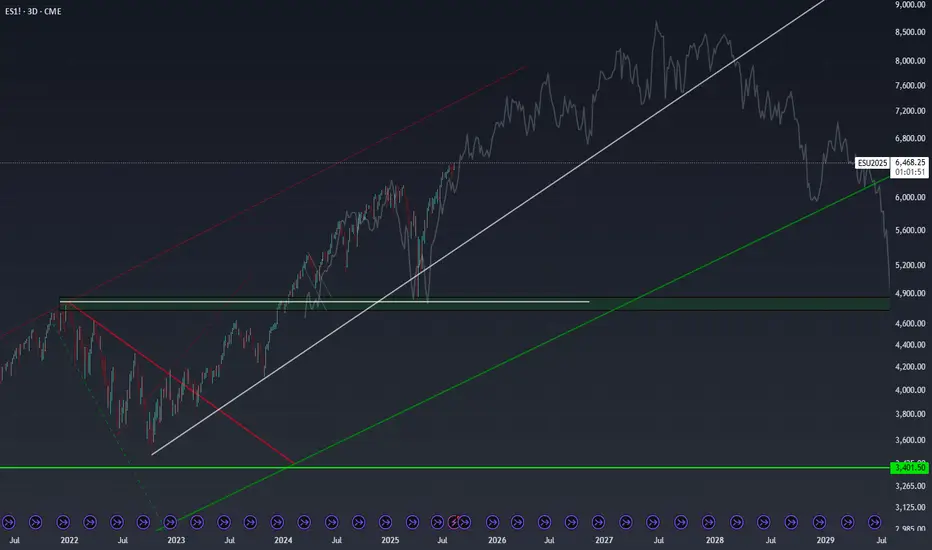
Are We Replaying the Dot Com Era?I’m completely unbiased here - more so curious - but today’s S&P 500 setup looks eerily similar to the late 1990s. In 1996 and 1997, the index posted back-to-back gains of over 20%, just as 2023 and 2024 have done. Then, in 1998, we saw a sharp 20% pullback - much like the one we’ve had in April of 2025. If you overlay that late-’90s fractal on today’s chart, the trajectory points to an S&P 500 level near 8,200 by early 2027.
The bullish case practically writes itself: strong GDP growth, resilient corporate earnings, AI-driven productivity gains, a still-accommodative liquidity backdrop, and investors willing to pay up for growth narratives—just as they did in the dot-com era. The “there is no alternative” (TINA) mentality toward equities was alive then, and it’s alive now. If the trend holds, the next couple of years could deliver staggering upside.
That said, it’s purely an observation - not a prediction. A decisive break below the key rising support trendlines would negate this bullish scenario and shift me to a cautious or neutral stance. Until then, the pattern is worth keeping an eye on.
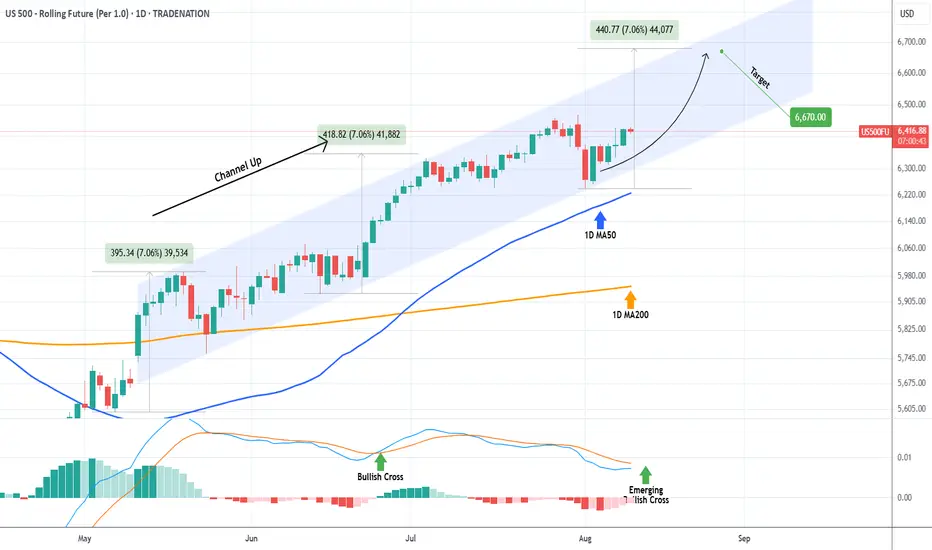
S&P500 Channel Up going straight to 6670.The S&P500 index (SPX) has been trading within a 3-month Channel Up since the May 12 candle. All of this time, it has been supported by the 1D MA50 (blue trend-line) and as long as it holds, the new Bullish Leg is expected.
The last two rose by +7.06%, and ahead of a new 1D MACD Bullish Cross, that gives us a medium-term Target of 6670.
-------------------------------------------------------------------------------
** Please LIKE 👍, FOLLOW ✅, SHARE 🙌 and COMMENT ✍ if you enjoy this idea! Also share your ideas and charts in the comments section below! This is best way to keep it relevant, support us, keep the content here free and allow the idea to reach as many people as possible. **
-------------------------------------------------------------------------------
Disclosure: I am part of Trade Nation's Influencer program and receive a monthly fee for using their TradingView charts in my analysis.
💸💸💸💸💸💸
👇 👇 👇 👇 👇 👇
S&P 500 (ES1!): Bullish! Look For Valid Buy Setups!In this video, we will analyze the following FX market for the week of Aug 11 - 15h:
S&P 500 (ES1!)
The S&P 500 rose Friday to close the week strong on a busy week of tariff updates and good earnings.
There is no reason to consider selling.
Wait for pullbacks to FVGs for high probability buys. Look for IRL to ERL, and repeat.
Enjoy!
May profits be upon you.
Leave any questions or comments in the comment section.
I appreciate any feedback from my viewers!
Like and/or subscribe if you want more accurate analysis.
Thank you so much!
Disclaimer:
I do not provide personal investment advice and I am not a qualified licensed investment advisor.
All information found here, including any ideas, opinions, views, predictions, forecasts, commentaries, suggestions, expressed or implied herein, are for informational, entertainment or educational purposes only and should not be construed as personal investment advice. While the information provided is believed to be accurate, it may include errors or inaccuracies.
I will not and cannot be held liable for any actions you take as a result of anything you read here.
Conduct your own due diligence, or consult a licensed financial advisor or broker before making any and all investment decisions. Any investments, trades, speculations, or decisions made on the basis of any information found on this channel, expressed or implied herein, are committed at your own risk, financial or otherwise.

NQ. Market Efficiency Paradigm. Weekly Outlook 10.08.2025, CME_MINI:NQ1!
Covered the daily and hourly order flow.

Day 5 — Trading Only S&P Futures — +$169, Managing the GrindWelcome to Day 5 of Trading Only S&P Futures!
Today I made +$169 trading ES futures. I was busy so mostly set bracket orders at major levels and let them do their work. The market was a nonstop grind upward, making trading a bit slow.
In hindsight, there was an A+ setup with a triple buy signal and market structure alignment that I wish I had sized heavier on to finish earlier.
📈 What you’ll learn
Using bracket orders to trade during busy days
Recognizing A+ setups with triple buy signals
Managing slow grinding markets with discipline
Key support and resistance levels to watch
⏰ Timestamps
0:00 — Intro & Day 5 Overview
0:30 — Trade Thoughts & Bracket Order Strategy
1:30 — VX Algo Signal Recap
2:30 — Market News Impact
3:00+ — Key Levels for Tomorrow
🔔 VX Algo Signals (9:30am – 2pm EST)
9:35 AM Market Structure flipped bullish on VX Algo X3!
10:50 AM VXAlgo NQ X1 Sell Signal
11:50 AM VXAlgo NQ X1 Buy Signal (triple buy)
📰 News Highlights
S&P 500 rises to end the week, Nasdaq hits a new record as Apple shares rally.
🔑 Key Levels for Tomorrow
Above 6367 = Remain Bullish
Below 6334 = Bearish

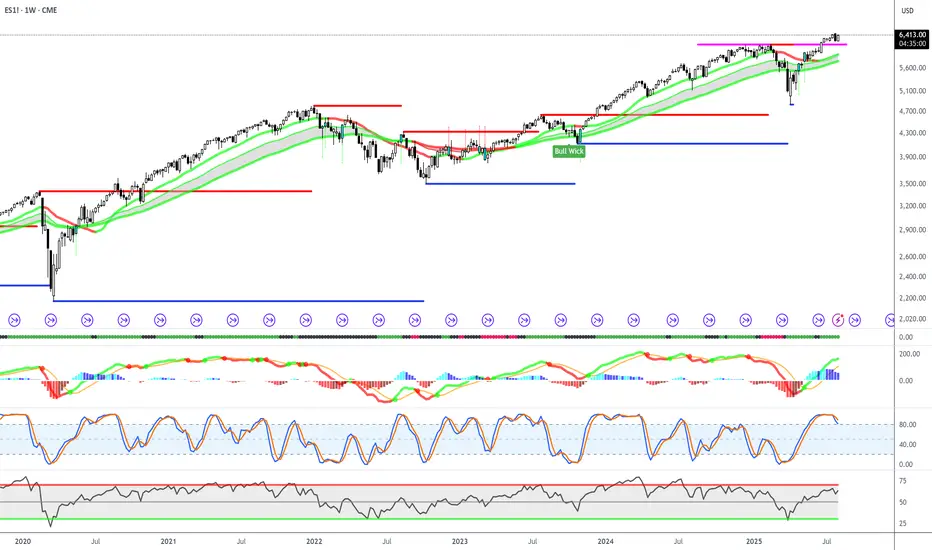
Review S&P 500 futures weekly chart - 8/8/2025Price is Knocking on the Door of All-Time Highs
The bulls are back in control. Price is pushing above the 6,400 magenta resistance, a level that has capped rallies before — and we’re now testing it head-on. The uptrend from the late-2022 low remains strong, with price riding comfortably above the green moving average ribbon like a surfer on a perfect wave.
The last big pullback in early 2024? It was a clean bounce off the 4,000–4,100 blue support zone, marked by a textbook "Bull Wick" reversal candle. That move lit the fuse for a powerful rally, and the setup now has a similar feel.
Key Levels I’m Watching
Resistance: 6,400 (magenta) – in play right now.
Support: 5,600 (red), 4,300 (blue), and a deeper 3,800 zone (blue).
History shows that breakouts above major resistance here have triggered multi-week runs.
The Indicator Story
MACD: Bullish crossover forming, histogram shifting into positive territory → momentum is building.
Stochastic RSI: Tapped overbought and curling slightly down → short-term cooling possible.
RSI: Near 70, still in bullish territory and not yet screaming overbought.
The Bigger Picture
On the weekly chart, the trend is undeniably strong. Price is above all major moving averages, and momentum is on the bulls' side.
However, with multiple oscillators sitting high, the market might need to catch its breath — either through a small pullback or sideways consolidation — before launching into the next leg higher.
Bottom Line
The breakout is here, but confirmation is key. A strong push and close above 6,400 could open the door to another sustained rally. If the breakout fails, I’ll be watching the 5,600–5,400 range for signs of buyer defense.
Bulls and Bears zone for 08-08-2025ETH session has rallied to 61.8 Fibonacci level of yesterday's RTH session. Any test of ETH session High could provide direction for the day.
Level to watch: 6384 --- 6386

Day 4 — Trading Only S&P Futures — +$207, Patience Pays OffWelcome to Day 4 of Trading Only S&P Futures!
After two tough losing days, I took a morning yoga session to clear my mind and approach the market calmly. I started trading late but found a strong A+ setup near 6355, aligned with a major gamma zone and RSI signals, which led to a $200+ profit.
📈 What you’ll learn
The importance of mindset and mental clarity in trading
How to identify strong setups using market structure and gamma zones
Reading RSI on multiple timeframes for confirmation
Managing risk and knowing when to call it a day
⏰ Timestamps
0:00 — Intro & Day 4 Overview
0:30 — Mindset Reset & Trade Recap
1:30 — VX Algo Signal Recap & Setup Breakdown
3:00 — Market News & Impact
3:30 — Key Levels for Tomorrow
4:00 — Closing Thoughts & Next Steps
🔔 VX Algo Signals (9:30am – 2pm EST)
9:39 AM Market Structure flipped bullish on VX Algo X3!
11:20 AM VXAlgo ES X1 Buy signal (triple buy)
11:52 AM VXAlgo ES X1 Buy signal
12:40 PM VXAlgo ES X1 Sell signal
📰 News Highlights
U.S. jobless claims rose to 226,000 vs. estimate 221,000, signaling increased layoffs.
🔑 Key Levels for Tomorrow
Above 6332 = Remain Bullish
Below 6315 = Bearish

Day 3 — Trading Only S&P 500 FuturesDay 3 — Trading Only S&P Futures
Daily P/L: -142.87
Sleep: 7 hours
Emotions: Headache & stress from the morning
:thought_balloon: Today’s Trade thoughts:
I made a typo when i was putting some orders in from last night that triggered and started the day -300 so I spent most of today just grinding it back again.
I think going forward, I am going to make a rule to limit myself of only doing 2 MES MAX during night time if i plan to put orders in because it really sadden the mood when you start the day negative.
Overall, today's trading day wasn't that bad, we had bullish structure and AAPL event that carried the market up. I took some shorts at 6355 that didn't work out but eventually made money at the end of the day as i shorted 6375 zones. I have noticed that** max Gamma levels don't truly settle until 11am. **
:bell:News Highlights:
*TRUMP TO IMPOSE ADDITIONAL 25% TARIFF ON GOODS FROM INDIA
:bar_chart: VX Algo Signals (9:30am – 2pm EST):
9:30 AM Market Structure flipped bullish on VX Algo X3! @everyone*
10:20 AM VXAlgo NQ X1 Sell Signal
11:00 AM Market Structure flipped bullish on VX Algo X3!
11:40 AM VXAlgo ES X1 Sell Signal
12:20 PM VXAlgo ES X1 Sell Signal (double sell)
1:40 PM VXAlgo NQ X1DD Buy Signal (double buy)
:chart_with_upwards_trend: Key Levels for Tomorrow:
Above 6332 = Remain Bullish
Below 6315 = Bearish

Day 2 — Trading Only S&P Futures — -$100, Grinding Back from Los Day 2 — Trading Only S&P Futures
Daily P/L: -100
Sleep: 8 hours
Emotions: Good
:thought_balloon: Today’s Trade thoughts:
I rushed into a trade thinking 6330 was going to be a good area of support to buy and oversized my position going 5 mes deep in my first trade and adding 5 more at the 48 min MOB at 6325 and got stopped out at the bottom down -400 and pretty much spent the rest of the day grinding back up.
Overall market seem to have rejected the higher timeframe resistance and deciding which direction to go.
:bell:News Highlights:
U.S. STOCKS END LOWER, VIX JUMPS AFTER WEAK ISM SERVICES DATA
:bar_chart: VX Algo Signals (9:30am – 2pm EST):
— 9:30 AM VXAlgo ES X1 Buy signal
— 9:40 AM VXAlgo NQ X1 Buy Signal
— 9:48 AM Market Structure flipped bullish on VX Algo X3!
— 11:00 AM VXAlgo ES X1 Buy signal (triple buy signal)
— 12:50 PM VXAlgo NQ X1DD Sell Signal
— 1:00 PM Market Structure flipped bullish on VX Algo X3!
— 1:30 PM VXAlgo NQ X1DD Buy Signal**
:chart_with_upwards_trend: Key Levels for Tomorrow:
Above 6332 = Bullish
Below 6310 = Bearish

NASDAQ100 15MIN CHART FROM SMAS TO NEW LOWNasdaq100 at 10 and 15min chart touches the sma600 and the sma800 so as in many other cases before, odds are are more that it will fall from here to a new low
