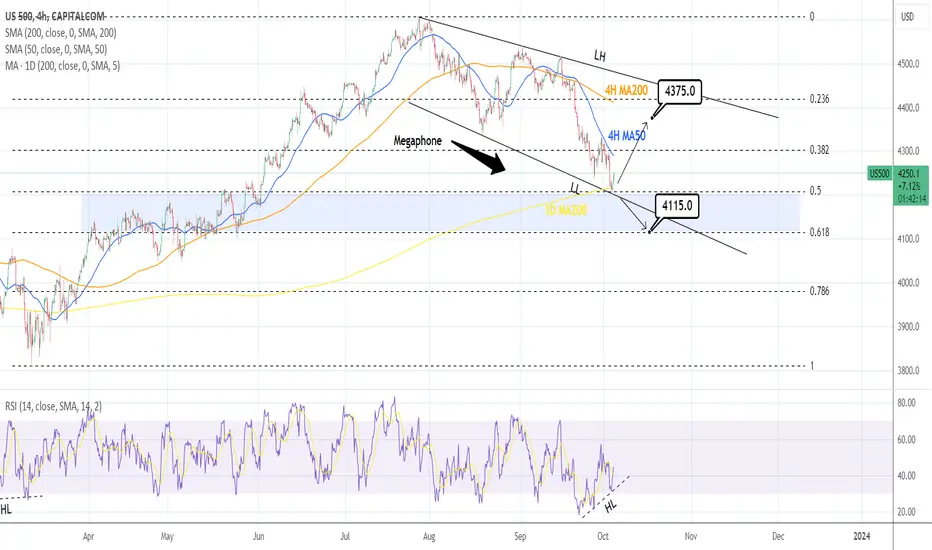
S&P500: Megaphone bottom buy.The S&P500 is technically oversold on the 1D timeframe (RSI = 32.251, MACD = -54.210, ADX = 44.088) but is gathering some bullish momentum on 4H (RSI = 41.446) as the price hit the 1D MA200 and bottom of the Megaphone to form a LL. In addition, it hit the 0.5 Fibonacci level from March's low. This has high chances of evolving into a technical LH rebound, especially with the 4H RSI on a Bullish Divergence. If it holds, we are long, targeting the 4H MA200 (TP = 4,375). If it fails, we will short, targeting the 0.618 Fibonacci level (TP = 4,115).
## If you like our free content follow our profile to get more daily ideas. ##
## Comments and likes are greatly appreciated. ##
Es1
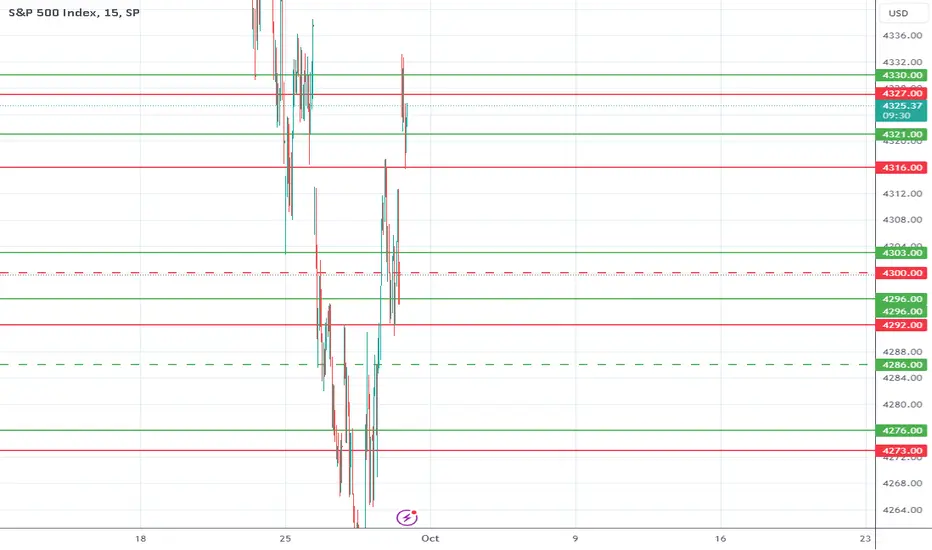
Trading Plans for WED. 10/04 - Bad News Good News?S&P 500 INDEX MODEL TRADING PLANS for WED. 10/04
The lower-than-expected ADP numbers seem to be giving some hope that the bad news could soften the rising yields and the Fed going forward. The yields have already retreated this morning, and the index is trying to find a floor and rebound. Since our published trading plans two weeks ago pointing out that week's 4505 level as potential top for the near term, the market has been in a free fall mode. Our models indicate 4310 as the level to close above for the current bearish bias to be negated.
Any hope derived from bad/disappointing economic numbers could eventually morph into a concern for the economy and the potential recession talk down the road. Until a clear directional bias emerges to the bullish side, trading with technicals and confirmations appears the prudent way, rather than trading on fundamentals.
Aggressive, Intraday Trading Plans:
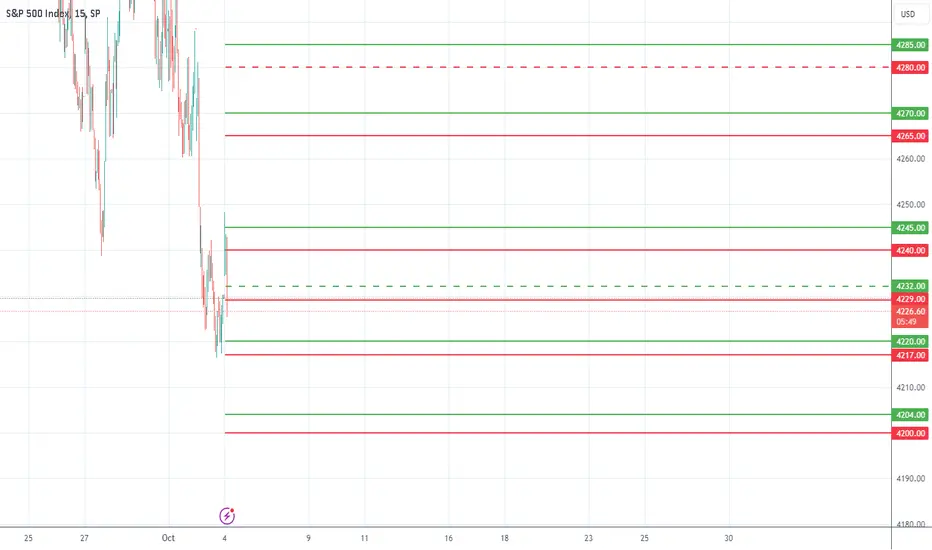
For today, our aggressive intraday models indicate going long on a break above 4285, 4270, 4245, 4220, or 4204 with a 9-point trailing stop, and going short on a break below 4265, 4240, 4229, 4217, or 4200 with a 9-point trailing stop.
Models indicate explicit long exits on a break below 4280, and explicit short exits on a break above 4232. Models also indicate a break-even hard stop once a trade gets into a 4-point profit level. Models indicate taking these signals from 10:01am EST or later.
By definition the intraday models do not hold any positions overnight - the models exit any open position at the close of the last bar (3:59pm bar or 4:00pm bar, depending on your platform's bar timing convention).
To avoid getting whipsawed, use at least a 5-minute closing or a higher time frame (a 1-minute if you know what you are doing) - depending on your risk tolerance and trading style - to determine the signals.
(WHAT IS THE CREDIBILITY and the PERFORMANCE OF OUR MODEL TRADING PLANS over the LAST WEEK, LAST MONTH, LAST YEAR? Please check for yourself how our pre-published model trades have performed so far! Seeing is believing!)
NOTES - HOW TO INTERPRET/USE THESE TRADING PLANS:
(i) The trading levels identified are derived from our A.I. Powered Quant Models. Depending on the market conditions, these may or may not correspond to any specific indicator(s).
(ii) These trading plans may be used to trade in any instrument that tracks the S&P 500 Index (e.g., ETFs such as SPY, derivatives such as futures and options on futures, and SPX options), triggered by the price levels in the Index. The results of these indicated trades would vary widely depending on the timeframe you use (tick chart, 1 minute, or 5 minute, or 15 minute or 60 minute etc.), the quality of your broker's execution, any slippages, your trading commissions and many other factors.
(iii) These are NOT trading recommendations for any individual(s) and may or may not be suitable to your own financial objectives and risk tolerance - USE these ONLY as educational tools to inform and educate your own trading decisions, at your own risk.
#spx, #spx500, #spy, #sp500, #esmini, #indextrading, #daytrading, #models, #tradingplans, #outlook, #economy, #bear, #yields, #stocks, #futures, #inflation, #recession, #softlanding, #higher4longer, #higherforlonger, #adp
US is running a clinic on how to self-inflict financial woundsEarlier today I was on a conference call with traders examining the index price patterns and discussing the initial price action of The SP500 (INDEXSP: .INX) and the Nasdaq (INDEXNASDAQ: .IXIC) off their July highs. Currently my company is forecasting we revisit, and ultimately breach the October 2022 lows sometime in the first half of 2024. However, what the catalysts are to get us there is speculation. A black swan event of such some stature would need to unfold.
Mid conference call one of the attendees’ types into the zoom chat box, "McCarthy was just removed as speaker!" On the call was a collective...whoa!
I could understand some of you reading this article would say, so what! The US congress has been dysfunctional for some time now. Unfortunately, I would agree and could not find fault with such apathy. However, consider the unintended consequences of such a historic action. Never has a US speaker of the house been removed in such fashion.
What could develop into unintended consequences?
Which such acrimony and division in the lower chamber how can the house agree on anything? The hill conservatives in the house want to die on is the growing national debt. Whether that is disingenuous or not is not the point of this article. I'll let the political pundits argue that. I want to keep this article focused on what is directly related to the US markets.
Government Funding
Through some rare bipartisanship we averted a government shut down just this past weekend. Leading up to this weekend, the news media had all but written the obituary for a funded government through regular order. However, the legislation only funded the government for 47 days. That means it's possible we're back to worrying about a funded US government next month.
Rating Agencies
I have to admit when Fitch downgraded the credit rating of US government debt in August, I was skeptical of that decision. In retrospect, I now understand with all the self-inflicted uncertainty. However, do we need to now worry about Moodys and Standard & Poors. What is the consequence to interest rates if the US credit rating becomes under assault.
Interest Rates
The US markets have yet to acknowledge high interest rates are a structural headwind for company earnings and by extension, the market as a whole. Case in point, the below chart shows the yield on the 10y treasury.
10-year US Treasury Chart
Today, yields are higher than when at the October 2022 lows. The uncertainty created today by historically removing a US speaker of the house does not scream the US should be getting a lower rate on it’s debt. No, it most certainly means the opposite.
Mortgage Rates
12% of US GDP is housing. Aside from Fed action, if rates now go up because of the added uncertainty, we could easily go from positive to negative GDP. No US sector is more rate sensitive than housing.
Consumer Spending
If you thought housing at 12% of GDP was large, the consumer represents 70%. From mortgages, to credit card debt, the consumer was already starting to slow. Higher rates due to uncertainty will cause the consumer recoil, and that's the ballgame.
I could go on about current labor strikes in America and how that could change the employment outlook and the economy on a dime. I could discuss in depth the quantitative tightening action of the federal reserve. All concerns we're currently trying to weigh its impact on the economy.
Now we have to deal with this new added uncertainty. It appears in the US we know how to run a clinic on self-inflicted wounds.

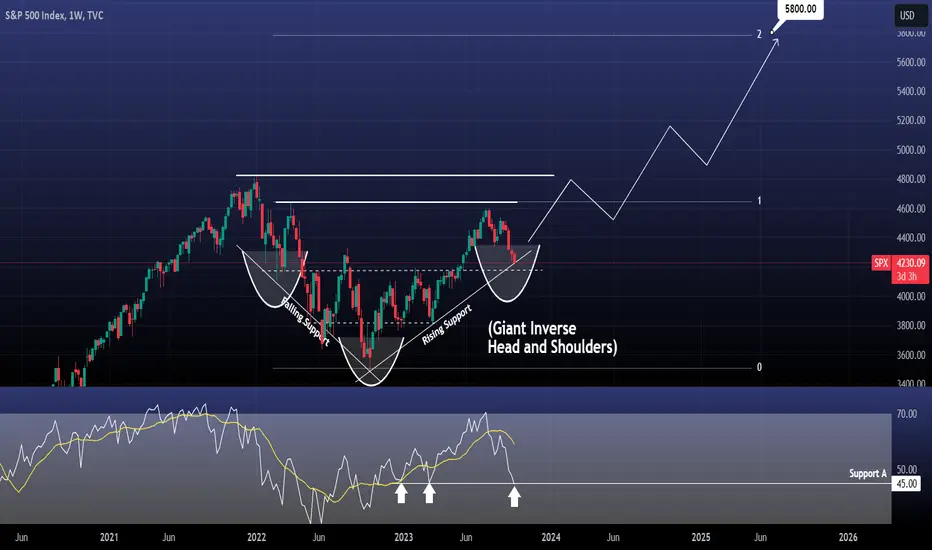
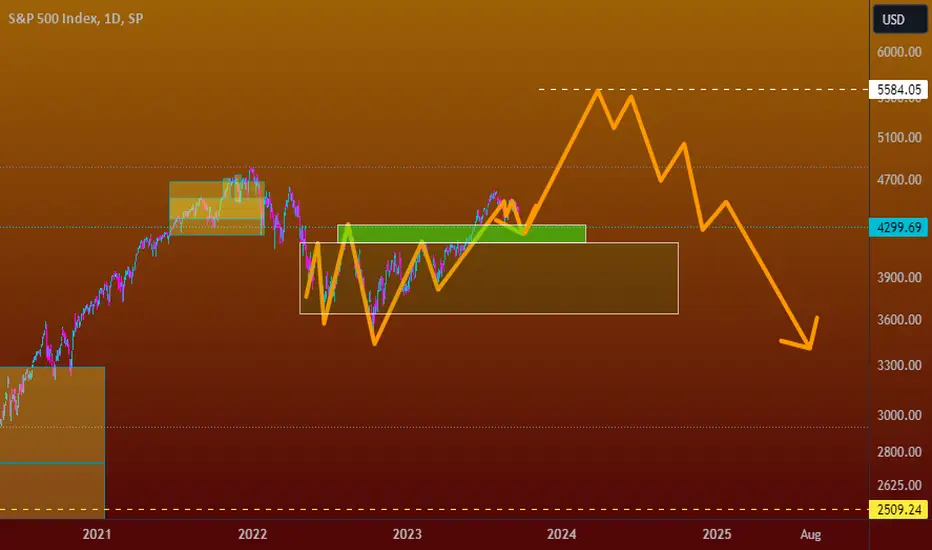
S&P500 targeting 5800 based on this overlooked pattern?The S&P500 index / US500 is testing the Rising Support of Higher Lows this week, stemming directly from the bottom of the 2022 correction.
A symmetric Support is just underneath and this pattern has various (dashed or bold) stemming from the Bear Cycle.
What many may fail to see though is a giant Inverse Head and Shoulders pattern that is forming the Right Shoulder.
If that's the case, then S&P can target the Fibonacci 2.0 level at 5800 as early as mid 2025!
Too much to ask??
Follow us, like the idea and leave a comment below!!
Rising Yields Making a Rebound Less LikelyS&P 500 INDEX MODEL TRADING PLANS for TUE. 10/03
Since our published trading plans two weeks ago pointing out that week's 4505 level as potential top for the near term, the market has been in a free fall mode. Our models indicate 4310 as the level to close above for the current bearish bias to be negated.
The "higher for longer" monetary policy is yet to begin showing its impact on business earnings, and it could take one to two quarters more for us to see the earnings impact - and, hence the analyst forward estimates - which could have some more impact on the market multiples in the short-to-medium term. But, the near term bias will be determined by today's daily close as specified above.
Aggressive, Intraday Trading Plans:
For today, our aggressive intraday models indicate going long on a break above 4310, 4300, 4281, 4373, or 4260 with a 9-point trailing stop, and going short on a break below 4297, 4280, 4264, or 4257 with a 9-point trailing stop.
Models indicate explicit long exits on a break below 4314 or 4288, and explicit short exits on a break above 4265. Models also indicate a break-even hard stop once a trade gets into a 4-point profit level. Models indicate taking these signals from 10:01am EST or later.
By definition the intraday models do not hold any positions overnight - the models exit any open position at the close of the last bar (3:59pm bar or 4:00pm bar, depending on your platform's bar timing convention).
To avoid getting whipsawed, use at least a 5-minute closing or a higher time frame (a 1-minute if you know what you are doing) - depending on your risk tolerance and trading style - to determine the signals.
(WHAT IS THE CREDIBILITY and the PERFORMANCE OF OUR MODEL TRADING PLANS over the LAST WEEK, LAST MONTH, LAST YEAR? Please check for yourself how our pre-published model trades have performed so far! Seeing is believing!)
NOTES - HOW TO INTERPRET/USE THESE TRADING PLANS:
(i) The trading levels identified are derived from our A.I. Powered Quant Models. Depending on the market conditions, these may or may not correspond to any specific indicator(s).
(ii) These trading plans may be used to trade in any instrument that tracks the S&P 500 Index (e.g., ETFs such as SPY, derivatives such as futures and options on futures, and SPX options), triggered by the price levels in the Index. The results of these indicated trades would vary widely depending on the timeframe you use (tick chart, 1 minute, or 5 minute, or 15 minute or 60 minute etc.), the quality of your broker's execution, any slippages, your trading commissions and many other factors.
(iii) These are NOT trading recommendations for any individual(s) and may or may not be suitable to your own financial objectives and risk tolerance - USE these ONLY as educational tools to inform and educate your own trading decisions, at your own risk.
#spx, #spx500, #spy, #sp500, #esmini, #indextrading, #daytrading, #models, #tradingplans, #outlook, #economy, #bear, #yields, #stocks, #futures, #inflation, #recession, #softlanding, #higher4longer, #higherforlonger

Are the Bears about to get BOLD?In my latest installment of the repeating Sentiment chart, we get a front row seat on how trader sentiment ebbs and flows with price action. Once we hit the target of 4172-4180, that will be a function of the bearish thesis getting aggressive.
A complete unwinding of the utter junk spewed on CNBC a month ago. New highs possible? Soft landing? The magnificent seven? I stand by the comment I made in my trading room yesterday... CNBC is the most detrimental content I professional trader can ingest.
Why is Tom Lee not on CNBC today? LOL...
Stay safe out there.
Chris

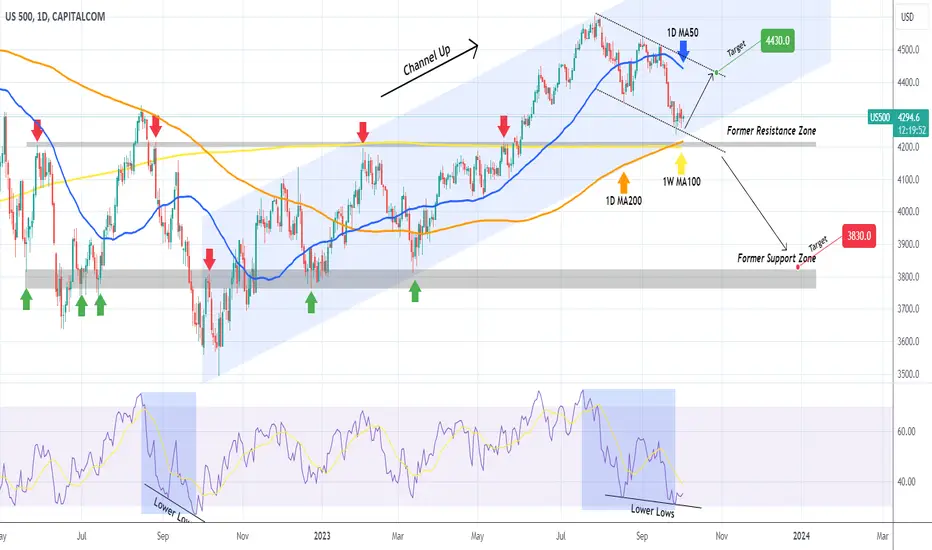
S&P500 It is very important that this Support Cluster holds.The S&P500 (SPX) is testing the bottom (Higher Lows trend-line) of the 12-month Channel Up pattern. It is vital for the uptrend that the following Support Cluster holds, as if broken, the next Demand/ Support Zone is seen considerably lower, in the low 3800s.
Back to the Support Zone. Besides the bottom of the Channel Up, we have the 1D MA200 (orange trend-line) moving parallel to that and has been unbroken since March 24. More importantly, the 1W MA100 (yellow trend-line) a former Resistance turned into Support after May's break-out, is marginally below the 1D MA200 and on a former Resistance Zone, which in the past 18 months, only broken twice.
As long as the price closes 1D candles above this critical Support cluster, we expect a short-term (at least) rise to test the top of the Channel Down and the 1D MA50 (blue trend-line) at 4430. If the Support fails, expect a greater and perhaps quicker/ more aggressive decline towards 3830 and the former Support Zone.
Notice how the 1D RSI pattern resembles the August - September 2022 correction.
-------------------------------------------------------------------------------
** Please LIKE 👍, FOLLOW ✅, SHARE 🙌 and COMMENT ✍ if you enjoy this idea! Also share your ideas and charts in the comments section below! **
-------------------------------------------------------------------------------
💸💸💸💸💸💸
👇 👇 👇 👇 👇 👇
$spx potencial MM sell Modelset up confirms on closes above 4608 and invalidates on closes below 4043
X Marks the SpotMister X marked the spot.
He did it again in January of 2023.
And apparently, he called it again.
Unfortunately for the markets, mister X has a double identity.
Mr. ❎ = Mr. ➡️
(mister x is my homie mister right)
Classic technical analysis proves them right.
1. Volatility
VIX is compressing, forming a triple bottom. (amongst other taboo signals)
2. Volume
Stock market growth commonly shows volume divergence.
ES1! Volume helps us see a clearer picture on SPX.
After each instance, pain followed. Will this time be different?
I may follow up to this idea with further information. I may not.
Either way, be careful on who you trust (and when).
One thing may be for certain. The time will come when X will miss the spot.
Tread lightly, for this is hallowed ground.
-Father Grigori
P.S. For more information on volatility, you may take a look at the idea I posted a while ago.
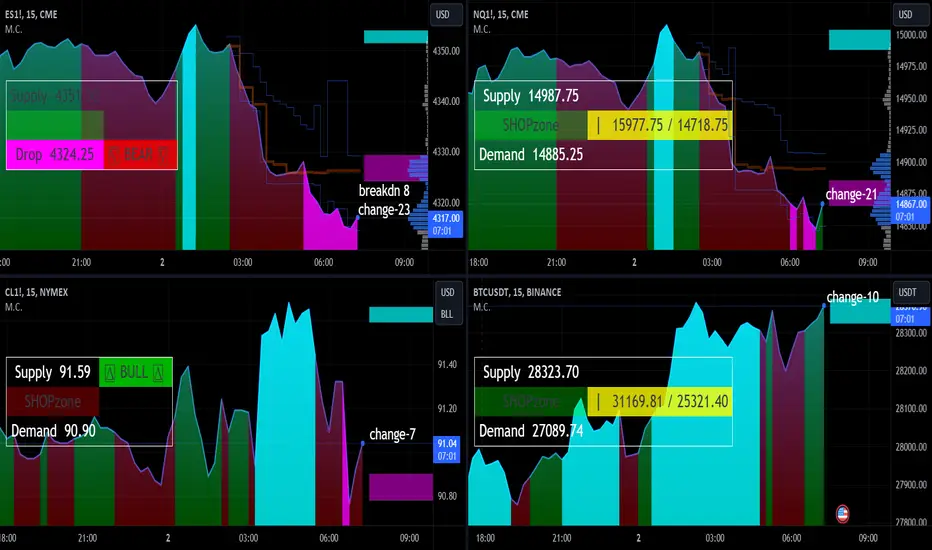
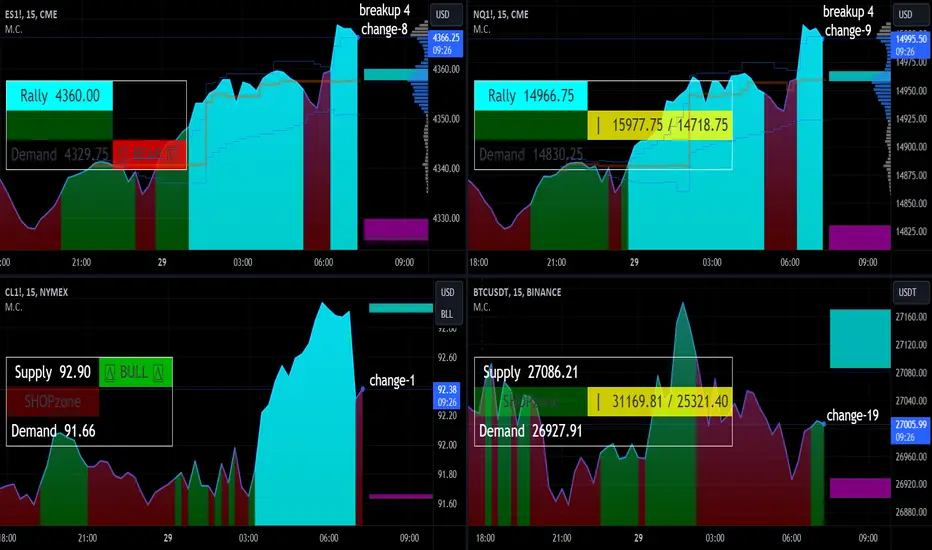
Day Trade Market Condition oct 02, 2023Day Trade Market Condition oct 02, 2023
levels for NQ ES CL BTC
watch the table left side for trade, right side for trend
S&P500 Will the 1week MA50 and Fib 0.5 hold? 2008 and 2000 show The S&P500 / US500 opened yet another week on red. Last week it closed on a 3 week red streak and is approaching the 1week MA50 and MA100 as well as the Fibonacci 0.5 level.
The Fib 0.5 and 1week MA50 in particular are of high importance as they are what seperated the 2022 stock market correction from the heavy Bear Cycles of 2008 and 2000.
As you can see both the mortgage crisis and dotcom bubble after they crossed under the 1week MA200 and rebounded, they got rejected on the 1week MA50 / Fib 0.5 Resistance cluster and didn't give the extension that we have in 2023 so far.
Often when a Resistance level breaks, the market tends to test it as a Support in order to discover demand momentum. Do you think they will hold?
Follow us, like the idea and leave a comment below!!

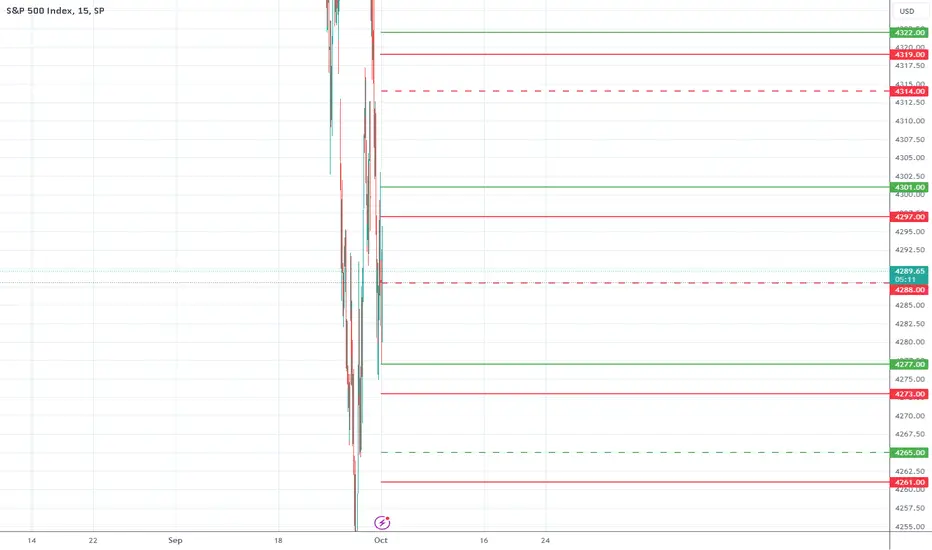
No Rebound In Sight While Below 4320S&P 500 INDEX MODEL TRADING PLANS for MON. 10/02
Since our published trading plans two weeks ago pointing out that week's 4505 level as potential top for the near term, the market has been in a free fall mode. Our models indicate 4320 as the level to close above for the current bearish bias to be negated. This morning, the index is attempting to test the 4320 level. If the daily close is going to be above 4320, then our models will negate the bearish bias and initiate a mildly bullish bias.
The "higher for longer" monetary policy is yet to begin showing its impact on business earnings, and it could take one to two quarters more for us to see the earnings impact - and, hence the analyst forward estimates - which could have some more impact on the market multiples in the short-to-medium term. But, the near term bias will be determined by today's daily close as specified above.
Aggressive, Intraday Trading Plans:
For today, our aggressive intraday models indicate going long on a break above 4322, 4301, or 4277 with a 9-point trailing stop, and going short on a break below 4319, 4297, 4273, or 4261 with a 9-point trailing stop.
Models indicate explicit long exits on a break below 4314 or 4288, and explicit short exits on a break above 4265. Models also indicate a break-even hard stop once a trade gets into a 4-point profit level. Models indicate taking these signals from 10:01am EST or later.
By definition the intraday models do not hold any positions overnight - the models exit any open position at the close of the last bar (3:59pm bar or 4:00pm bar, depending on your platform's bar timing convention).
To avoid getting whipsawed, use at least a 5-minute closing or a higher time frame (a 1-minute if you know what you are doing) - depending on your risk tolerance and trading style - to determine the signals.
(WHAT IS THE CREDIBILITY and the PERFORMANCE OF OUR MODEL TRADING PLANS over the LAST WEEK, LAST MONTH, LAST YEAR? Please check for yourself how our pre-published model trades have performed so far! Seeing is believing!)
NOTES - HOW TO INTERPRET/USE THESE TRADING PLANS:
(i) The trading levels identified are derived from our A.I. Powered Quant Models. Depending on the market conditions, these may or may not correspond to any specific indicator(s).
(ii) These trading plans may be used to trade in any instrument that tracks the S&P 500 Index (e.g., ETFs such as SPY, derivatives such as futures and options on futures, and SPX options), triggered by the price levels in the Index. The results of these indicated trades would vary widely depending on the timeframe you use (tick chart, 1 minute, or 5 minute, or 15 minute or 60 minute etc.), the quality of your broker's execution, any slippages, your trading commissions and many other factors.
(iii) These are NOT trading recommendations for any individual(s) and may or may not be suitable to your own financial objectives and risk tolerance - USE these ONLY as educational tools to inform and educate your own trading decisions, at your own risk.
#spx, #spx500, #spy, #sp500, #esmini, #indextrading, #daytrading, #models, #tradingplans, #outlook, #economy, #bear, #yields, #stocks, #futures, #inflation, #recession, #softlanding, #higher4longer, #higherforlonger
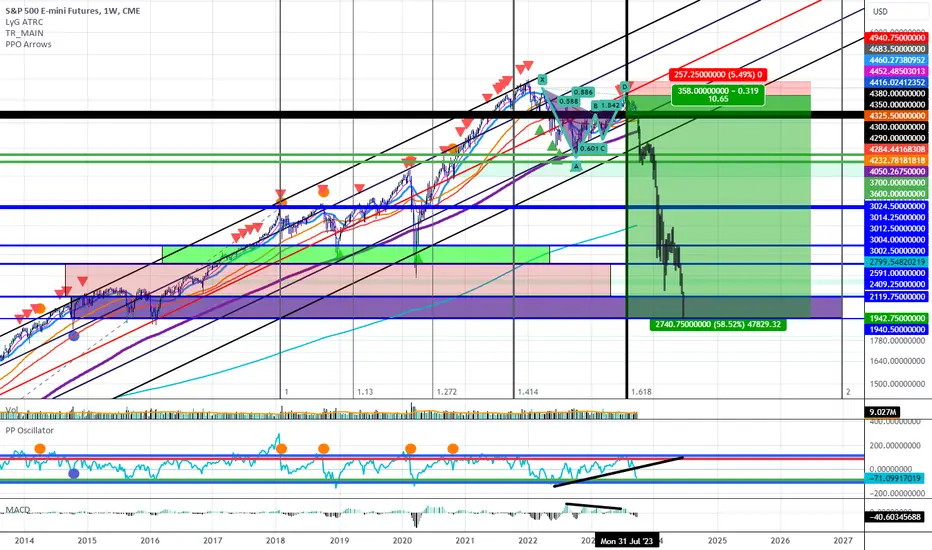
/ES Is Set Up to Break Below The Equidistant ChannelBack in August, the SPX traded at the PCZ of a Bearish Butterfly with some Cypher Confluence and I played it through SPXL, a 3x Return ETF via puts, as seen here:
At the same time, the E-mini futures were trading at the PCZ of a Potential Deep Gartley which we now know to be a little bit more than Potential. Since then, it has broken through Local Supports and has formed a small intraweek trading range that seems to have been working on a redistributive price action over the last few weeks, as week by week, Positive Interest has continuously weakened and Negative Interest has gotten more and more aggressive. If this trend continues into the upcoming trading session, we will likely break below the range this week and target the levels of $3700-$3600, which would take us below all the Demand Lines of the Equidistant Channel. This would then set the price up to begin a bigger Bearish move that could end up taking it all the way back down to the 2020 and 2016 support levels.
Day Trade Market Condition sep 29, 2023Day Trade Market Condition sep 29, 2023
levels for NQ ES CL BTC
watch the table left side for trade, right side for trend
note last two day Dynamic Volume Profiles
Trading Plans for FRI. 09/29 - Rebounding to Key Level?S&P 500 INDEX MODEL TRADING PLANS for FRI. 09/29
Since our published trading plans last week pointing out that week's 4505 level as potential top for the near term, the market has been in a free fall mode. Our models indicate 4340 as the level to close above for the current bearish bias to be negated. This morning, the index is attempting to test the 4340 level. If the daily close is going to be above 4340, then our models will negate the bearish bias and initiate a mildly bullish bias for Monday.
The "higher for longer" monetary policy is yet to begin showing its impact on business earnings, and it could take one to two quarters more for us to see the earnings impact - and, hence the analyst forward estimates - which could have some more impact on the market multiples in the short-to-medium term. But, the near term bias will be determined by today's daily close as specified above.
Aggressive, Intraday Trading Plans:
For today, our aggressive intraday models indicate going long on a break above 4330, 4321, 4303, 4296, or 4276 with a 9-point trailing stop, and going short on a break below 4327, 4316, 4292, or 4273 with a 9-point trailing stop.
Models indicate explicit long exits on a break below 4300, and explicit short exits on a break above 4286. Models also indicate a break-even hard stop once a trade gets into a 4-point profit level. Models indicate taking these signals from 10:46am EST or later.
By definition the intraday models do not hold any positions overnight - the models exit any open position at the close of the last bar (3:59pm bar or 4:00pm bar, depending on your platform's bar timing convention).
To avoid getting whipsawed, use at least a 5-minute closing or a higher time frame (a 1-minute if you know what you are doing) - depending on your risk tolerance and trading style - to determine the signals.
(WHAT IS THE CREDIBILITY and the PERFORMANCE OF OUR MODEL TRADING PLANS over the LAST WEEK, LAST MONTH, LAST YEAR? Please check for yourself how our pre-published model trades have performed so far! Seeing is believing!)
NOTES - HOW TO INTERPRET/USE THESE TRADING PLANS:
(i) The trading levels identified are derived from our A.I. Powered Quant Models. Depending on the market conditions, these may or may not correspond to any specific indicator(s).
(ii) These trading plans may be used to trade in any instrument that tracks the S&P 500 Index (e.g., ETFs such as SPY, derivatives such as futures and options on futures, and SPX options), triggered by the price levels in the Index. The results of these indicated trades would vary widely depending on the timeframe you use (tick chart, 1 minute, or 5 minute, or 15 minute or 60 minute etc.), the quality of your broker's execution, any slippages, your trading commissions and many other factors.
(iii) These are NOT trading recommendations for any individual(s) and may or may not be suitable to your own financial objectives and risk tolerance - USE these ONLY as educational tools to inform and educate your own trading decisions, at your own risk.
#spx, #spx500, #spy, #sp500, #esmini, #indextrading, #daytrading, #models, #tradingplans, #outlook, #economy, #bear, #yields, #stocks, #futures, #inflation, #recession, #softlanding, #higher4longer, #higherforlonger
VIX and S&P500 This is why stocks may rise now.Following yesterday's green stock market reaction, we compare on today's analysis VIX (Volatility Index) to the S&P500 (SPX) price action on the 1D time-frame. Our goal is to find clues to how the Volatility Index can affect the stocks.
As you can see, VIX is trading within an Ascending Triangle which 2 days ago got rejected on its top (Higher Highs) trend-line. All this while its Lower Highs trend-line since September 2022 (1 year back) sits right above it. At the same time the S&P500 index found the bottom (Lower Lows trend-line) of its Channel Down (while the Higher Lows trend-line since the October 2022 market bottom sits right below) and on first impression appears to be rebounding. Being negatively correlated, the more VIX drops, i.e. market volatility calms/ decreases, the more likely it is for the stock market to rise, at least for the short-term towards the Channel Down top (similarly VIX to the Triangle's Support).
In order to see it resume the long-term bullish trend, VIX most likely needs to break its Support. It is not unlikely as the market may respect the long-term Lower Highs (similarly Higher Lows for SPX) and hold it as new rejection point, but for the time being we have to keep our perspective on the short-term patterns (Ascending Triangle and Channel Down respectively) until shown otherwise.
-------------------------------------------------------------------------------
** Please LIKE 👍, FOLLOW ✅, SHARE 🙌 and COMMENT ✍ if you enjoy this idea! Also share your ideas and charts in the comments section below! **
-------------------------------------------------------------------------------
💸💸💸💸💸💸
👇 👇 👇 👇 👇 👇
