Es_f
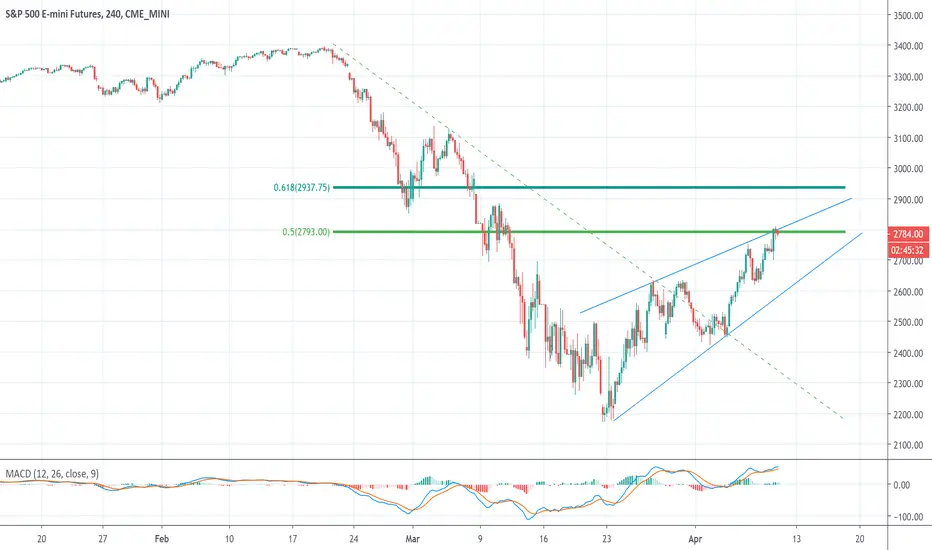
Short ESThe S&P has gone on a monster rally since the March 23rd lows. It has done a great job of convincing everyone that life is going back to normal. This is not the case. It has retraced 50% of the decline and this is a great spot to short it as I believe we will turn down next week to retest (and possibly break the lows) sometime in May.
SPX Analog Pivot High This is an analog with a stretched out 1987. The analog is anchored with the final leg up from 1/31 to 2/19. Today is a major pivot high day according to the analog. This obviously lines up with the indices trading into their respective resistance levels. Whether it’s a higher low, re-test, or lower low, the next major low pivot is 5/14. TVC:SPX AMEX:SPY

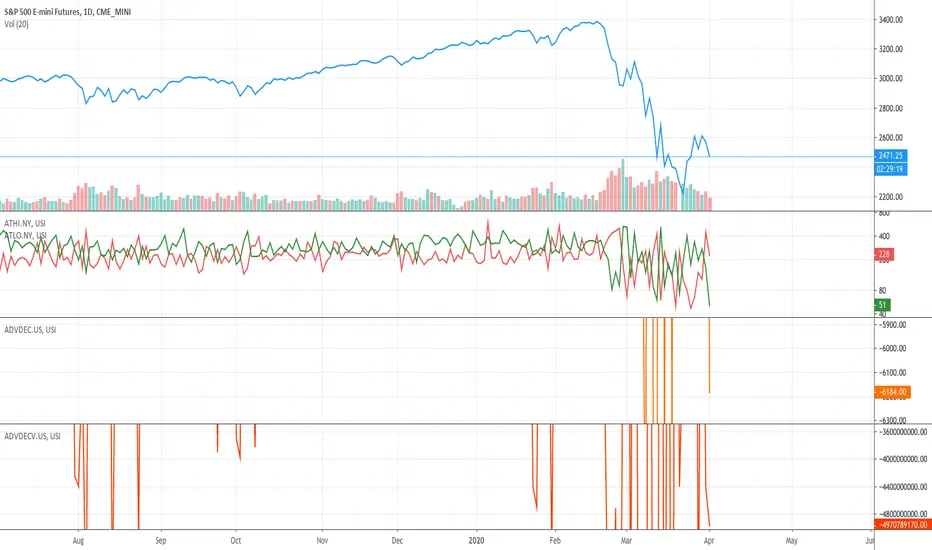
US bonds and market bid ask spreads as market bottom US 15min US bonds and market bid ask spreads as market bottom, please use chart as US 15min chart and not daily chart.

Chart Index ES_F Intraday Reference...Chart Index ES_F Intraday Reference...to put in 1minute scale and leave the daily scale...
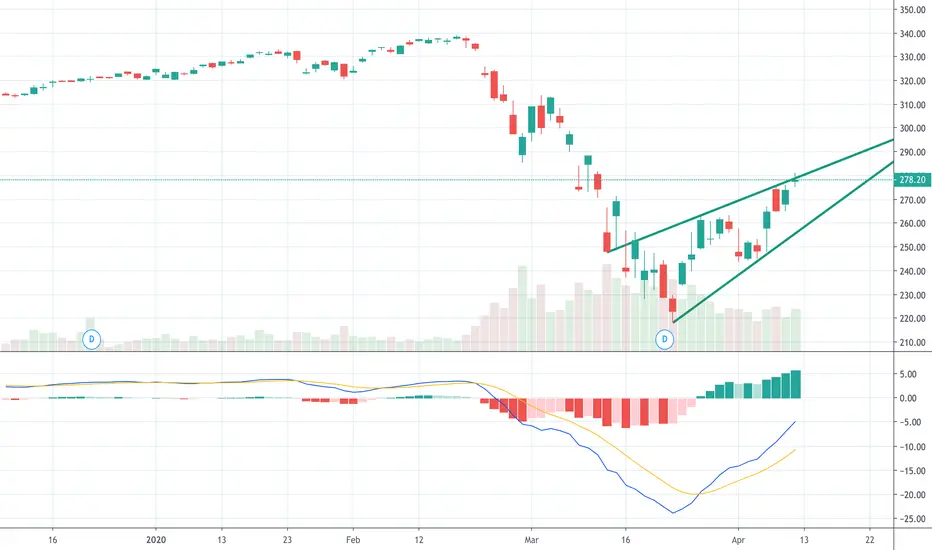
$ES_F Ugly bearish divergence at the key pivot pointFollow me on twitter @jnb_capital for daily updates.

2100 S&P is too obvious to holdAnyone watching current price action for a sensible potential long entry is looking at 2100 and will likely bid the entire zone if we reach there, meaning it will certainly breakdown. I'll be watching for a swing to the clean lows ~1800 at least, nobody knows when this will end.
With the current situation with the virus, I think this move will definitely be sustained until more significant positive developments.
DM for access to private strategy, price is 0.005 BTC

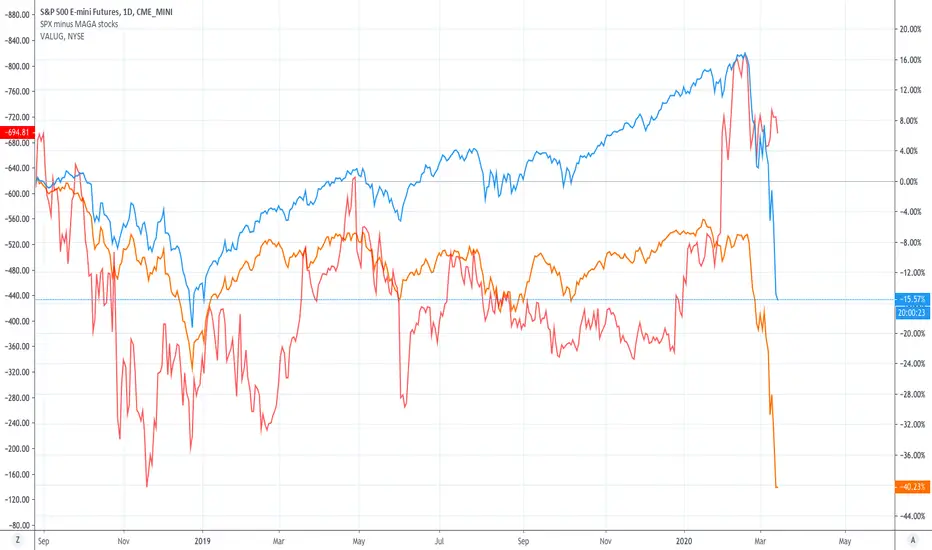
SPX and SPX minus Maga stocks comparisonSPX and SPX minus Maga stocks comparison (Microsoft, Apple, Google and Amazon) and also Value Line Geometric Index (the "invisible" common NYSE stock performance)
Question : Is $ES_F $SPX oversold? A: Daily Yes, Weekly/Monthly not even close.
Wouldn't surprise me to see us bottom around 2300.
SPX ES_F futuresLess than an hour to open, futures are slowly weakening. Stay cautious. Ask yourself, what has changed from yesterday that warrants a rally? Politicians talking, that's all.

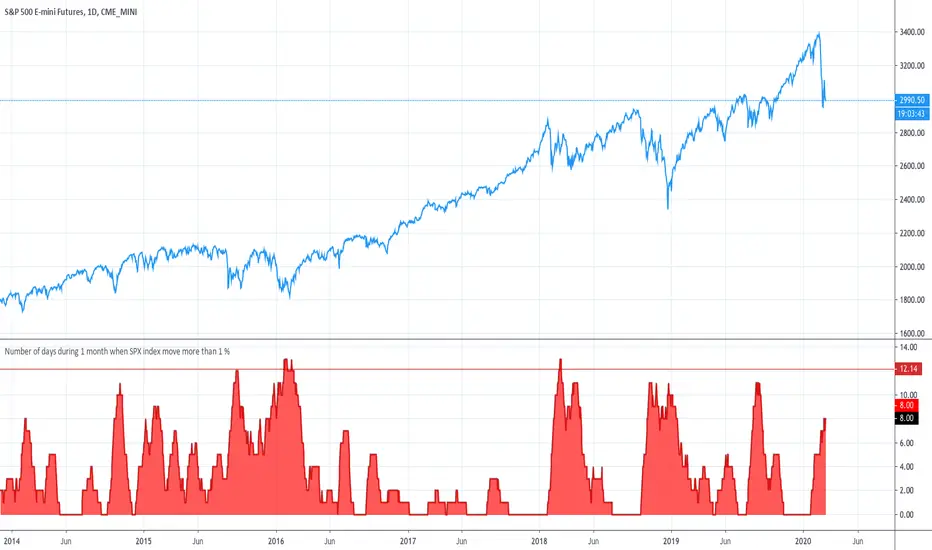
Number of days during 1 month when SPX index move more than 1 %Just for Stats ... Number of days during 1 month when SPX index move more than 1 %
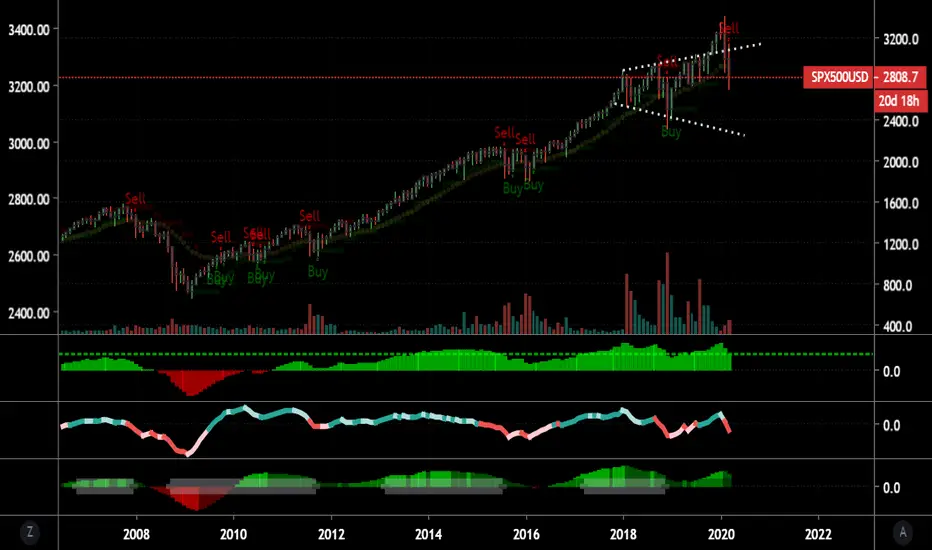
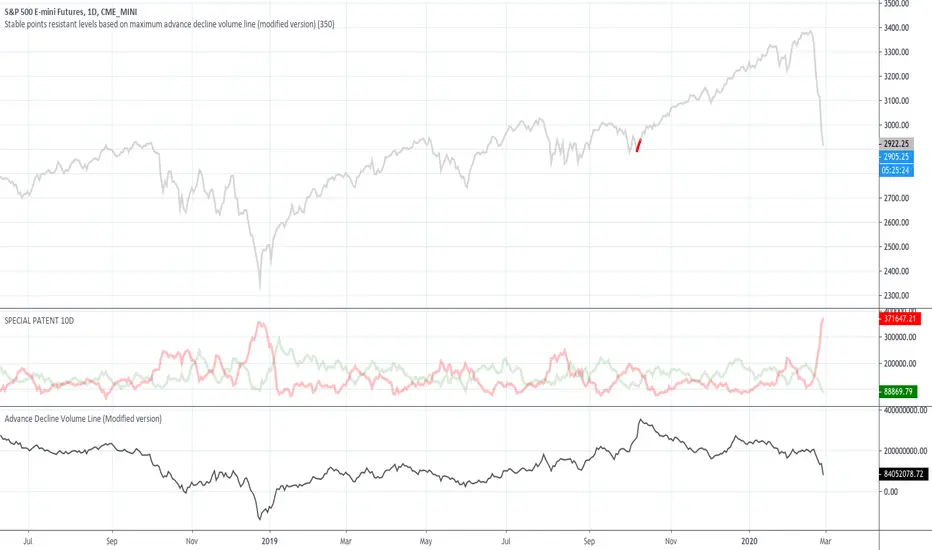
Resistant levels - finding markets bottoms at priori modeFinding markets bottoms - priori mode, important resistance levels signaled at red color in spx index.
SPX - Dont Get Comfortable yet...Nothing to see here.... BTD obviously in effect.... :)
*This is LIFE Advice exclusively, NOT Financial Advice*

Elliott Wave View: S&P Futures ($ES_F) Downside TargetShort term Elliott Wave view in E-mini S&P 500 (ES_F) suggests the Index ended the cycle up from June 3, 2019 low in wave ((3)) at 3397.50 high. The index is correcting that cycle in wave ((4)) as a double correction. Wave A of (W) ended at 3339.50 low. The bounce in wave B ended at 3375 high. It then resumed lower in wave C, which ended at 3213.75 low. The index then bounced higher in wave (X) and ended at 3261.50 high.
Down from wave (X) high, the index resumed lower in wave A of (Y) and ended at 3091 low. The internal subdivision of wave A unfolded as a 5 waves impulse Elliott Wave structure. Wave ((i)) ended at 3220.25 low. It then bounced in wave ((ii)) and ended at 3247.25 high. From there, wave ((iii)) extended lower and ended at 3117.25 low and wave ((iv)) bounce ended at 3158.50 high. The index then resumed lower and ended wave ((v)) at 3091 low. Up from wave A low, wave B bounced higher and ended at 3182 high. Currently, the index is continuing lower in wave C of (Y). Wave ((i)) remains in progress followed by a bounce in wave ((ii)) later. While below 3261.50 high, the bounce in 3,7, or 11 swings is expected to fail. The index can see more downside to complete wave ((4)) correction before upside resumes.

S&P 500 Index Dividend Yield vs US 10 Bond Yield ...S&P 500 Index Dividend Yield vs US 10 Bond Yield ... When S&P 500 Index Dividend Yield outperforms the US 10 Bond Yield usually is a good entry point to buy stocks and sell bonds.

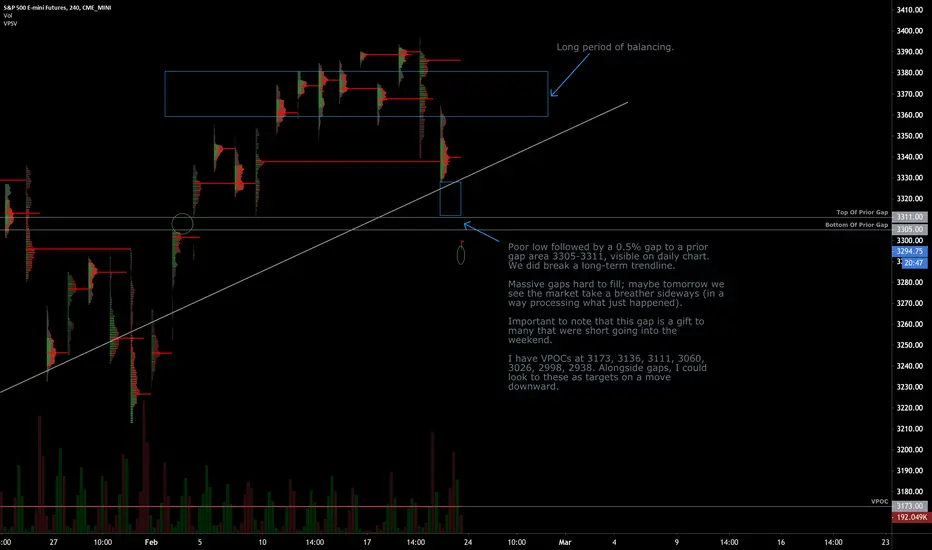
Feb 23 Session Profile | /ES S&P 500 E-Mini FuturesDescription:
Things I'm thinking about tonight.
Points of Interest:
Massive gap, trendline break, location between 20 and 50 moving averages on daily chart (), untested POCs.
Technical:
Poor structure (untested POCs) beneath Sunday's overnight. We had a week of balancing and Friday left a poor low.
Fundamental:
Fed really supportive; manufacturing business outlook has risen to highest levels; housing market hot as home building permits rise; debt levels declining; world supply chains at risk due to this virus thing; global yields have generated massive inflows into passive vehicles that are heavily weighted towards a few stocks; insane speculation in the derivatives market (call side especially). We can go on. There is good and bad.
In The News:
Historically, "Epidemics normally have a severe but relatively short-lived impact on economic activity, with the impact on manufacturing and consumption measured in weeks or at worst a few months." (www.reuters.com)
"Despite historically low interest rates, U.S. companies are being unusually frugal, holding back on issuing new debt and pumping up their balance sheets with cash. Why it matters: Historically, when interest rates are low and the economy is strong, companies have levered up to increase capital expenditures and buy assets in order to expand. The opposite is happening now." (www.axios.com)
"So add low interest rates to suppressed inflation (temporarily) coupled with slowing worldwide growth, and we get a powerful upward force for stock prices. Our upside target for the S&P 500 Index is now 3600 or higher." (www.cumber.com)
"A survey of small- and medium-sized Chinese companies conducted this month showed that a third of respondents only had enough cash to cover fixed expenses for a month, with another third running out within two months. While China’s government has cut interest rates, ordered banks to boost lending and loosened criteria for companies to restart operations, many of the nation’s private businesses say they’ve been unable to access the funding they need to meet upcoming deadlines for debt and salary payments. Without more financial support or a sudden rebound in China’s economy, some may have to shut for good." (www.bloomberg.com)
"The White House is reportedly preparing to ask Congress for emergency funds to help the administration fight the outbreak of the coronavirus, which has infected almost 80,000 people around the world and accounted for more than 2,000 deaths." (thehill.com)
"The government of Hubei Province, the epicenter of the coronavirus outbreak, said Thursday it will extend its business shutdown for a third time, this time to March 10, more than a month and a half after the Lunar New Year holiday was slated to end." (asia.nikkei.com)
"'The LEI’s six-month growth rate has returned to positive territory, suggesting that the current economic expansion — at about 2 percent — will continue through early 2020,' Ataman Ozyildirim, senior director of economic research at the Conference Board, said in a statement." (www.axios.com)
How I'm Playing This:
I'm capitalizing on this high IV environment and will look to the call side on strong days, put side on weak days.
Disclaimer:
This is a page where I look to share knowledge and keep track of trades. If questions, concerns, or suggestions, feel free to comment. I think everyone can improve (myself especially), so if you see something wrong, speak up.
𝗘-𝗠𝗶𝗻𝗶 𝗨𝗽𝗱𝗮𝘁𝗲: $ES_F Daily. Bear Attempt #23337.5 ended up being exact fib level, but stimulus from #PBOC prevented big drop end of Jan. Attempt #2 looks set to begin
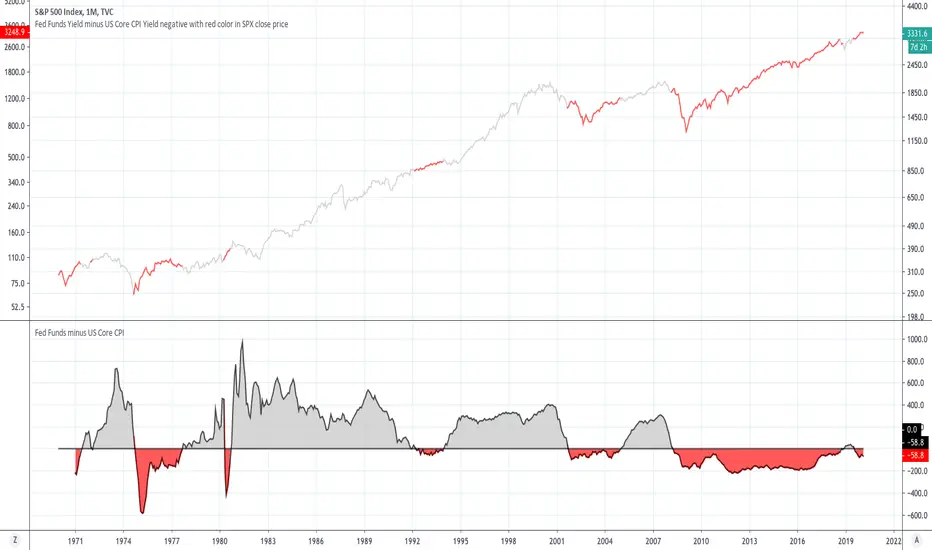
SPX index and Fed Funds below Core CPI index analysisSPX index and Fed Funds below Core CPI index analysis
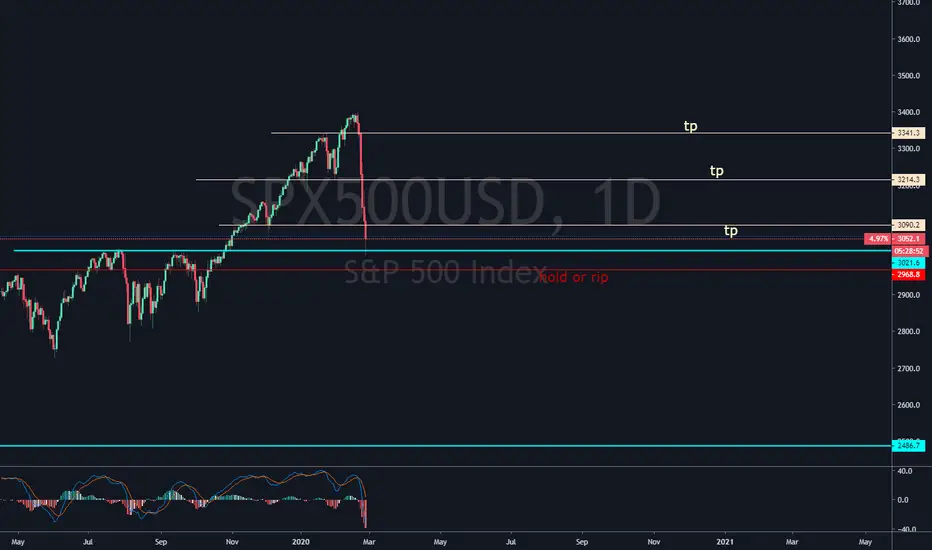
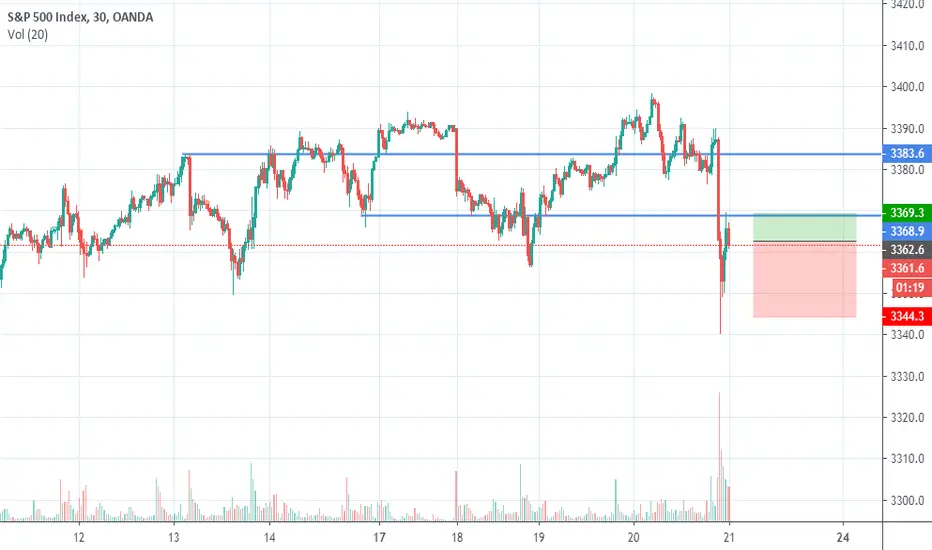
SPX500 make or Break zoneThe pullback here presents a nice low risk opportunity for shorts with stops above the spike highs. confluence of previous reference zones
SPX Year forward earnings divided by average Moody bonds yieldsSPX Year-ahead forward consensus expected earnings divided by average of Moody’s Aaa and Baa bond yields comparison with SPX index, SPX based on this metric is at present time not expensive, but relatively cheap. Same chart as but different source of data.

Financial Liquidity - US Real M2 Y/Grow minus US GDP Y/GrowFinancial Liquidity -> US Real M2 Y/Grow minus US GDP Y/Grow

SPX Year-ahead forward earnings divided by average Moody bonds SPX Year-ahead forward consensus expected earnings divided by average of Moody’s Aaa and Baa bond yields comparison with SPX index, SPX based on this metric is at present time not expensive, but relatively cheap.
