ETHEREUM CLASSIC: COINBASE & ROBINHOOD? - PROFIT = 38.80% !!!Our "Crypto Bottom" Trade Indicator has correctly identified a buy in point on the 25th of July 2018 .
Using this buy in point and selling at today's peak price as identified by our NEW "Crypto Peak" Trade Indicator , you would have expected to net 38.80% PROFIT!!!
The increase in price may also be explained by positive developments including:
May 3: London Block Exchange Enables GBP Trading for Ethereum 1.04% -0.11% Classic ETC.
May 3: Ethereum Classic announces release of go-ethereum v5.2.0.
May 6: Grayscale Investments Announces Approval of Public Quotation for Eligible Shares of Ethereum 1.04% -0.11% -0.03% -0.75% Classic Investment Trust.
May 6: Ethereum -0.11% Classic announces ETC sidechain exploration with their "Minimal Viable Sidechain" on Github.
May 16: Ethereum -0.11% Classic Labs is launched. Its main aims are to accelerate the development, expansion, and prosperity of the $ETC community and the entire ETC ecosystem by promoting smart contract applications based on $ETC
May 23: London Block Exchange lists Ethereum 1.04% -0.11% Classic.
May 24: Ethereum 1.04% -0.11% Classic upgrades via the Mantis V1.1 Performance Release. This allows for the following features:
May 25: Spyrja: Modular Asset Tracking Software is launched on the $ETC Blockchain.
May 29: Open Bazaar lists Ethereum 1.04% Classic.
May 30: Ethereum Classic announces Protocol upgrade for ECIP-1041.
May 31: Ethereum 1.04% Classic announces that the OpenStack Credits System to be Implemented as an $ETC side chain.
June 7: Coinpayments (crypto payments processor) announces its acceptance of Ethereum 1.04% -0.11% Classic.
June 7: Ethereum -0.11% Classic today announced its collaboration with Zeniex, a cryptocurrency exchange established by a group of financial and security experts from South Korea and China.
June 8: Stocks Gazzette releases article that states that Ethereum 1.04% -0.11% Classic is a grossly undervalued coin.
June 10: Thailand’s regulatory body, The Securities and Exchange Commission, have approved a list of 7 cryptocurrencies that can be used as payment for ICOs and as trading pairs on exchanges. This includes Ethereum 1.04% -0.11% Classic.
June 12: Binance adds new Ethereum 1.04% Classic trading pairs.
June 12: Coinbase announces it will list Ethereum 1.04% Classic in the "following months".
June 14: Ethereum 1.04% -0.03% Classic Labs is launched that will provide a full range of support, including operating funds, technical guidance, office space, industrial resources, creative strategy consulting, & more.
June 15: SEC announces that Ethereum 1.04% is not a security.
June 23: CoinBene Brasil lists Ethereum 1.04% Classic.
June 23: Nova Exchange lists Ethereum 1.04% Classic.
June 24: RADEX: Saturn Network launches the First Decentralized Platform for Ethereum 1.04% Classic called Radex Classic.
(NEW) August 5: Coinbase announces it is testing support for Ethereum Classic.
(NEW) August 6: BitOasis lists Ethereum Classic
(NEW) August 6: Coinbase announced that, barring any setbacks, they’d be greenlighting “inbound transfers” of Ethereum Classic on Coinbase Pro and Coinbase Prime as of August 7th
(NEW) August 7: Ethereum Classic Overtakes NEO in Market Cap.
(NEW) August 7: Crypto Trading App Robinhood Adds Support for Ethereum Classic.
The price increase is the result of the positive developments outlined above and a recovery in the crypto markets.
***The "Crypto Bottom" and "Crypto Peak" crypto trading indicators used in this analysis is included as part of the Crypto Trade Signals subscription.***
Etcbtc

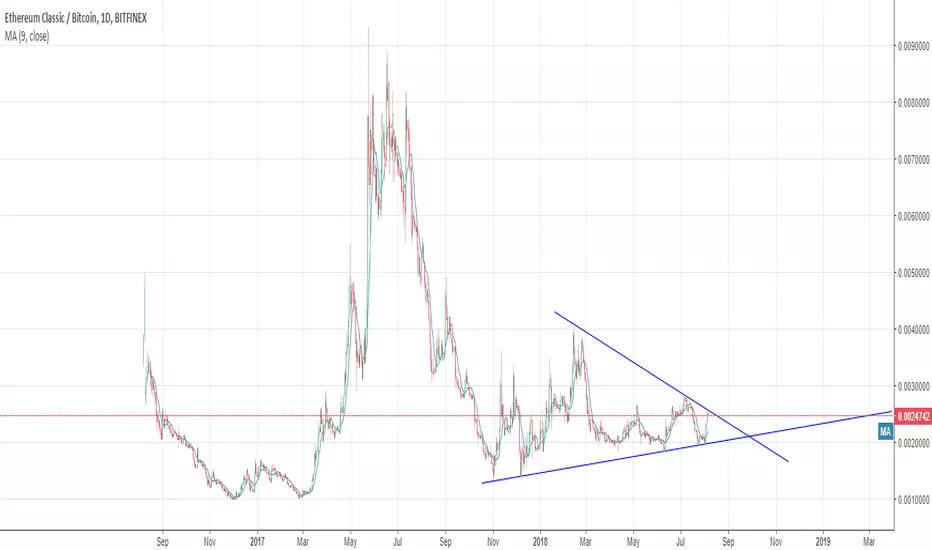
ETC growth, whats it's all about.Coin of the day is Ethereum Classic.
Ethereum Classic started to show a significant growth lately, let's see what its all about and what to expect further.
Recap
In 2016 after the hack a venture capital fund called The DAO, which was built on the base of Ethereum, the decision of a hard fork was made: the old version stayed as Ethereum Classic and a new one – Ethereum.
Basically, Ethereum Classic came into existence when some members of the Ethereum community rejected the hard fork on the grounds of "immutability", the principle that the blockchain cannot be changed, and decided to keep using the unforked version of Ethereum.
Latest news
August 6 - Listing on Robinhood platform. From Robinhood blog: “Starting today, you can invest in Ethereum Classic on Robinhood Crypto, commission-free.”
August 7 - Listing on Coinbase. Announced on June 11 on the company blog and the correct date (August 7) was announced on Twitter on August 3d.
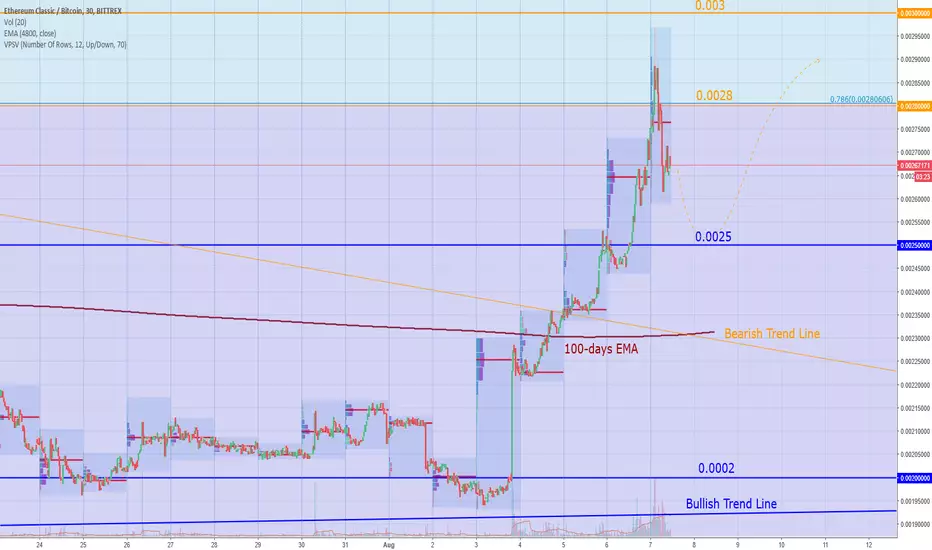
Technicals
The coin added 50% of value during the last days and broke the Bearish Tendency Trend line along with 100-days EMA, both are clearly bullish signs. Nonetheless, it is worth to remember that after the growth on new listings the price often goes into a correction. So, despite the fact that these events are positive in the long run, for now, we expect a correctional movement. 0.0025 level and 100-days EMA should play a supportive role if ETCBTC is going to continue an upward rally. 0.003 will be a major resistance and target in near-term. If the price will go below the 100-days EMA the next downward target will be 0.002 level along with global Bullish Trendline, crossover of which will make an overview negative.
ETC Still BullishETC still an long term investment.
Just follow the trend and look Red Circles. we are just in a small correction.
Happy Tr4Ding !

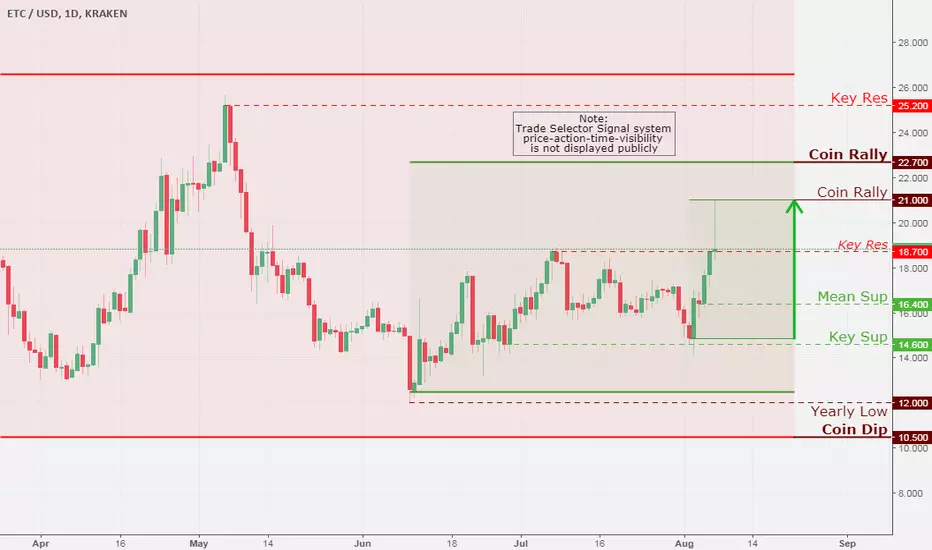
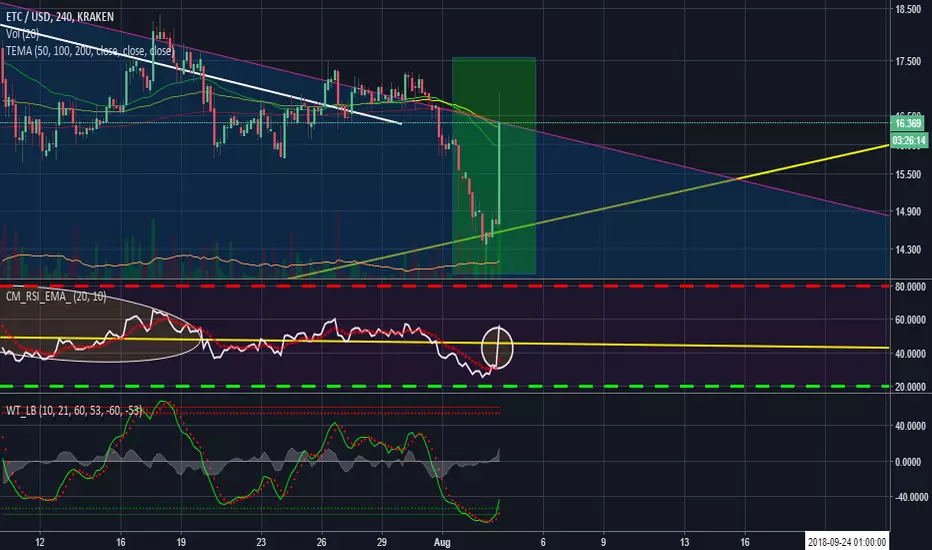
ETC/USD, Daily Chart Analysis 8/7Implications and Outlook
1. As stated on August 4, Bitcoin, Daily Chart Analysis, ETC (Ethereum Classic) was and is one of the exceptional coins, since there no significant good outliers among the list of smaller coins anywhere.
Currently, ETC is one of the top twenty crypto coins by market capitalization, ETC continuously is claiming further gains, up to further over 6% on the trading session. At the posting time, ETC is trading at or about $18.700 level by completing the inner Coin Rally as well as printing a new second quarter high at $21.
The coin continues to ride on positive price momentum induced by news reports of its impending listing on well-liked headquartered in San Francisco, California crypto exchange, and wallet service - Coinbase, the listing is set for today (August 7).
2. Price action has created the value of the new intermediate-term inner Coin Rally of $21 , by overrunning Key Resistance $18.700 which is a part of the outer Coin Rally valued at $22.700 .
3. Should the bearish momentum hit this support in the interim; it would be a negative sign from a technical as well as fundamental perspective.
4. The value of the intermediate medium to long-term Mean Support of $16.400 , along with Key Support $14.600, will be a primary target for the bears.
5. Current Coin Strategy Bias: Bullish 60 / Bearish 40
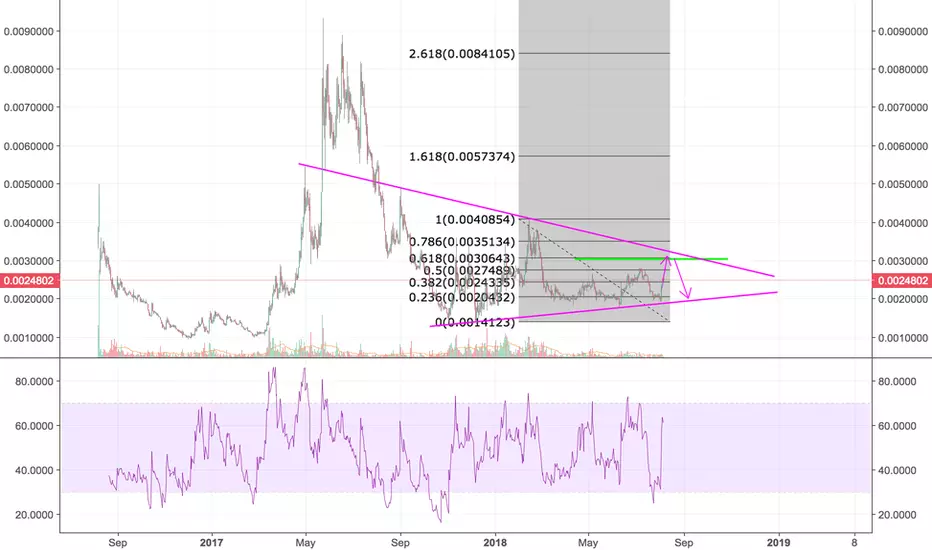
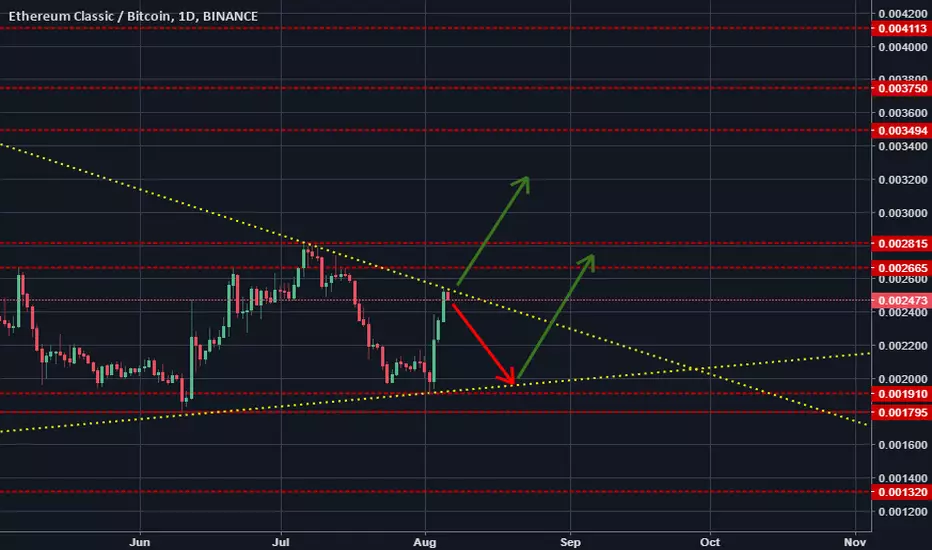
Ethereum Classic Coinbase ListingETC is going to DUMP right after/shortly before the Coinbase listing. There is massive speculation on this coin driving the price up, with many day traders all in ETC right now, waiting for the right time to sell. I'm not sure if the dump will happen Tuesday August 7, when Coinbase announces it is accepting inbound transfers of ETC, or Wednesday August 8 -> Thursday August 9, when trading opens on Coinbase Pro. But we can use fibonacci retracement theory and market sentiment to get some idea of where ethereumclassic is heading before the drop.
If you want to be conservative, sell at .0028 (the .500 fib retracement), but I believe we will touch .003 (the .618), then dump all the way down to .0019 throughout the next couple weeks.
What do you think?
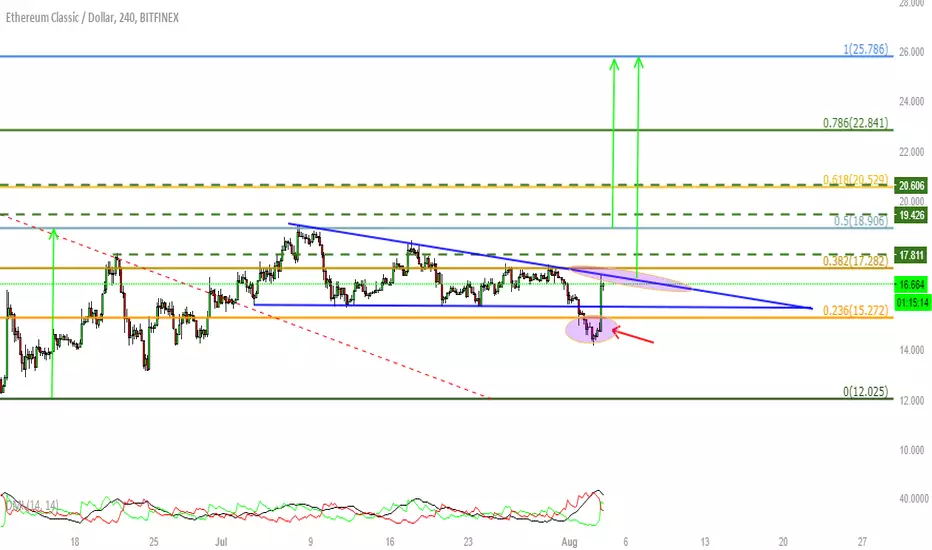
ETC CRITICAL POINT Traders,
- Here we have ETCUSD 4H chart.
- Twitter has a word for this pair, as any tweet from coinbase whoop to gain 10:20%.
- We had a fake breaking down as I'm indicating on the chart.
- Small triangle with this fake break, showing that we have double double ratio coming so we are talking about 60:90% gains, don't take it as a recommendation it's a humble vision of mine trade safe at the end.
Regards,
Mohsen
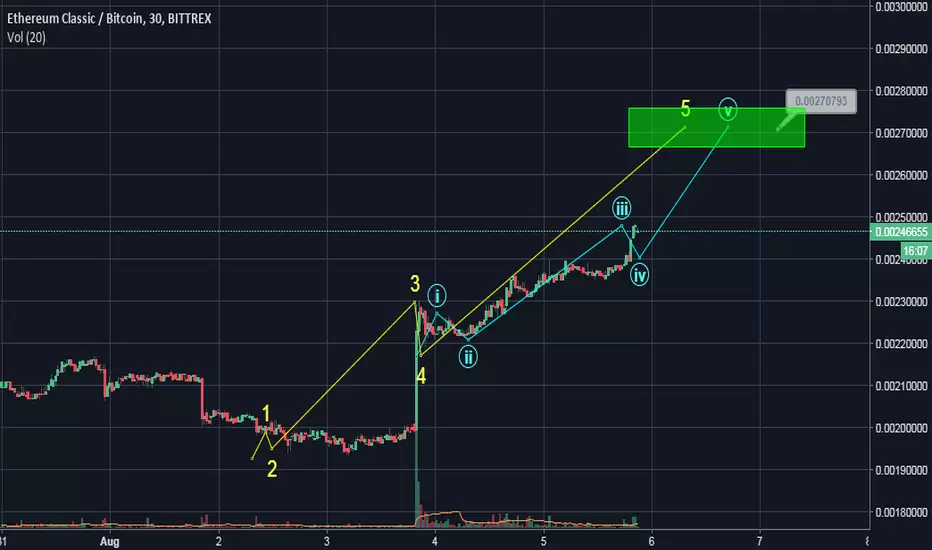
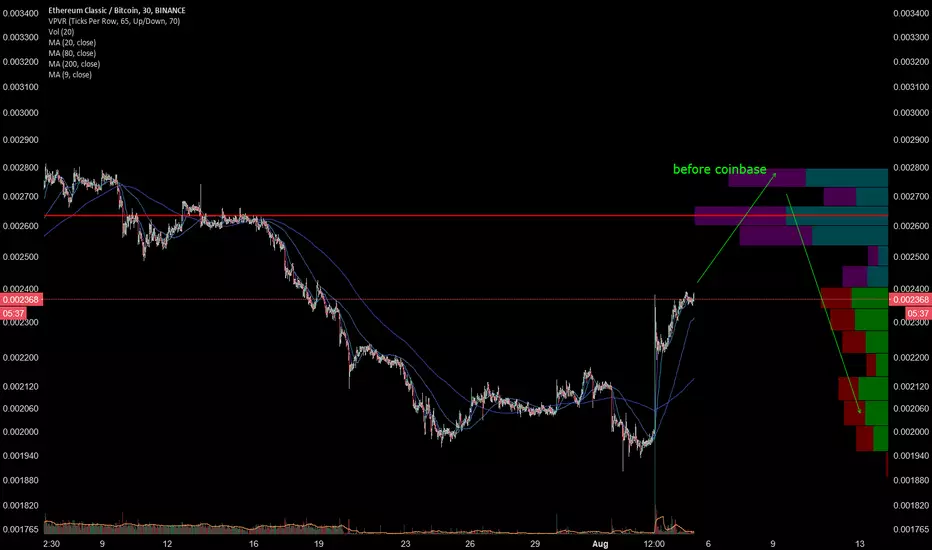
ETC Next Push UpETC found a big support at 2000Sats.
We still have a good "equilibrium Price" between BTC/ETC (when BTC pumped 8500ish and when it dumped 7500ish).
1D Chart > MACD about to cross / Rsi growing up
Next jump should push us to 2850 and 3000 (can see clearly resistance at 3k on ichimoku )
Keep an eye on Coinbase listing...
...And like always keep an eye on BTC -1.94% movements.
Happy Tr4Ding !

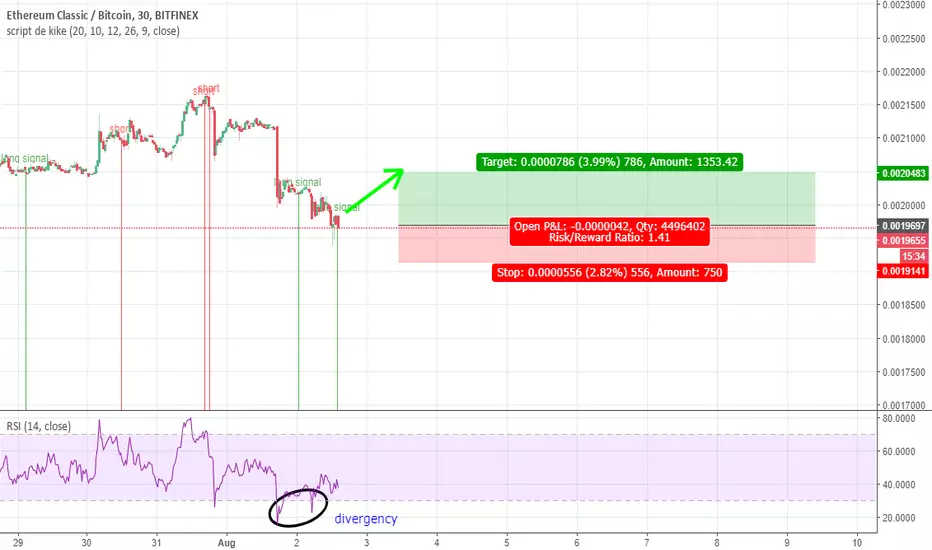
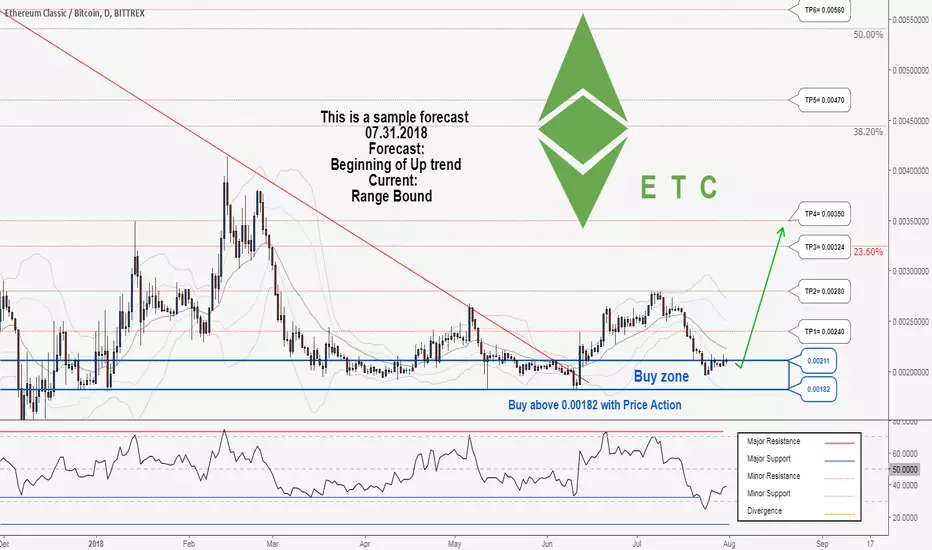
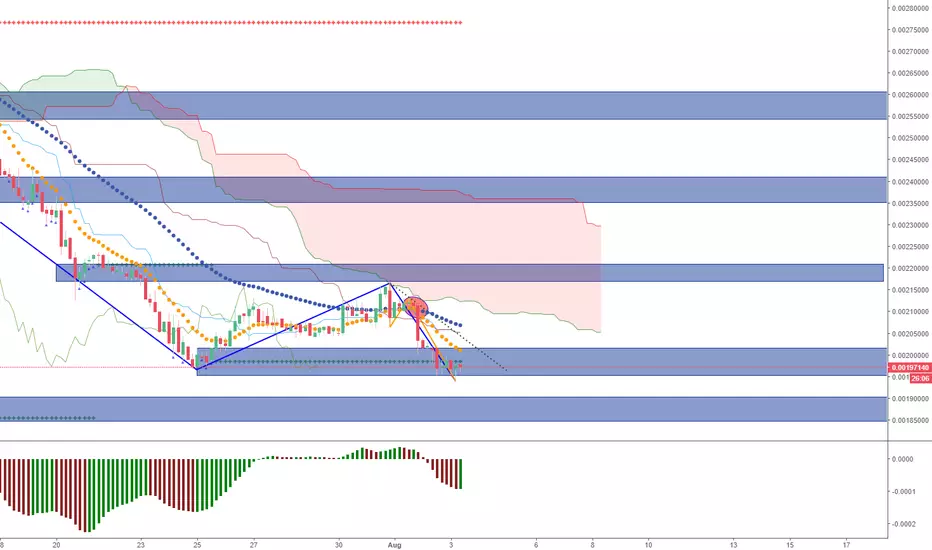
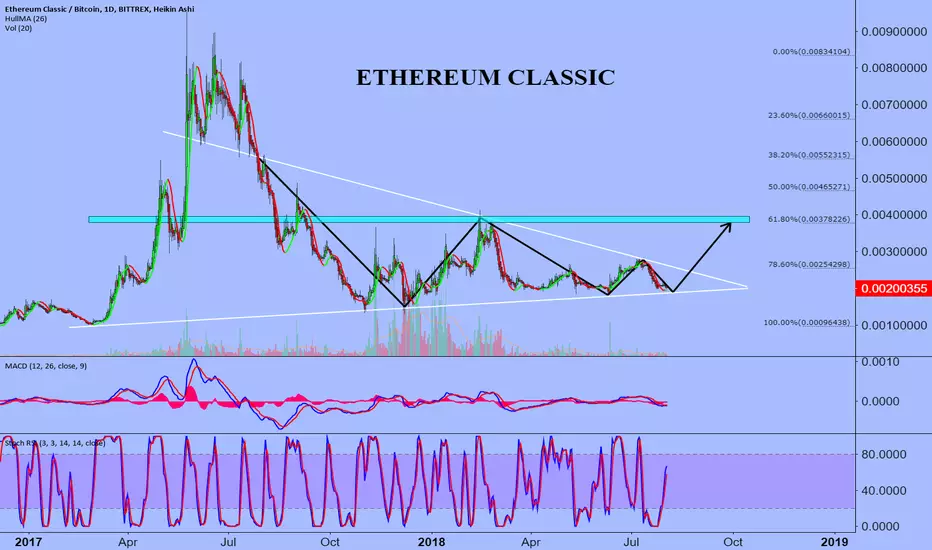
A trading opportunity to buy in ETCBTCTechnical analysis:
. ETHEREUMCLASSIC/BITCOIN is in a range bound and the beginning of uptrend is expected.
. The price is below the 21-Day WEMA which acts as a dynamic resistance.
. The RSI is at 37.
Trading suggestion:
. There is a possibility of temporary retracement to suggested support zone (0.00211 to 0.00182). if so, traders can set orders based on Price Action and expect to reach short-term targets.
Beginning of entry zone (0.00211)
Ending of entry zone (0.00182)
Entry signal:
Signal to enter the market occurs when the price comes to "Buy zone" then forms one of the reversal patterns, whether "Bullish Engulfing" , "Hammer" or "Valley" in other words,
NO entry signal when the price comes to the zone BUT after any of the reversal patterns is formed in the zone.
To learn more about "Entry signal" and the special version of our "Price Action" strategy FOLLOW our lessons:
Take Profits:
TP1= @ 0.00240
TP2= @ 0.00280
TP3= @ 0.00324
TP4= @ 0.00350
TP5= @ 0.00470
TP6= @ 0.00560
TP7= @ 0.00820
TP8= @ 0.00951
TP9= Free
There is a trading opportunity to buy in ETCBTCTechnical analysis:
. ETHEREUMCLASSIC/BITCOIN is in a range bound and the beginning of uptrend is expected.
. The price is below the 21-Day WEMA which acts as a dynamic resistance.
. The RSI is at 37.
Trading suggestion:
. There is a possibility of temporary retracement to suggested support zone (0.00211 to 0.00182). if so, traders can set orders based on Price Action and expect to reach short-term targets.
Beginning of entry zone (0.00211)
Ending of entry zone (0.00182)
Entry signal:
Signal to enter the market occurs when the price comes to "Buy zone" then forms one of the reversal patterns, whether "Bullish Engulfing" , "Hammer" or "Valley" in other words,
NO entry signal when the price comes to the zone BUT after any of the reversal patterns is formed in the zone.
To learn more about "Entry signal" and the special version of our "Price Action" strategy FOLLOW our lessons:
Take Profits:
TP1= @ 0.00240
TP2= @ 0.00280
TP3= @ 0.00324
TP4= @ 0.00350
TP5= @ 0.00470
TP6= @ 0.00560
TP7= @ 0.00820
TP8= @ 0.00951
TP9= Free

Golden Cross on Ethereum Classic.so many bullish fundamentals going on right now with the impending arrival of ETC to coinbase and on top of that Robinhood beating them to the punch and making it available on their app as well. Not much more needs to be said really.


ETC/BTC Short Hi everyone. ETC/BTC (ETC/XBT) has been pumping quite nicely these past couple of days. We are reaching a pretty strong confluence of resistance however, and I plan to attempt a short near the purple descending line. Some confluence to consider:
-Fib line
-Top of the daily cloud
-Descending resistance trend line
-Daily pivot Resistance 1
-Descending resistance on RSI
We may have a little more room to run on the L-RSI in yellow below. Once it tops out with a green candle, I will be shorting. If we end up getting a higher high however, I will stop out. Aiming for the previous support area.

Prepare for a next ETC leg Situation is more than awkward. We need couple more days to go sideways and only then we will have a chance to look a buy opportunity. As for now support holds it but if BTC will go down ETC will go straight no new support line on 1900.
Trade on your risk but right now you are catching a falling and no one knows will you catch it or not.
New 1HR Elephant on ETCBTCAfter ranging for some time on the daily chart and retracing back to support ETC made a new runup in price.
A clear swing high with volume takes the price from below the 200MA and closes the candle above the 200 Moving average. As usual we see a few small rises after this one, and because the prifce barely dipped I would expect price to test local support again before trying to go higher.
I would like to scale into a position from the 0.50 to the .0618 retracements levels. A stop is placed just bvelow the 0.768 fibonacci.
Should the price not drop from around here, then we redraw the fib to the new high to measure retracements.
Because this is the first elephant, I prefer to raise the stops instead of taking full profit on the first bounce from my orders. I will do this 3 times in total before taking full profit on the trade at major resistance. (buy the dip after a new high untill price does not make a new high on this timeframe)
This is how I add to a winning position most of the time.

ETC SHORTS GET REKT, BADLY Frankly, I'd say they had it coming. Who in their right mind would short Ethereum Classic (ETC) when it is due for a Coinbase listing, for all we know in the next few weeks?! Just because you saw some whale hammer the price down so they could capitalize on the panic and buy more, you thought it was a good time to short ETC? Forgive me for being a little straightforward, but you had it coming. If you don't understand the game, just stick to simple buying and selling. How does that work? Well, you buy when it is dirt cheap and you sell when it is insanely pumped up. There's nothing simpler than that.
ETC perfect break of Descending TriangleHey guys, hope you're doing well! :)
In this video I'm going to show you how perfectly you could've played the Descending Triangle pattern both on the Daily & on the 15 Minutes, giving beautiful 14% cumulative profits to the downside.
If you have difficulties recognizing such patterns yourself, make sure to follow me! I'm doing Daily Crypto Analyses!
About myself: Global citizen & early Bitcoin adopter from Germany. I invested in the 2nd rally from 50 to 1.000 Dollars in BTC.

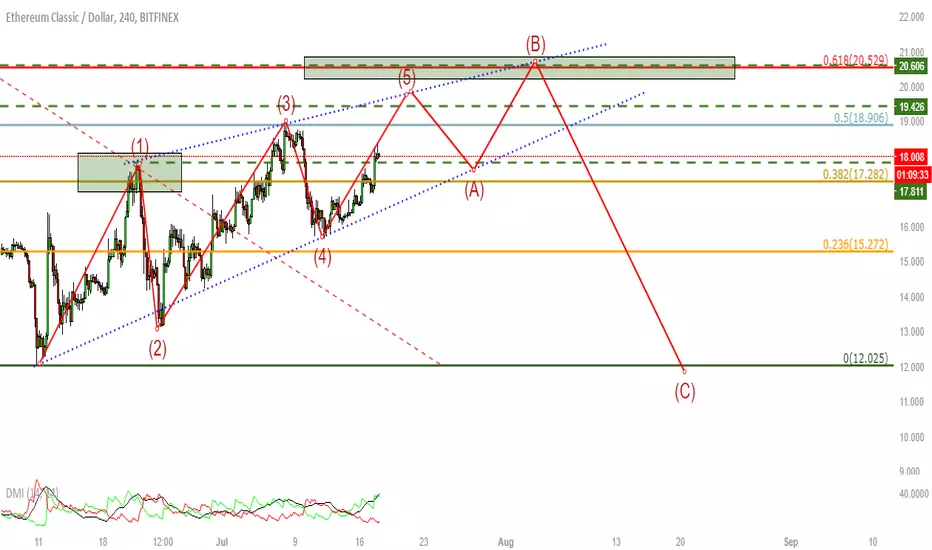
ETC SCENARIOTraders,
Here we have ETCUSD 4H chart.
Previously in the last idea about ETC we said that we have a launch and determined the TPS and we have TP till 19$ you can check it here below:
Now let's look at the bearish ascending wedge. Note that the top trendline is rising. Additionally the bottom trendline (rising bottoms) is rising. It's another battle between bulls and bears. The pattern is formed as each high is higher than previous and each low is successively higher as well. The difference being, the angle of ascent is steeper on the rising bottoms line. The steeper of the two trendlines in both the rising and falling wedge patterns will generally not hold because it becomes harder for bulls (bears) to sustain that acceleration (deceleration) in price. Though the highs are successively higher, their angle of ascent is less steep which implies bulls are not able to push prices high enough to maintain a complete rising trend channel. That is bearish. Selling pressure mounts until finally price will break down from the steep rising bottoms trendline which executes the pattern.
Usually we have 7 moves till the break and here we have it one 0.618 Fib and breaking with low potential.
Note : This scenario will be canceled if we have coinbase release the pair next months as they said.
This chart is a great example of both types of wedges executing with near perfection.
Like will be appreciated.
Regards,
Mohsen