Etcbtclong
ETCBTC looking goodWe continue up
I've decided to stop goofing around so much on Tradingview with silly charts and start posting solid and simple ones.
If this chart turns you a nice profit, please consider dogenating to the "PoloVita gets to keep living indoors" fund. It's a good cause.
Doge address: DM2whCvsuM4Lw6xnJnuLumNsLF1jboF4WU
BTC address: 1G7wcbpMGhqSZzyyurCFZ1io3QNp51zvL1
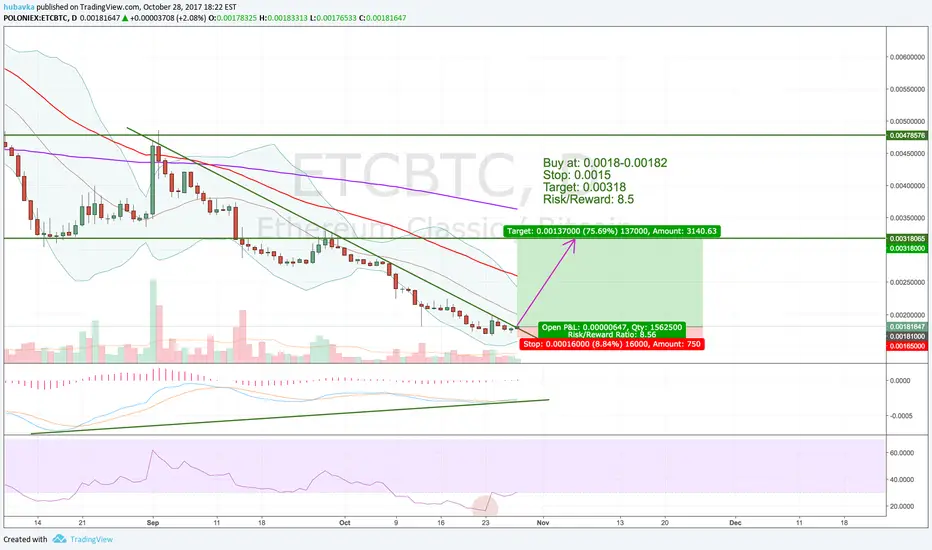
ETCBTC long - daily chartETCBTC hit all time low on the daily RSI and then reversed and crossed over 30.
A two month old trend line has been broken to the upside. There is a positive divergence as well.
Target is a previous support now resistance from 3 different times where price reversed.
Buy at: 0.0018-0.00182
Stop: 0.0015
Target: 0.00318
Risk/Reward: 8.5
Good Luck!!!
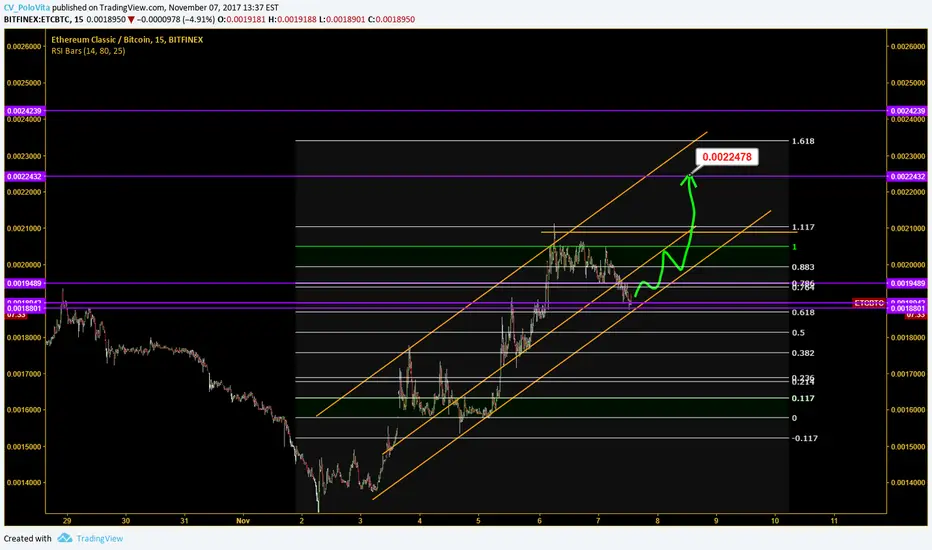
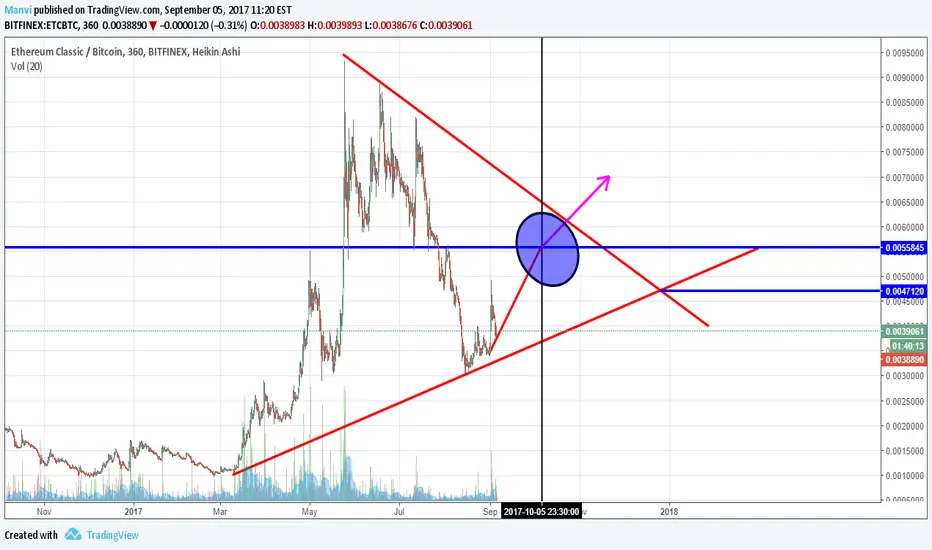
etc long term chartetc story is bit intresting
so lets try to undersatnd wht is happenning out here so take a look at chart
etc price in jan,17 = 0.00125-0.00150
etc went in may,17 = 0.00675-0.00912
then again a dip in july,17 = 0.00315-0.00335
now again will go up in 5th oct,17 = 0.00565-0.00595
then etc can pump a big upto 0.012 otherwise next dump will bring etc down to 0.00491 level like (july,17)
and then again same pattern
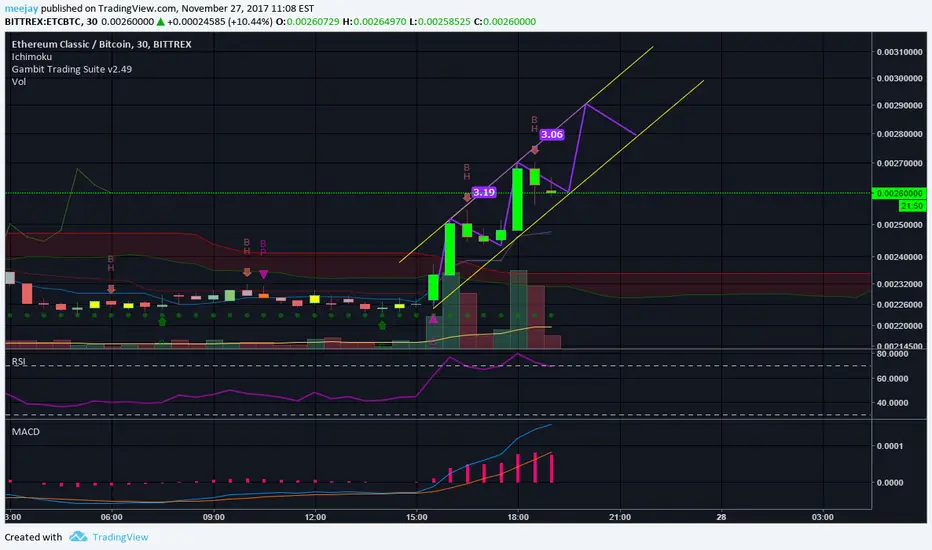
Bullish Cypher Pattern - The investment opportunity on ETCBullish Cypher Harmonic Chart Pattern suggests an upcoming bullish movement in the price Fundamentals too -> grayscale.co Plz Share

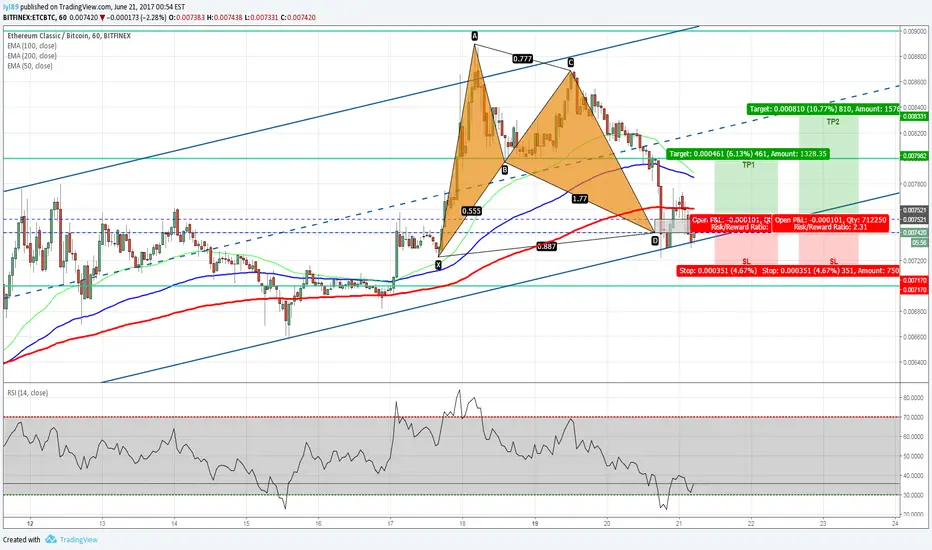
ETCBTC - Bullish Bat Pattern CompletedBat pattern has completed and reacted briefly, price has gone back down for a retest.
The equidistant channel support line seems to be holding strong, suggest to buy after this closing candle.
Area of interest to buy : 0.007416 to 0.007521
R:R at 1.3 (TP1) and 2.3 (TP2).