ETHUSD Looks like we are starting a consolidation stage. The price uptrend might be coming soon.
My position may be neutral for now.
ETCUSD

Ethereum Classic (ETC) - April 7Hello?
Traders, welcome.
By "following", you can always get new information quickly.
Please also click "Like".
Have a good day.
-------------------------------------
(ETCUSDT 1W chart)
Primary resistance: around 68.79
Secondary resistance: 90.48-101.33
Support: 36.26-47.10
It is important to be supported in the section 36.26-47.10, so you need to check it.
(1D chart)
(buy)
- After confirming the support around 36.26
- After confirming the support around 47.10
(Stop Loss)
- When it drops from 29.66 and is resisted
- When it falls below 26.52
(Sell)
- When receiving resistance near 68.79
- When resistance is received in the section 90.48-101.33
However, if it rises above 57.55, a sharp movement is expected, so careful trading is required.
------------------------------------------------------------ -----------------------------------------------------
** All indicators are lagging indicators.
Therefore, it is important to be aware that the indicator moves accordingly with the movement of price and volume.
However, for the sake of convenience, we are talking in reverse for the interpretation of the indicator.
** The MRHAB-O and MRHAB-B indicators used in the chart are indicators of our channel that have not been released yet.
(Since it was not disclosed, you can use this chart without any restrictions by sharing this chart and copying and pasting the indicators.)
** The wRSI_SR indicator is an indicator created by adding settings and options to the existing Stochastic RSI indicator.
Therefore, the interpretation is the same as the traditional Stochastic RSI indicator. (K, D line -> R, S line)
** The OBV indicator was re-created by applying a formula to the DepthHouse Trading indicator, an indicator disclosed by oh92. (Thanks for this.)
** Support or resistance is based on the closing price of the 1D chart.
** All descriptions are for reference only and do not guarantee a profit or loss in investment.
(Short-term Stop Loss can be said to be a point where profit and loss can be preserved or additional entry can be made through split trading. It is a short-term investment perspective.)
---------------------------------

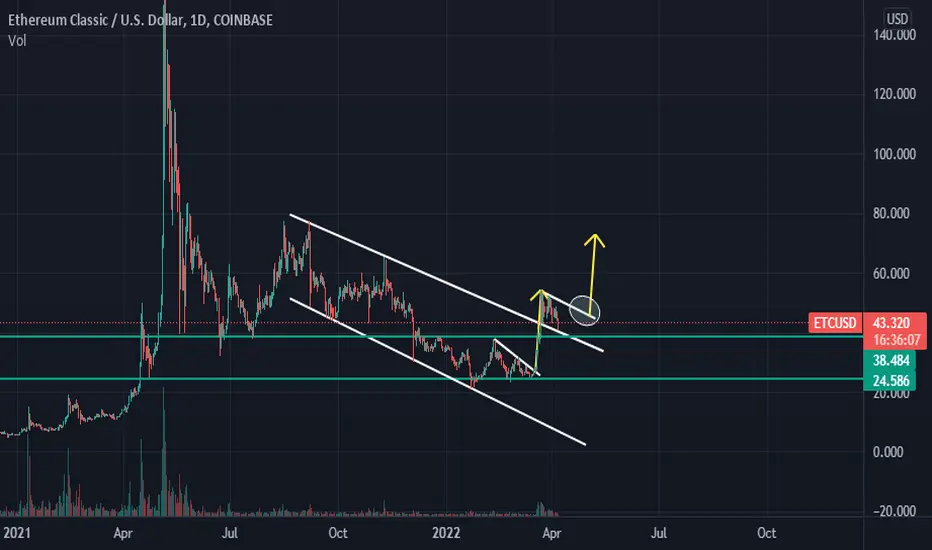
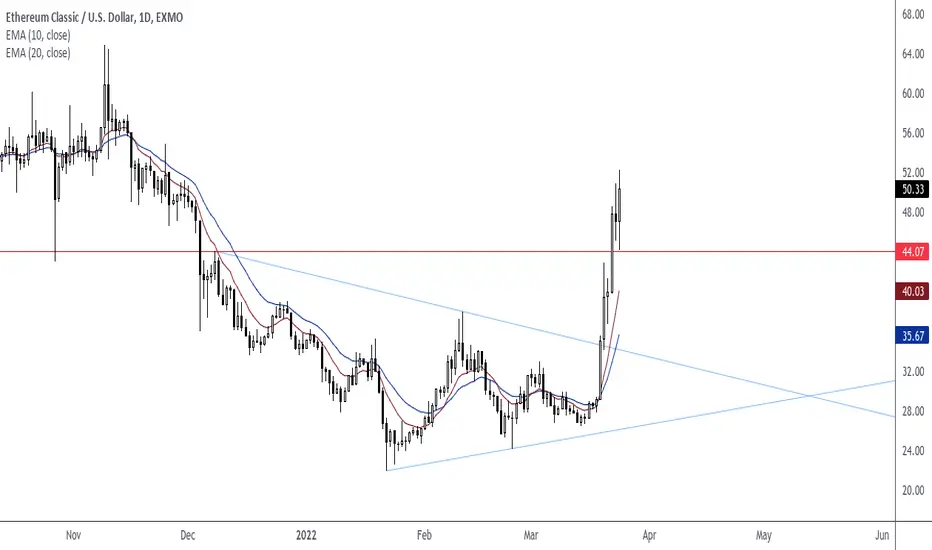
ETC gain 100% SOONETC after break-out descending channel, build Flag pattern.
In next few day, It starts new rally and gains almost 100%.
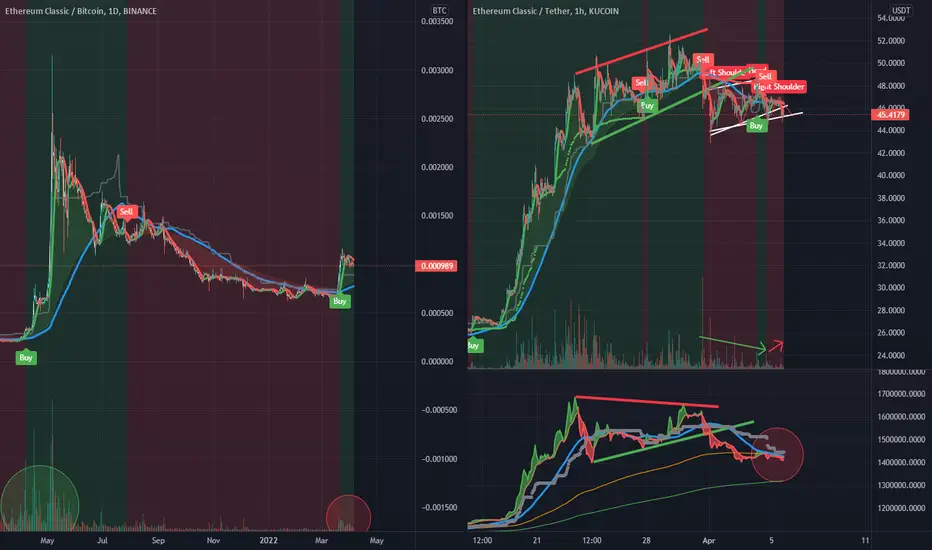
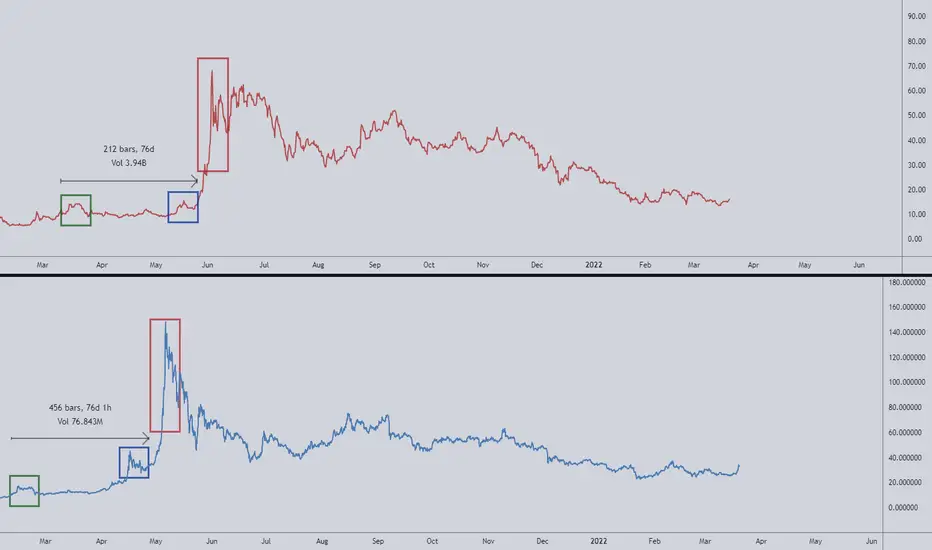
Ethereum Classic Potential BART - the next WAVES?Ethereum Classic / BTC 1D chart is showing a breakout in price, but with very low volume compared to April last year.
Price is currently quite high, and as you can see on the ETC/USDT 1 hour chart, buying volume has been falling and falling.
In the last few hours, we have seen selling increasing a lot.
You can also see the red volume falling underneath and retesting the Blue trendline on the Volume Oscillator, indicating a potential downwards move. What this basically means is that the buyers volume was rejected at a certain point and the sellers are taking control.
We also see a bearish Head & Shoulders pattern form on the 1 hour UNDERNEATH the Blue moving average price trendline, inside of a bear flag.
We could see a MASSIVE drop here - the chart is quite similar to WAVES - we are seeing distribution here at high levels after a low volume pump.
So why do I say BART?
Take a look on the 1 hour chart on the right. Look at the Volume oscillator. Do you see how price is rising but Volume is going lower? (See thick red resistance lines drawn.) This is bearish divergence in volume and detects MID TERM DISTRIBUTION.
Resistance is at 46.4 on Kucoin, or you can breakout trade. Good luck.
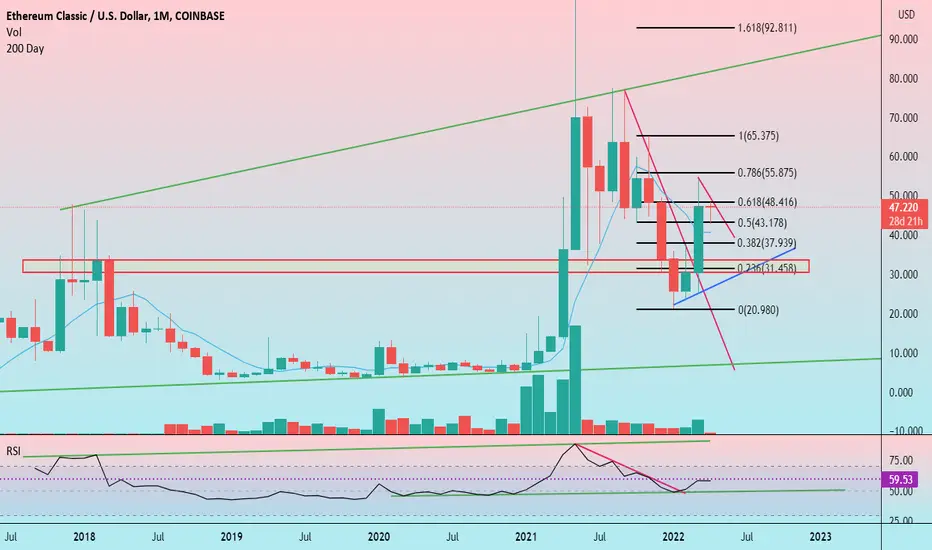
ETC Ethereum Classic: 1M Chart ReviewHello friends, today you can review the technical analysis idea on a 1M linear scale chart for Ethereum Classic (ETCUSD).
Ethereum Classic price on a monthly chart shows multiple areas of resistance. Price has a chance to move back down with the Fibonacci Retracement levels shown along with 200 SMA and RSI.
If you enjoy my ideas, feel free to like it and drop in a comment. I love reading your comments below.
Disclosure: This is just my opinion and not any type of financial advice. I enjoy charting and discussing technical analysis . Don't trade based on my advice. Do your own research! #cryptopickk
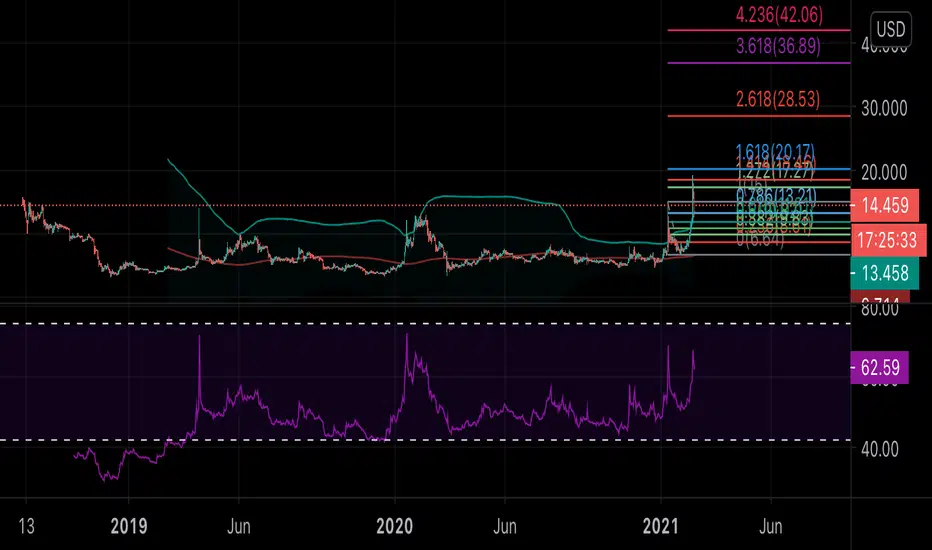
ETC Ethereum Classic to the moon! 🌝 100.00 + usdMy prediction for Ethereum Classic is a whopping top out price 100.00 + usd. Once it breaks the 40.00 usd resistance level it should appreciate and double it’s value. As you can see it has gotten out of the bottom and is now bullish holding above 13.00 usd. The price should start spiking up and make a quick double top before a small sell off, then it’s off to appreciation. This is my idea! If you take a chance and risk it, the reward may be huge. Invest and trade at your own risk, research, and beliefs. This is not advice.
Good luck everyone.
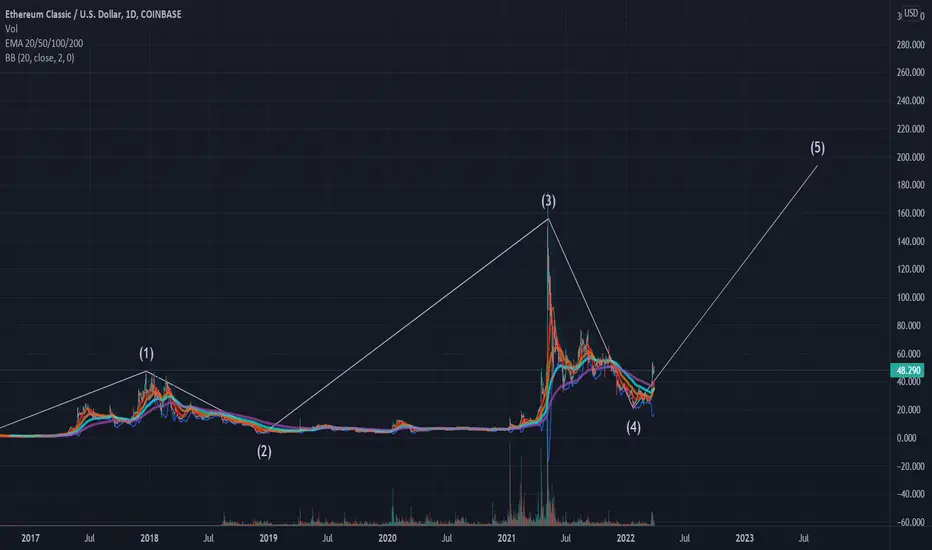
ETC/USDTesting/tracking elliot wave theory. Please do not trade off idea without S/L. Not financial advice.
Link to previous chart:
Wave 4 retracement has bottomed out I think. It went further down than what I had counted on the previous chart. We should be working towards the last impulse wave (5).
wave 5 top: $200-250
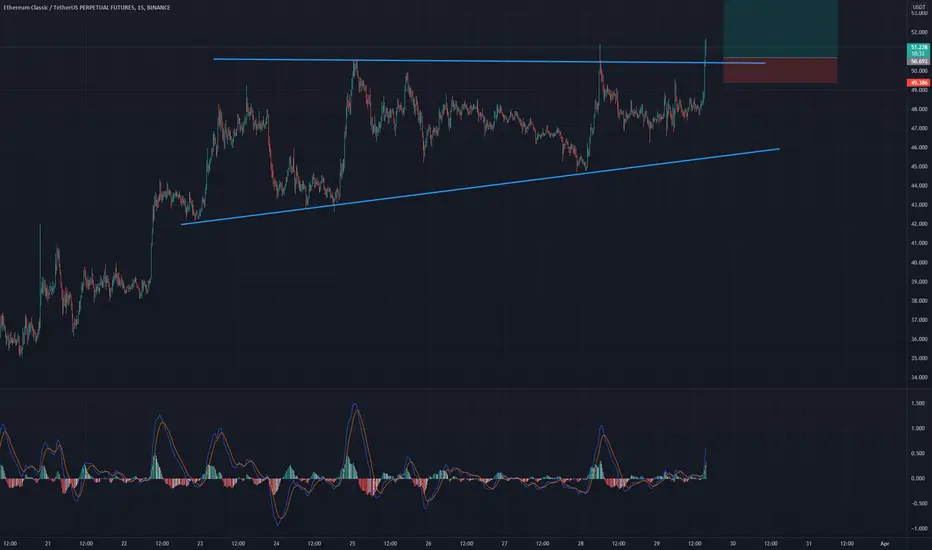
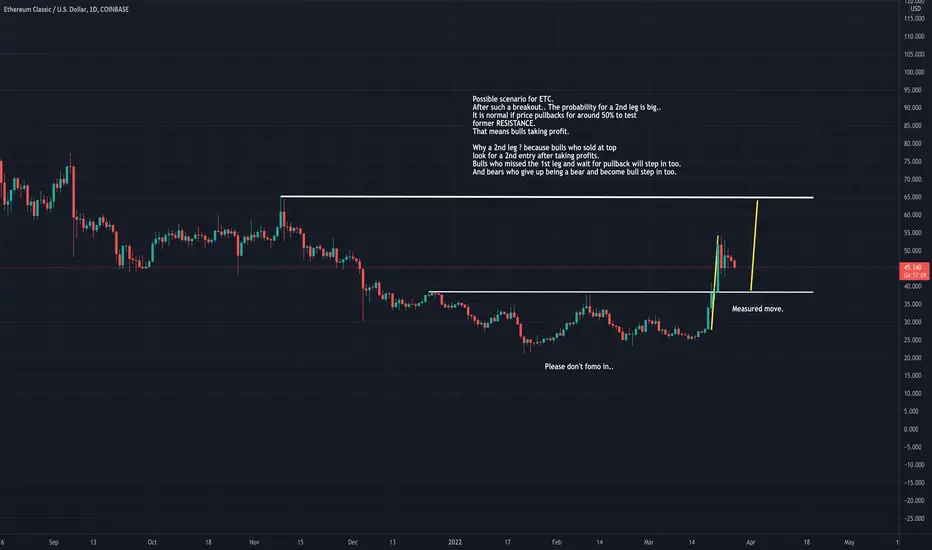
ETC possible scenario and 2nd leg.. Folks,
It hurts if you see a CRYPTO classic breakout as we see here on the chart for ETC and you have missed it..
But most of the time these breakouts these strong tend to give 2nd chances in the form of a 2nd leg..
Be patient.
Feel free to comment, share and hit the like and make sure you follow.
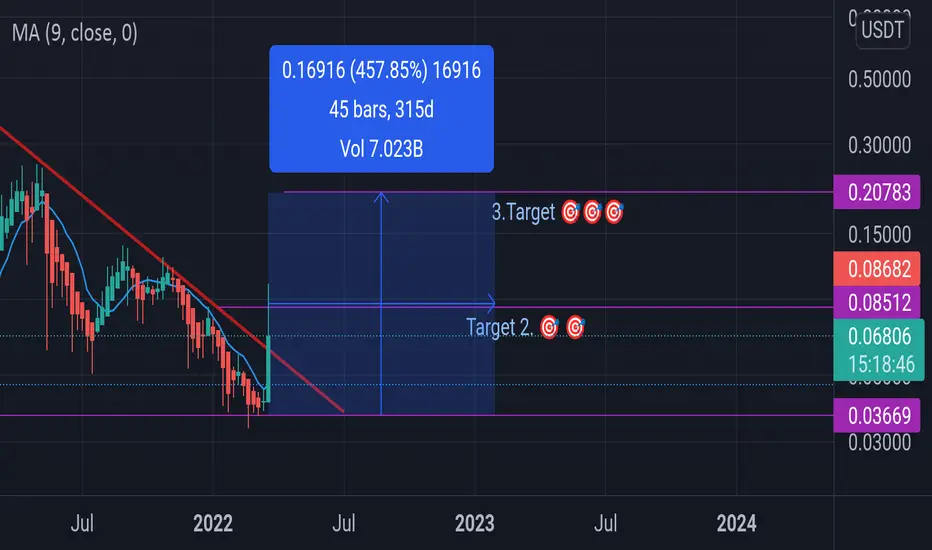
ZILUSDT 4x so close 🎯🎯🎯🎯%400 coming Zil broke the lower trend in which it's like a 1 year lower trend.
Short time target so close,
Long term %400 coming soon 🔜🔜🔜🔜
Etc Ready to be shortedEtc is having a pump but due to the recent low high we concluded that the etc will no longer pump thus ready to be shorted around 49-50 dollar mark

ETCUSD Cryptocurrency Market (2022-March-24)For currency pair ETCUSD, wait for another pull back. Currently, the currency pair is overextended.
ETC to revisit ATH?gm frens,
If you follow me, you know I've stayed bullish $ETC.
Revisiting the $65 region seems inevitable, as miners realize that $ETC can be a way to recycle their $ETH gear. Then it's a virtuous circle of higher hashrate, project becomes more interesting to build on, prices goes up, mining becomes more attractive, etc.
So far my January 2022 prediction has been correct (e.g. $60 before Q2).
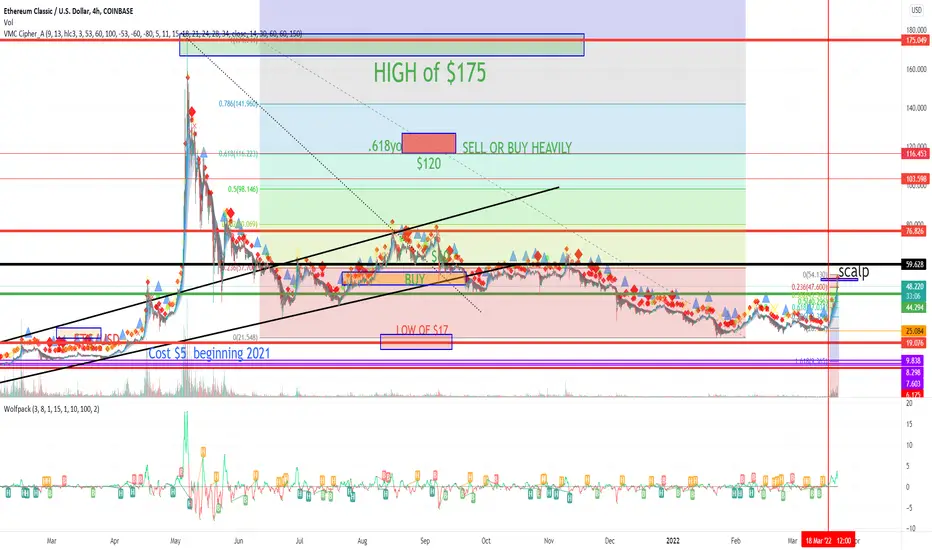
The real resistance is at $80. If we break it, then I think we're going to repeat what happened a year ago, meaning we could currently be a fractal of the green rectangle I highlighted. $ETC can reach $500 before summer. $1k is possible, but less plausible.
What would invalidate this scenario is a strong rejection at $60 and the whole crypto market going back bearish because of macro.
DYOR.

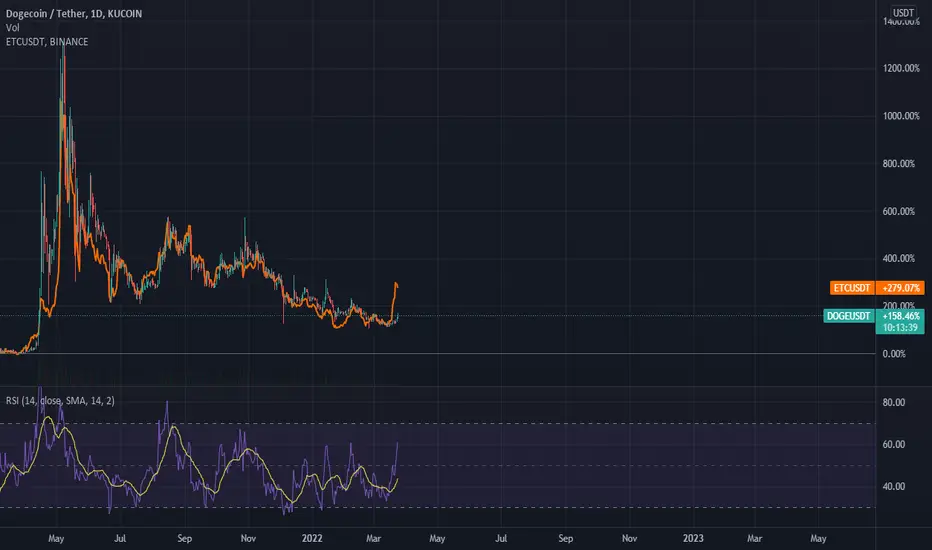
DOGE really similar to the ETC breakout! Possible +60%Hello Everyone,
Here is another comparison between Ethereum Classics' breakout and what Dogecoin could possible see.
If Dogecoin takes the same path as Ethereum Classics, it could see a possible 60% raise.
Let me know what you think or if you have another idea!
This is not financial advice, please do your own due diligence and your own research.
Thank you for your time!
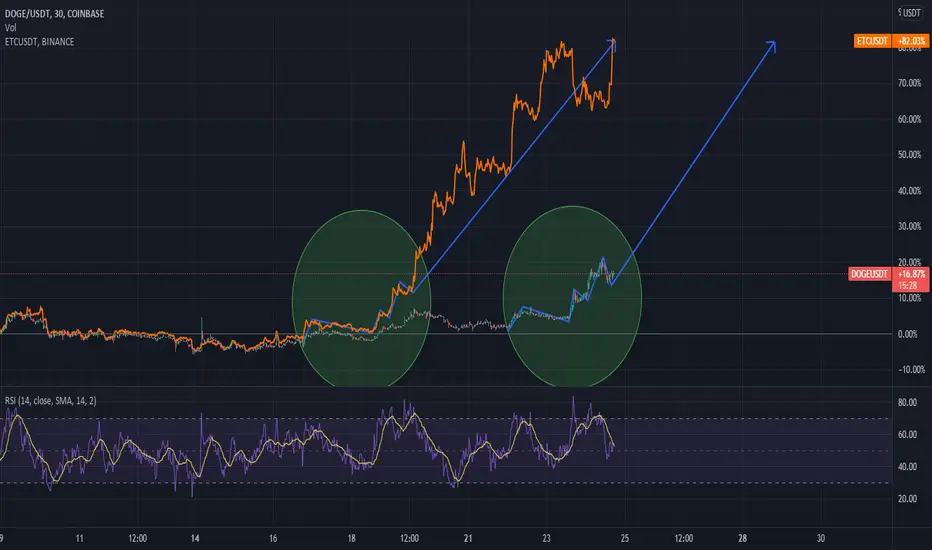
DOGEUSDT Compared to ETCUSD.... PUMP could be Incoming!Hello Everyone,
First time posting here.
I just noticed that Ethereum Classic and Dogecoin are following one another very closely over the last year.
With this being said, Dogecoin could see a nice pump to .25 cents, if its compare to ETCUSD.
Let me know what you all think, or if you have other ideas.
This is not financial advice.
Please do your own due diligence and research before reacting.
Thank you for your time!
Is ETC dead now? Where to rebuy (NFA)ETC surprisingly beat my 55% target increase in just a few days from posting that. Curious if they have bragging rights or awards you can get on here for being so spot on, lol.
Anyways, I found 3 things on my chart that all pointed to the same spot for ETC to make a higher low in the uptrend. The peak had a bullish penant it broke down from, I measured it and drew a yellow arrow on my chart. It just happened that it aligned exactly where I had a support / resistance line (not sure what time frame admittedly I have a lot from short time frame margin trading), and even cooler was that the 100 or 200 EMA depending on if on 2 or 4 hour chart also aligned at the same spot (or will as it falls).
That’s where my limit orders will be, but admittedly I feel lost without my ETC coins. I’ll probably DCA a few in beforehand. I need to work on the no emotion thing. What can I say even at the peak I believe it is way undervalued. I just won’t miss out on great trading opportunities while holding a bunch of it. I’ve been shorting since the breakout downwards of the triangle (there was a false break to upside originally on smaller time frame that’s why pattern looks a little weird.)
**The rebuy area the chart points to in yellow is not financial advice. Do your own due diligence. I have been extremely accurate in the past with predictions and forecasts but that does not guarantee future success.

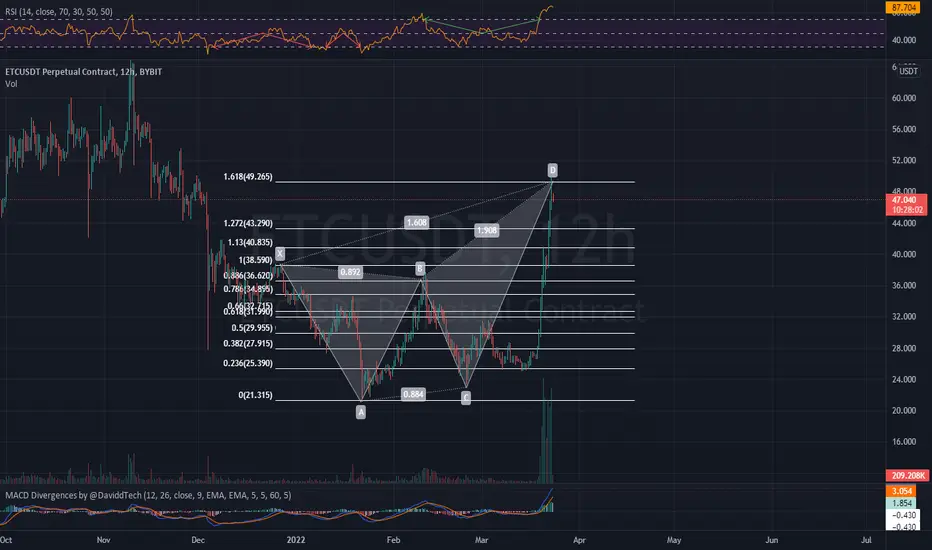
ETC/USDT (Futures) Update SHORT #harmonicsignal #Crypto
ETC/USDT (Futures) Update
⬇️Short Signal
Entry at 49.26
⭕️SL @52
🔵TP1 @38.5
🔵TP2 @31.9
Move your SL to entry level after profit 1:1 RR hitted.
*Take out 75% at tp1 remaining for tp2*
Only Risk 1% of your Equity.
Dont you worry bout a thangwe could retrace to $29 or $37 .... we could also just blow past $50 after consolidation. Been mining ETC for a few months and todays pump was a good day to SCALP profits for a quick retrace.
Sold at $52
Current price: $48
watch for volume and retrace, if not, were pumping, just a guess
[ETC/USD] Long term: What is the future of ETC?TREND:
Trending line has clear bearish tendencies since the end of February.
SUPPORT:
We are currently missing any major support line until around 2.662USD. Either we will create a new support by side action or we will fall in correlation with the trend line.
VOLUME:
Volume is proving to be not big enough for bulls. We can clearly see that bears are taking the lead. Should we see some change? If yes, then already mentioned side action is needed with higher highs.
RSI (100days):
It is currently on 42 (meaning of life?) which is not hugely oversold, therefore there is still lots of room for selling action.
Summary and prediction? I see ETC slowly falling down to the area of 2.662USD until the half/end of January.
If you agree, then your like is appreciated :)
Happy trading.

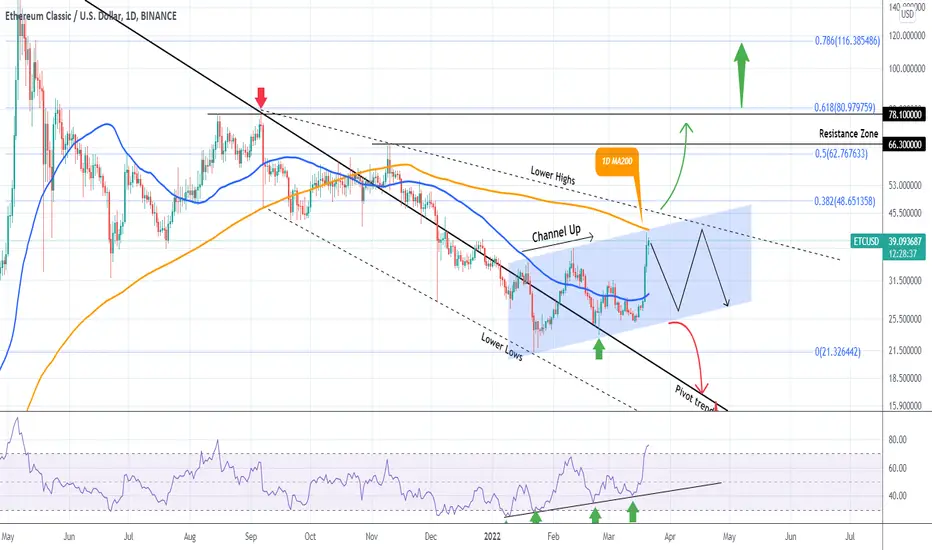
ETCUSD Still not bullish long-term until this breaksEthereum Classic has had a +45% rise in just the past 2 days and is currently testing the 1D MA200 (orange trend-line). That level has been intact since the November 10 2021 Lower High.
Unless the 1D MA200 and the Lower Highs trend-line just above it break, ETC won't reverse the long-term bearish sentiment and will continue trading within the Channel Up that started at the begining of the year. A break below the bottom of this Channel Up, constitutes a sell signal targeting the Pivot line.
--------------------------------------------------------------------------------------------------------
** Please support this idea with your likes and comments, it is the best way to keep it relevant and support me. **
--------------------------------------------------------------------------------------------------------
AMC & Ethereum Classic CorrelationI believe institutions are using Crypto for the purpose of leveraging their positions on meme stocks.. like AMC. Ethereum Classic, is one that has been extremely correlated with AMC's price action lately. As you can see here, ETC started leading the way in February of 2021, and shortly after it dropped, AMC began creating the same patterns. They were traded against each other up until November 15th, when they started tracking identical (in time). In our current state, both seem to be very correlated in pattern movements; they are still tracking identical. However, I believe things are about to change. ETC is up 20% today (Saturday March 19th, 2022). I think this upcoming week we will start to experience their correlation (in time), slowly stray away from one another. The pattern tracking will continue, except, it will occur on different time frames. This process would allow the institutions to, once again, trade the two against each other in preparation for the next runup, or.. the squeeze. If true, the manipulation of AMC would seem inevitable.
etc looking good etc is looking great to accumulate down here,
could potentially be close to breaking the down trend
hopefully you got in a week ago when i called
eth analysis in 4th / eth stuck trianleeth stack in Contraction triangle/ but if the mane Process be Current /eth can break
