ETC Analysis (3D)ETC is showing a strong bullish structure, just like many other altcoins.
The key difference? ETC has already confirmed its breakout.
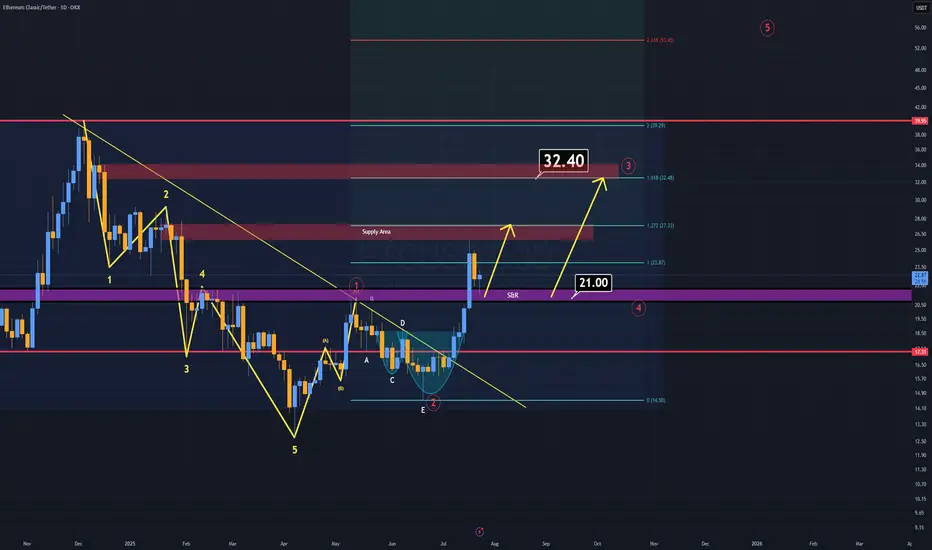
As long as ETC holds above the $21 level, I believe the minimum target sits at $32 in the coming weeks.
According to Elliott Wave Theory, that $32 region also marks the end of wave 3, which perfectly aligns with a daily supply block, a strong technical confluence.
Recently, ETC tapped the rebuy zone, highlighted in purple (S/R zone) on the chart.
Lower timeframes also support this bullish continuation scenario.
Momentum is on the side of the bulls.
S wishes you the best of luck!
ETCUSDT
#ETC/USDT Forming Strong Bullish Potential#ETC
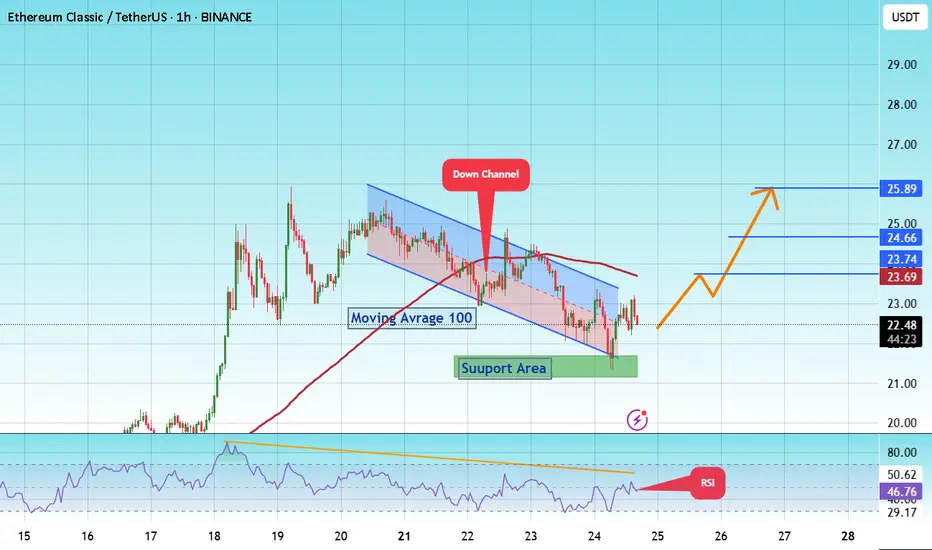
The price is moving within a descending channel on the 1-hour frame and is expected to break and continue upward.
We have a trend to stabilize above the 100 moving average once again.
We have a downtrend on the RSI indicator that supports the upward move with a breakout.
We have a support area at the lower boundary of the channel at 21.80, acting as strong support from which the price can rebound.
We have a major support area in green that pushed the price upward at 21.20.
Entry price: 22.50
First target: 23.70
Second target: 24.66
Third target: 25.90
To manage risk, don't forget stop loss and capital management.
When you reach the first target, save some profits and then change your stop order to an entry order.
For inquiries, please comment.
Thank you.
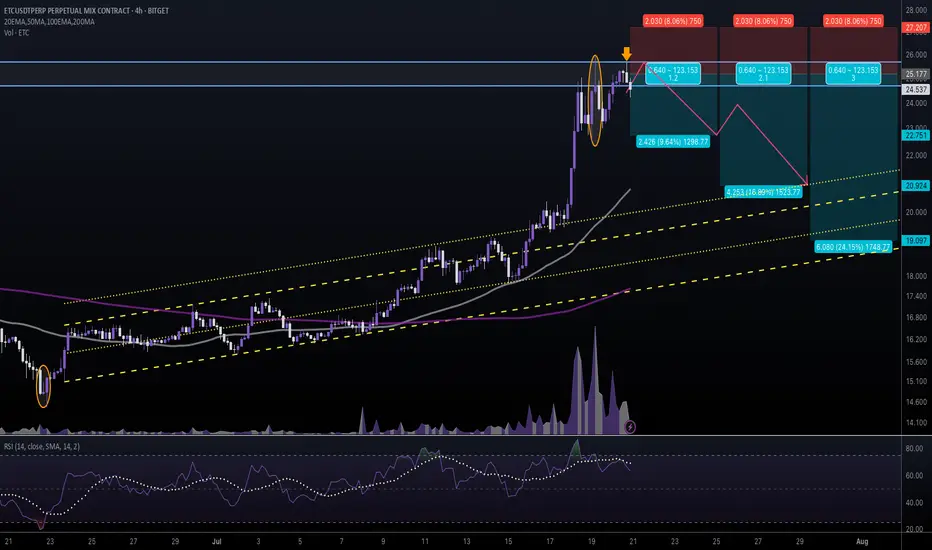
#ETCUSDT #4h (Bitget Futures) Ascending channel retestEthereum Classic printed two evening stars in a row, looks locally topped and ready for correction towards 50MA & 200MA supports.
⚡️⚡️ #ETC/USDT ⚡️⚡️
Exchanges: Bitget Futures
Signal Type: Regular (Short)
Leverage: Isolated (5.0X)
Amount: 5.0%
Entry Zone:
24.679 - 25.675
Take-Profit Targets:
1) 22.751
2) 20.924
3) 19.097
Stop Targets:
1) 27.207
Published By: @Zblaba
CRYPTOCAP:ETC BITGET:ETCUSDT.P #4h #EthereumClassic #PoW #L1 ethereumclassic.org
Risk/Reward= 1:1.2 | 1:2.1 | 1:3.0
Expected Profit= +48.2% | +84.5% | +120.7%
Possible Loss= -40.3%
Estimated Gaintime= 1-2 weeks
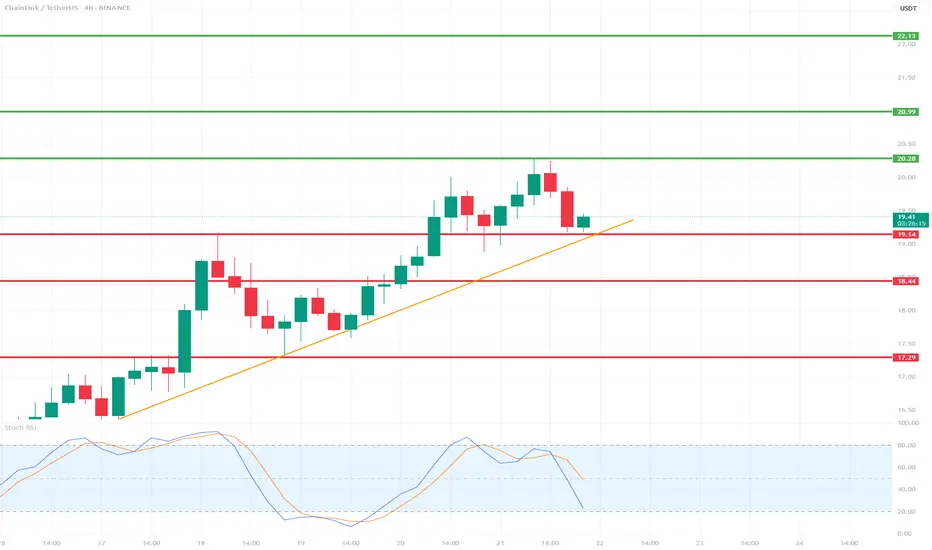
LINK/USDT 4H Chart📉 Indicators and Market Structure:
🔶 Trend:
Current trend: up, as long as it remains above the trend line and the 19.14 USDT level.
Local resistance: 20.28 USDT (recent high).
Next resistances: 20.99 USDT and 22.13 USDT (green lines).
Supports: 19.14 USDT, 18.44 USDT, 17.29 USDT (red lines).
🔷 Stochastic RSI (lower indicator):
Located in the oversold zone (below 20) and starting to reverse upward.
Potential signal of buying pressure if the %K and %D lines cross bullishly.
🧠 Scenarios:
✅ Bullish scenario (trend continuation):
Bounce from the trend line and the 19.14 level → breakout of 20.28 → test of 20.99–22.13.
Confirmation will be a clear bullish candle with high volume and a Stochastic RSI cross up.
❌ Bearish scenario (trend break):
Closing below the trend line and the 19.14 level → correction towards 18.44, and then even to 17.29.
An oversold RSI could support continued declines if a rebound does not occur.
📌 Summary:
Currently, the key level is the trend line and support at 19.14 USDT.
The market is waiting for a reaction – a rebound or a downward breakout.
Stochastic RSI suggests a possible rebound, but candlestick confirmation is needed.
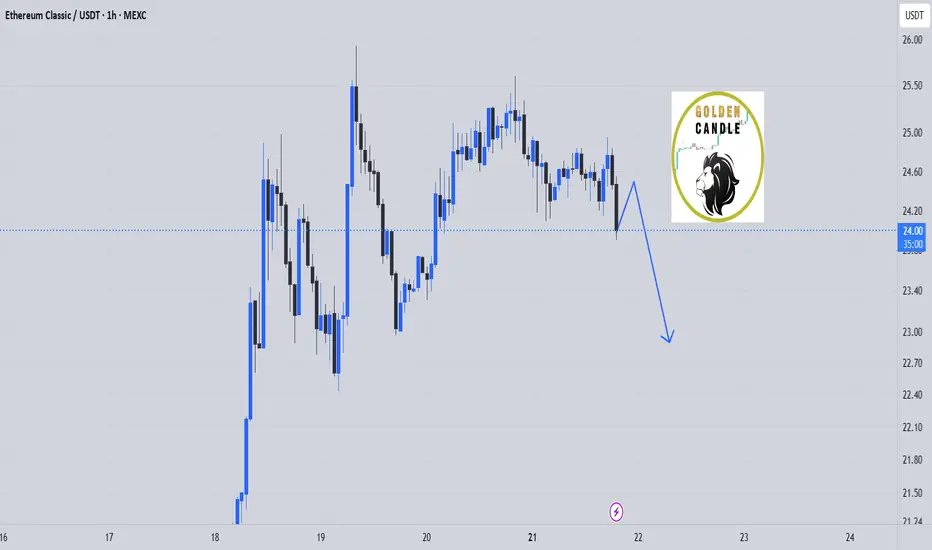
etc sell shortterm"🌟 Welcome to Golden Candle! 🌟
We're a team of 📈 passionate traders 📉 who love sharing our 🔍 technical analysis insights 🔎 with the TradingView community. 🌎
Our goal is to provide 💡 valuable perspectives 💡 on market trends and patterns, but 🚫 please note that our analyses are not intended as buy or sell recommendations. 🚫
Instead, they reflect our own 💭 personal attitudes and thoughts. 💭
Follow along and 📚 learn 📚 from our analyses! 📊💡"
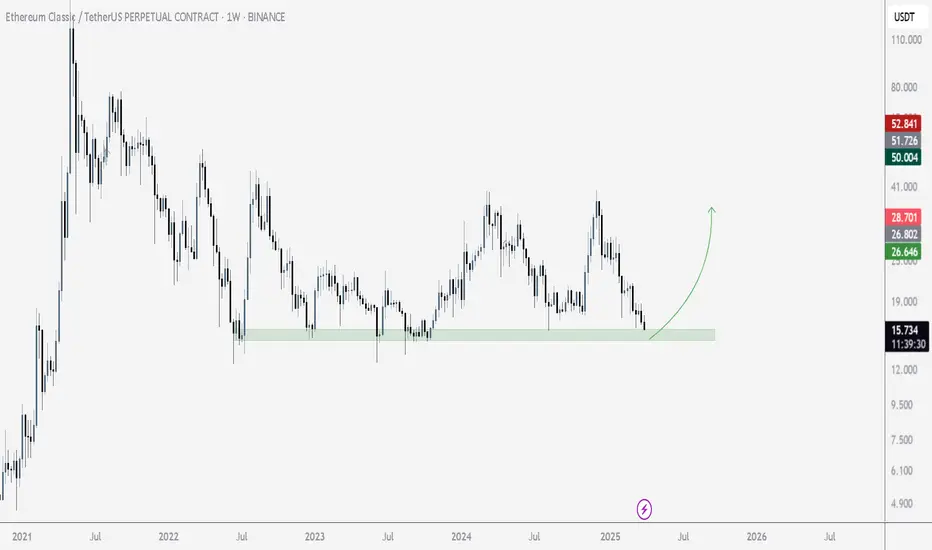
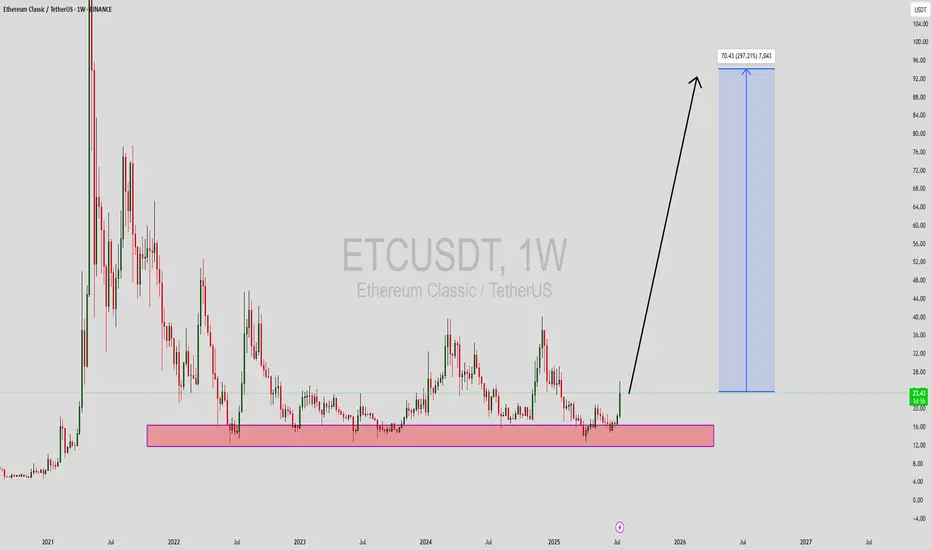
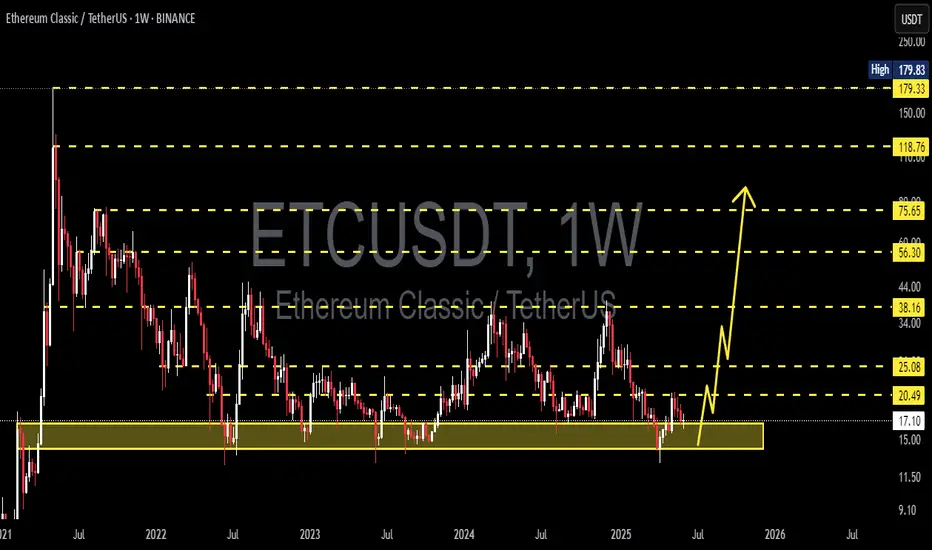
ETCUSDT Forming Strong Bullish PotentialEthereum Classic (ETCUSDT) is currently showing strong bullish potential as it emerges from a long-term accumulation zone. The weekly chart highlights a clearly defined support range where ETC has consistently rebounded in past cycles, and recent price action suggests another powerful move to the upside is brewing. With increased volume and momentum forming around the $15–$17 range, the price has broken out with significant strength, targeting an impressive 240% to 250% rally in the mid to long term.
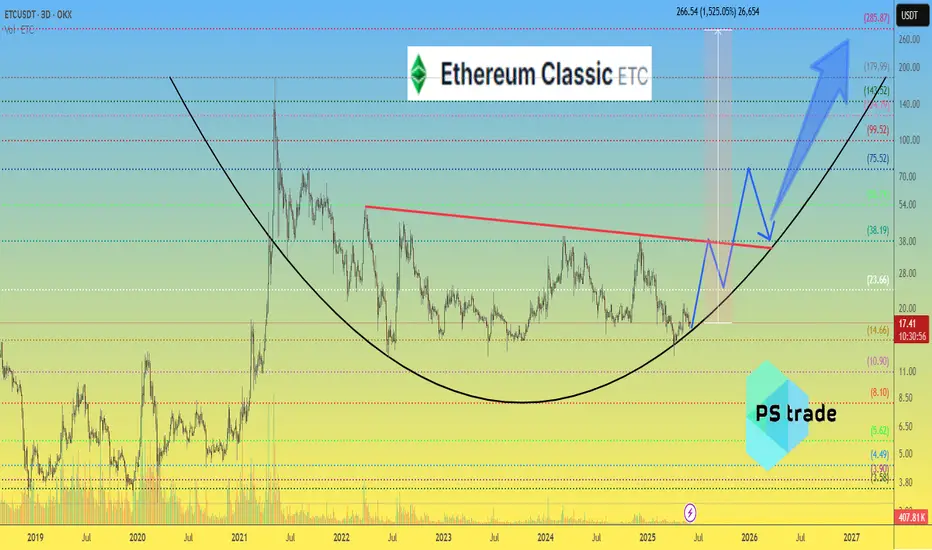
Technically, ETC has printed a long-term rounded bottom pattern, signaling a possible trend reversal. Such formations often lead to explosive upside moves once the neckline resistance is broken, and ETC appears to be in that breakout phase now. A projected target near $80–$95 aligns well with historical resistance zones from previous bull runs. This is an ideal setup for position traders looking for a high-risk, high-reward opportunity.
Investor sentiment around Ethereum Classic is turning bullish again, driven by renewed interest in proof-of-work (PoW) assets and a potential alternative to Ethereum following its full transition to proof-of-stake. With Ethereum Classic maintaining its original blockchain structure, it continues to attract a niche set of supporters and miners. Growing community support and speculative demand could be key drivers behind this expected price surge.
✅ Show your support by hitting the like button and
✅ Leaving a comment below! (What is You opinion about this Coin)
Your feedback and engagement keep me inspired to share more insightful market analysis with you!
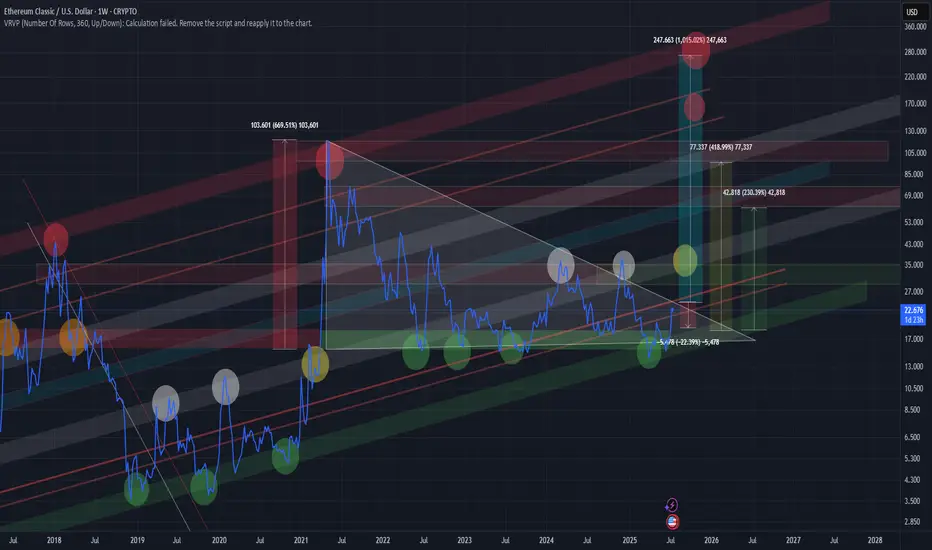
ETC/USD – Weekly Chart Overview Ethereum Classic is trading at a key long-term support zone, bouncing from the lower bound of a multi-year ascending channel. Historically, this zone has triggered large rallies (2019, 2020, 2021).
Major resistance levels are stacked at $24, $42, $77, and $103. If the price holds above $22–24 and breaks out with volume, it could retest the mid/high zones of the channel.
Structure remains bullish above $20. Break and hold above $26–27 may signal the start of a new macro wave.
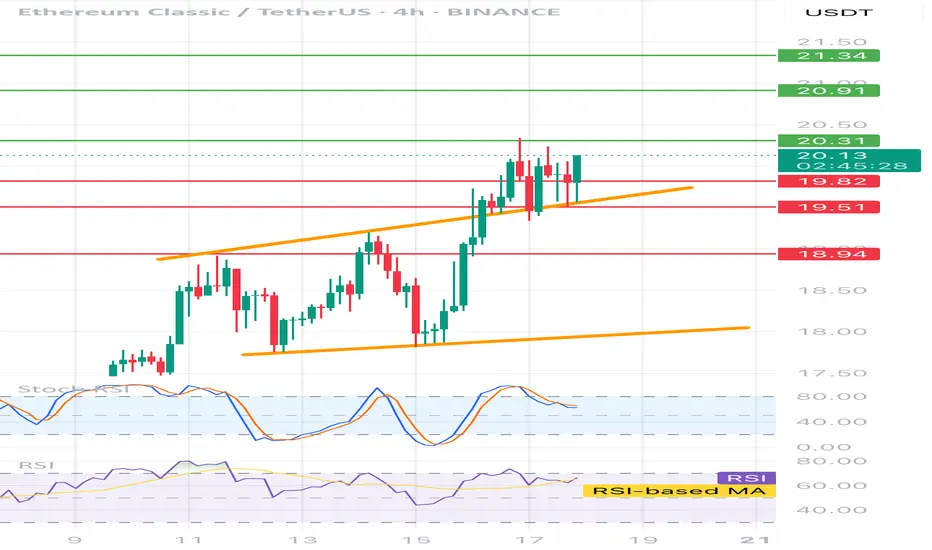
ETCUSDT 4H📊 Price:
Currently around 20.05 USDT
⸻
🔶 Technical formation:
• Ascending channel - clearly marked with two orange trend lines.
• The price is currently testing the upper edge of the channel - it is possible to break or correction.
⸻
📉 Support and resistance:
• ✅ Support:
• 19.73 (local, on the closure of the candles)
• 19.51 (technical, tested several times)
• 18.94 (stronger, historical)
• 🚫 resistance:
• 20.31 - the closest local resistance
• 20.91 - key level
• 21.34 - strong resistance from higher intervals
⸻
🔄 oscillators:
• STOCHASTIC RSI - in the inheritance phase (descent from buying), possible local decline / correction.
• RSI (14) - approx. 60, slightly positive trend, but without exaggeration - no purchase, place for further increases.
📌 Fast strategy:
• 🟢 Long: After breaking and Retescia 20.31 → TP 20.91 / 21.34
• 🔴 Short: after rejection 20.31 or the upper line of the channel → TP 19.73 / 19.51
• 📉 SL: In both cases, it is best 0.3–0.4% above the last high/low
Ethereum Classic:Buying opportunity?hello friends 👋
Considering the price drop we had, you can see that buyers are coming in less and less in the support areas that we specified for you, and this can be a good signal to buy in these areas step by step with capital and risk management and move to the specified goals.
🔥Follow us for more signals🔥
*Trade safely with us*
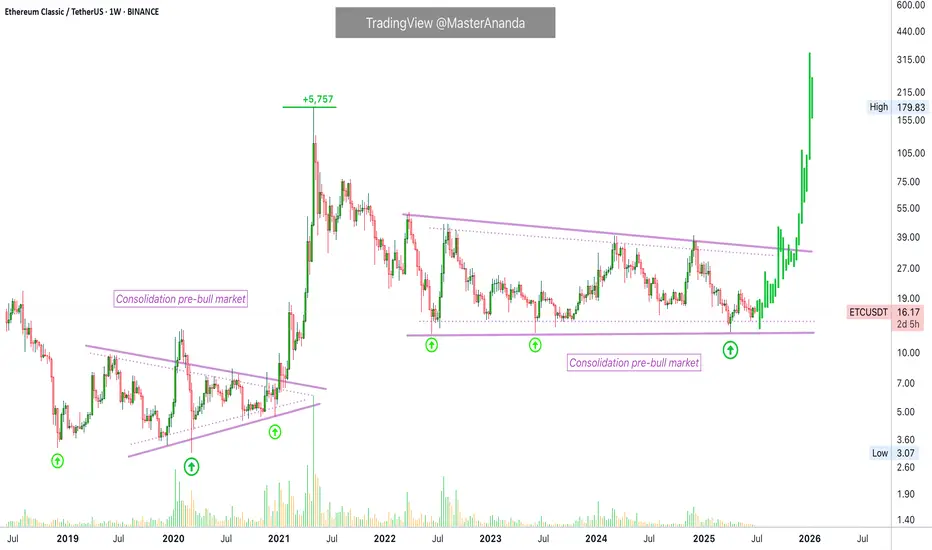
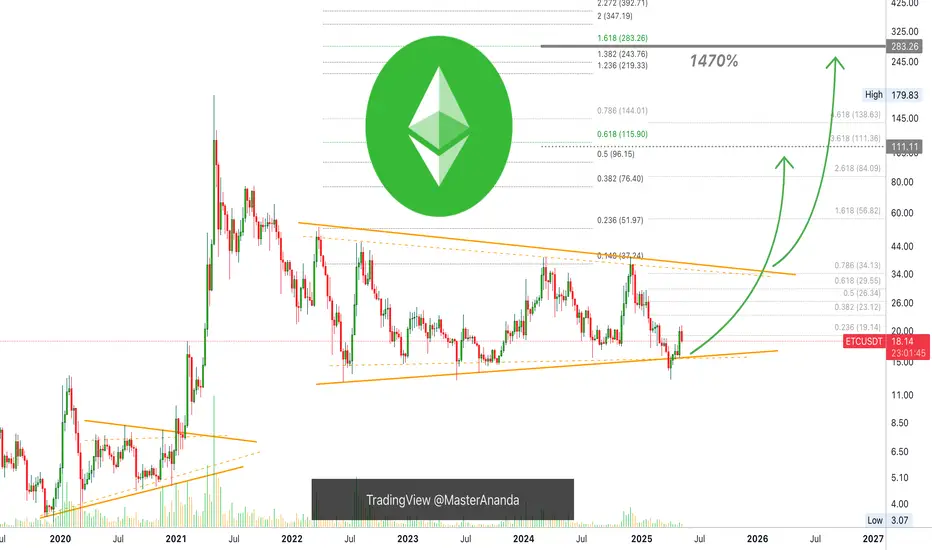
Ethereum Classic Long-Term Consolidation & The 2025 Bull MarketIt feels like we've been looking at the same chart for three years. Remember June 2022? A "small" 260% price bounce and we all did pretty good. Market conditions have not changed.
It's been three years and three years Ethereum Classic (ETC) continues to move, trade, sideways. A long-term consolidation phase.
The 2021 bull market was also preceded by a consolidation phase. This is marked on the chart.
The 2025 bull market is getting ready, we are still loading and I call for your patience once more but, you can know for certain that Cryptocurrency—the altcoins market—will meet all of your expectations and beyond.
The consolidation pattern has three major lows. June 2022, June 2023 and April 2025.
The last bull market produced total growth of 5,757% from bottom to top.
The current consolidation pattern has a technical triple-bottom. Higher lows each time but only by a few cents. We are only missing the bull market wave and bull run phase.
Think of something similar to what we saw between December 2020 and May 2021. Or, instead of a 6 months long bullish wave, we can get a 12-18 months long bullish cycle. Slow and steady growth.
It is likely to go fast because the consolidation phase has been so long. There is no need for long drawn-out bullish cycle, the market had plenty of time to test everyones patience and reset.
You know how Crypto goes, once it starts moving there is no going back. Nothing slow, fast and strong. That's my guess of course but I am open to seeing anything develop and I will update, adapt and change if something different happens.
One thing is certain, Ethereum Classic will grow.
We are getting closer with each passing day. The best is yet to come.
Namaste.
#ETC/USDT#ETC
The price is moving within a descending channel on the 1-hour frame, adhering well to it, and is heading towards a strong breakout and retest.
We are experiencing a rebound from the lower boundary of the descending channel. This support is at 16.
We are experiencing a downtrend on the RSI indicator, which is about to break and retest, supporting the upward trend.
We are heading for stability above the 100 moving average.
Entry price: 16.50
First target: 17
Second target: 17.50
Third target: 18

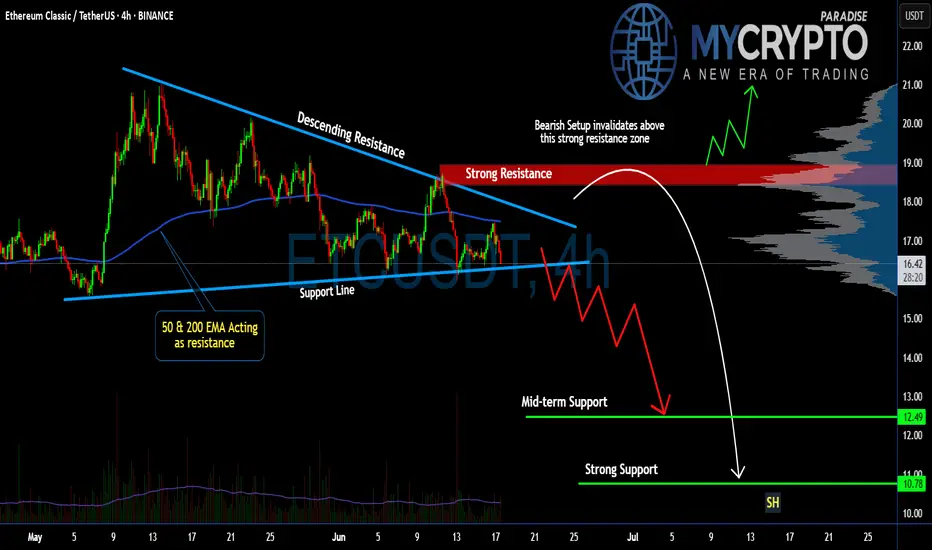
Is #ETC Ready For a Breakdown or Will it Recover From Here? Yello Paradisers! Have you checked what’s unfolding on #ETCUSDT lately? Let's look at the latest moves of #EthereumClassic:
💎#ETC has been trading inside a descending triangle for weeks, and once again, it failed to break above its strong descending resistance line, with the 50 & 200 EMAs acting as a dynamic ceiling on every rally attempt. These two indicators are stacking against the bulls, reinforcing the overhead pressure and keeping ETC pinned below key resistance levels.
💎The red zone between $18.60 and $19.20 has been acting as a strong resistance area and that’s exactly where the last bounce got rejected. The setup is clear: as long as price remains below this red supply zone, any short-term bullish case is invalidated. Each rejection here only fuels further downside conviction.
💎Unless we see a high-volume breakout and hold above $19.20, the structure remains extremely vulnerable. This is the invalidation level for the bearish thesis. If bulls can't flip that, the current pattern suggests continuation to the downside.
💎#ETCUSD is currently hovering around $16.50, with short-term bounces being aggressively absorbed. The mid-term support zone around $12.49 is likely the first magnet for price, but don’t get too comfortable there. The real target lies deeper: the strong support zone around $10.78 is shaping up to be the key smart money reaccumulation area if the selling intensifies. This is where real interest may return—but only after retail gets flushed.
Trade smart, Paradisers. This setup will reward only the disciplined.
MyCryptoParadise
iFeel the success🌴
ETCUSDT 1W Analysis ETC ~ 1W Analysis
#ETC Buy back in increments from here with a short term target of at least 20%+ and a long term target of $80
Ethereum Classic ETC price analysisToday, we will talk about the prospects for the #ETC price
For those who have been in the crypto market not a long, we remind you that the primordial from the House of Targaryen #Ethereum was #EthereumClassic
But its fork CRYPTOCAP:ETH has surpassed it tenfold...
The moral is better to be “flexible” and adapt to situations and opportunities, not stubborn...
But perhaps soon the price of OKX:ETCUSDT will shoot up after a super long consolidation with a base around $15.
1⃣ In 2017, the #ETC price made more than 5000% growth after almost a year of consolidation
2⃣ In 2021, the #ETC price rose by more than 2000% after 2 years of consolidation
3⃣ Now the corrective consolidation of the OKX:ETCUSD price has been going on for more than 4 years, maybe it's time to start a rapid wave of growth by at least +1000-1500% ?)
By the way, did you notice the pattern? write in the comments !)
_____________________
Did you like our analysis? Leave a comment, like, and follow to get more
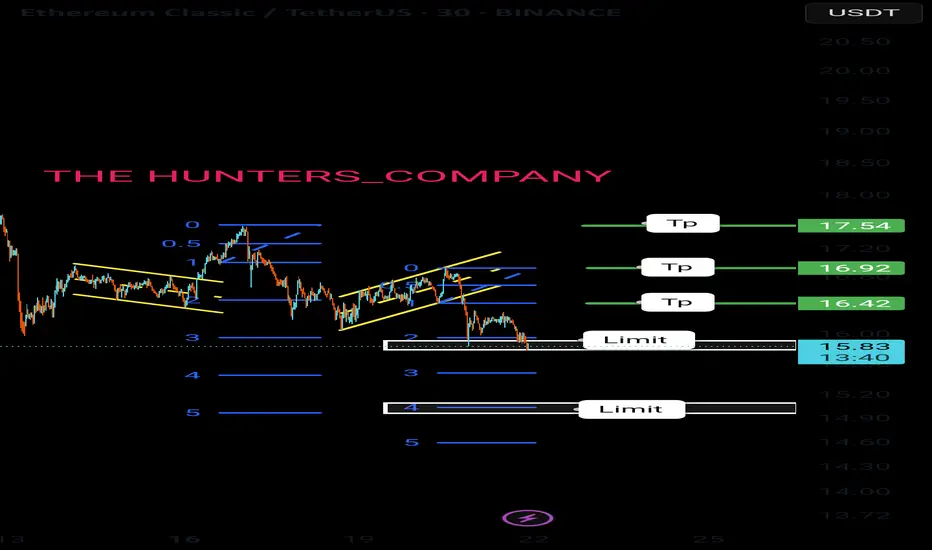
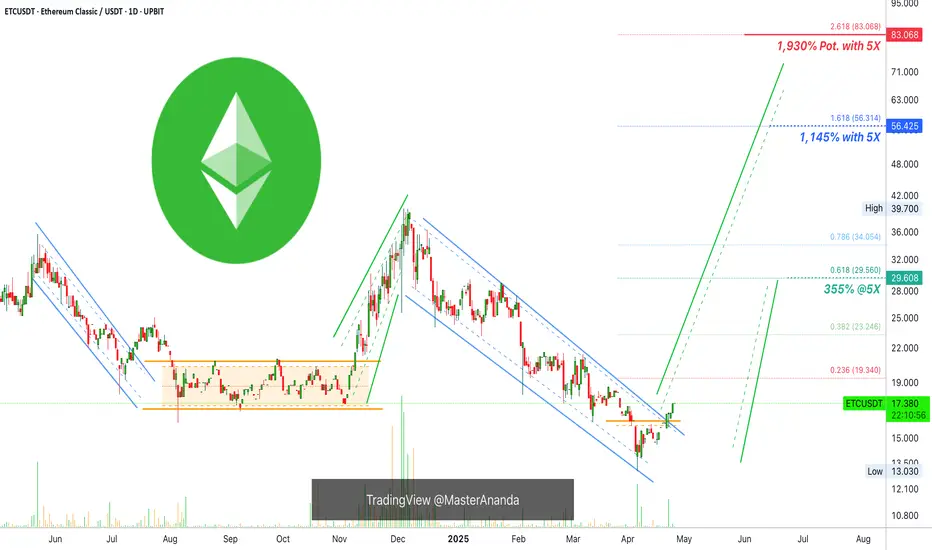
Ethereum Classic 5X Lev. Full PREMIUM Trade-Numbers (PP: 1930%)Good afternoon my fellow trader, I have another one for you.
This is a high probability trade setup.
This is a high probability trade and is easy to take.
Two main guess to approach this set of numbers:
1) Buy and hold and wait until 500% up and take profits. 500% profits not a rise of 500%.
2) Wait until the final target patiently and collect the full bounty for this trade.
There are many other ways to approach these numbers and this is up to you. But the time is right now... It will be months before the charts produce conditions like ones available today, similar and years before something like this is repeated. This opportunity does not present itself often.
Full trade-numbers below:
_____
LONG ETCUSDT
Leverage: 5X
Entry levels:
1) $18.0
2) $17.0
3) $16.0
4) $15.0
Targets:
1) $19.1
2) $23.1
3) $26.3
4) $29.5
5) $34.1
6) $39.9
7) $46.4
8) $50.3
9) $56.8
10) $67.2
11) $74.6
12) $84.1
Stop-loss:
Close monthly below $14.5
Potential profits: 1930%
Capital allocation: 4%
_____
In several months, not many but just 2 full months maybe we will have the first high. This high will be followed by a correction and once this correction is in we will have similar conditions to now but not as good because bottom prices won't be available for more than a few hours or days at max.
To repeat the same situation we have now across all Altcoins, it will take years, when the next bear market hits bottom. And then it will repeat again before the next bull market around 2029 or 2028. So this is a solid opportunity for you to take.
Leveraged trading is for those with experience already with some form of trading. After you trade for a while, you can engage this tool and not produce many loses while learning. If you start with leverage right away, you might end up quitting in disgust with tons of losses. So make sure to be smart when approaching this tool as there is the risk of becoming an addict and major losses.
If you have a messed up mind and life and need money, stay away.
If you have a good life, you feel grateful about the air you breathe and you can see the stars, the moon and appreciate a simple breeze, you can make huge money with this system.
If you lie to people and to yourself the market will take everything away. If you are honest with yourself and can accept your mistakes, it doesn't matter what you do you will be successful in the end. It is all a mental game.
What's on your mind?
Depending on your thoughts, you produce your results.
Think positive, love yourself and love life, and you already won.
Being ungrateful, hating and with a bad mood always for this or that, blaming others, the market will take everything from you. It will only give you space to breathe once you see yourself and accept your mistakes.
You are responsible for your own actions.
This is not financial advice.
You are appreciated and thank you for reading.
Namaste.

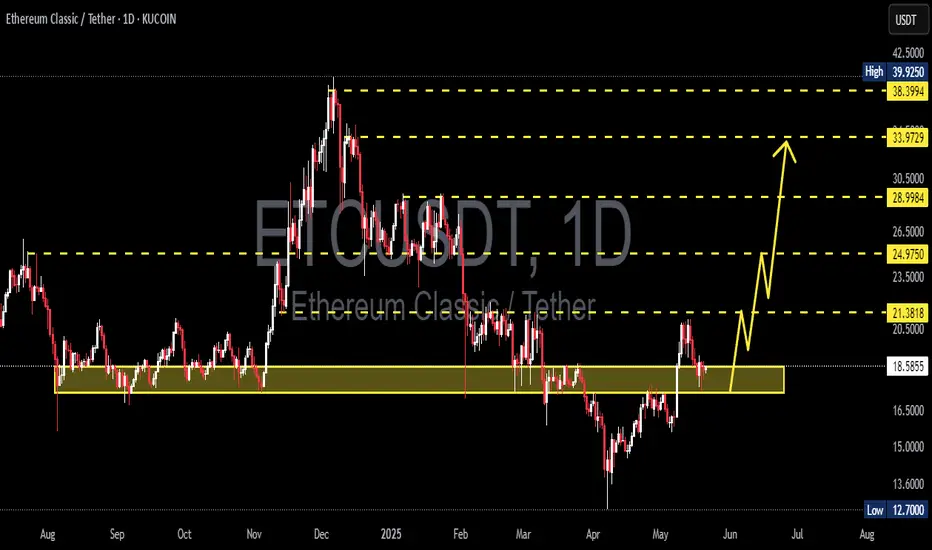
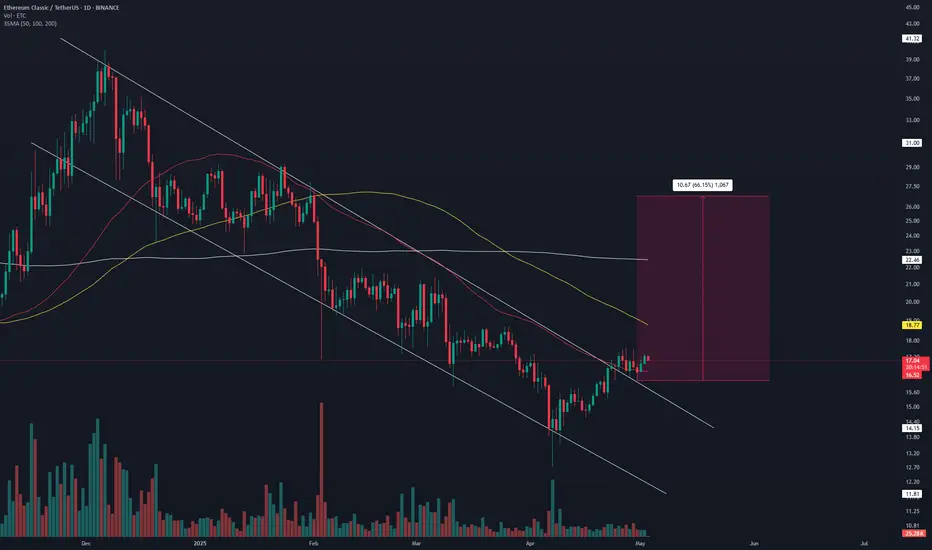
ETCUSDT 1D AnalysisETC ~ 1D Analysis
#ETC Buy incrementally on this support block with a short term target of at least 15%+ from here.
Ethereum Classic 5X Lev. Trade Reminder (PP: 1470% Spot)I have a set of trade-numbers for ETCUSDT with 5X Leverage. I will not post them again but instead will link them below, this is a friendly reminder.
The small retrace now is sending prices back into our entry zone or entry levels. "The market always gives a second chance."
You see, there is no need to rush to try and catch a bullish wave. Notice how the market always offers countless chances after the bottom is in. Right?
Ethereum Classic started to move up but retraced back into the entry zone. Rushing can produce a buy at $21 and then a liquidation. Being patient allows for a lower entry and then massive profits. Notice how long it takes for the market to move.
Many people message me saying, "OMG! I don't want to fomo buy." "I don't want to miss-out, fast, I have to buy." But nothing is happening fast. We are here day after day, always, and we can see the swings and the waves.
If one pair starts moving, that's ok, there will always be another pair trading at bottom prices. Instead of buying LONG the one at resistance, go LONG with the one at support. This is a great example.
ETCUSDT is looking good now because prices are lower and an entire week red. This is good, simply more consolidation before the start of the 2025 bull market phase-wave.
We are going up, and it will be awesome.
Namaste.
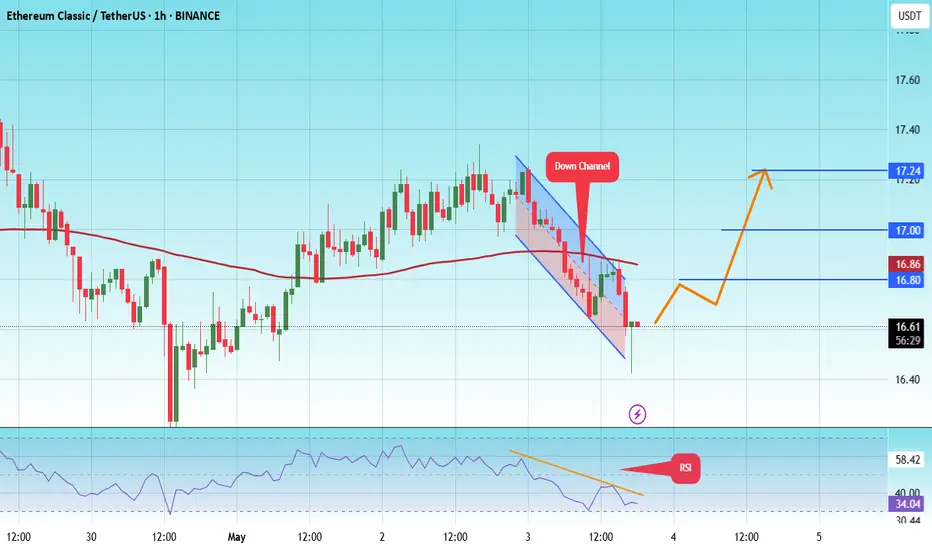
#ETC/USDT#ETC
The price is moving within a descending channel on the 1-hour frame and is expected to break and continue upward.
We have a trend to stabilize above the 100 moving average once again.
We have a downtrend on the RSI indicator that supports the upward move with a breakout.
We have a support area at the lower boundary of the channel at 16.50, which acts as strong support from which the price can rebound.
Entry price: 16.62
First target: 16.80
Second target: 17.00
Third target: 17.24
ETCUSDT Analysis D1ETCUSDT Trendline Breakout & Retest Has Already Confirmed, Currently Consolidating Within Bullish Pennant Once Pennant Got Cleared, Etc Can Lead Solid Recovery Towards 30-35$ In Coming Days .
ETC/USDT 4h chart Hello everyone, let's look at the 4h graph etc to USDT, in this situation we can see how the price came out of the top of the lasting downward trend. Going further, let's check the places of potential target for the price:
T1 = $ 17.44
T2 = $ 18.75
Т3 = 20.73 $
T4 = 22.48 $
Let's go to Stop-Loss now in case of further declines on the market:
SL1 = $ 16.25
SL2 = $ 15.05
SL3 = $ 13.74
SL4 = $ 12.66
Looking at the RSI indicator, we see
As we entered the upper part of the range again, which apparently affected the slow price of the price.

ETCUSDT 1D AnalysisETC ~ 1D Analysis
#ETC Buy after successfully penetrating this resistant line with a large volume, a minimum target of 10%+.

$ETC on bottom"Ethereum Classic is currently in a range box on the weekly timeframe and is now at the bottom of the channel. It has the potential to move up to the top of the box. After confirmation, you can consider entering a long position."