The key is whether the price can hold above 3900.73-4107.80
Hello, fellow traders!
Follow us to get the latest information quickly.
Have a great day.
-------------------------------------
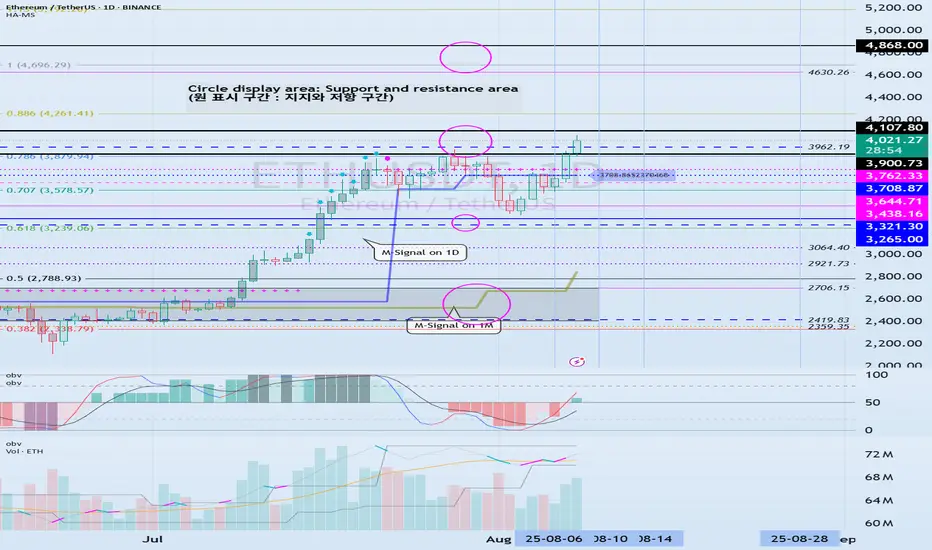
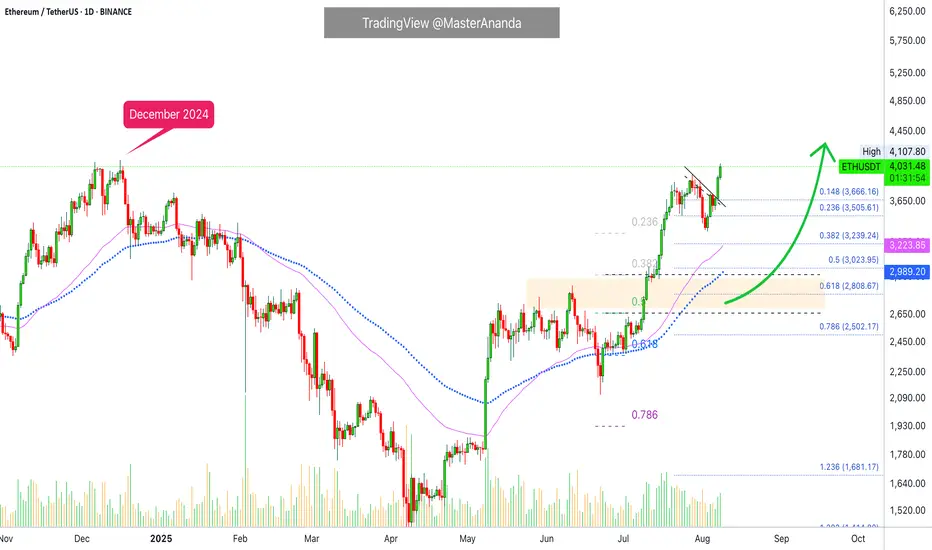
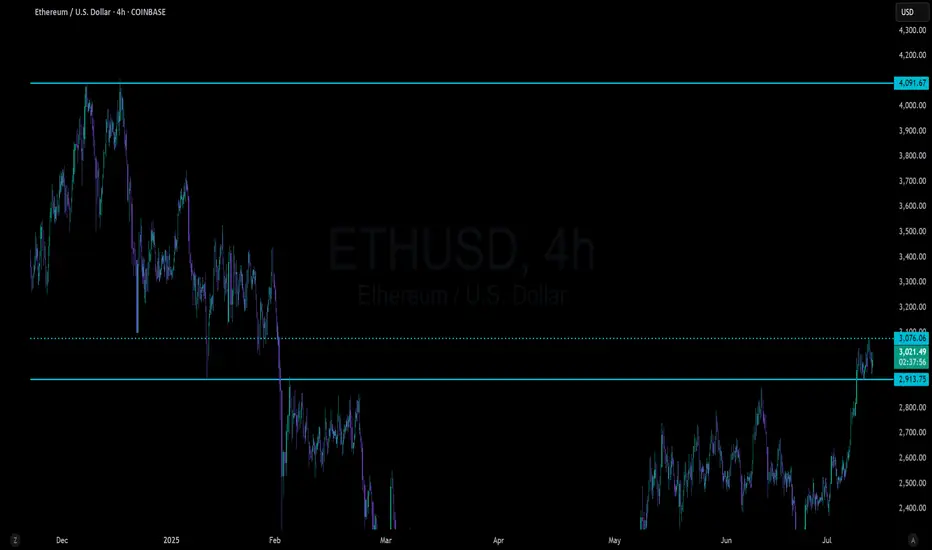
(ETHUSDT 1D chart)
This period of volatility is expected to last from around August 6th to 14th (maximum from August 5th to 15th).
The key question is whether the price can find support and rise above the 3900.73-4107.80 range after this period of volatility.
The next period of volatility is expected to occur around August 28th, so we need to see if the price can hold until then.
If the price declines, we need to check for support around the HA-High ~ DOM (60) range of 3708.87-3762.33.
If not, there's a chance it could fall below 3265.0-3321.30.
-
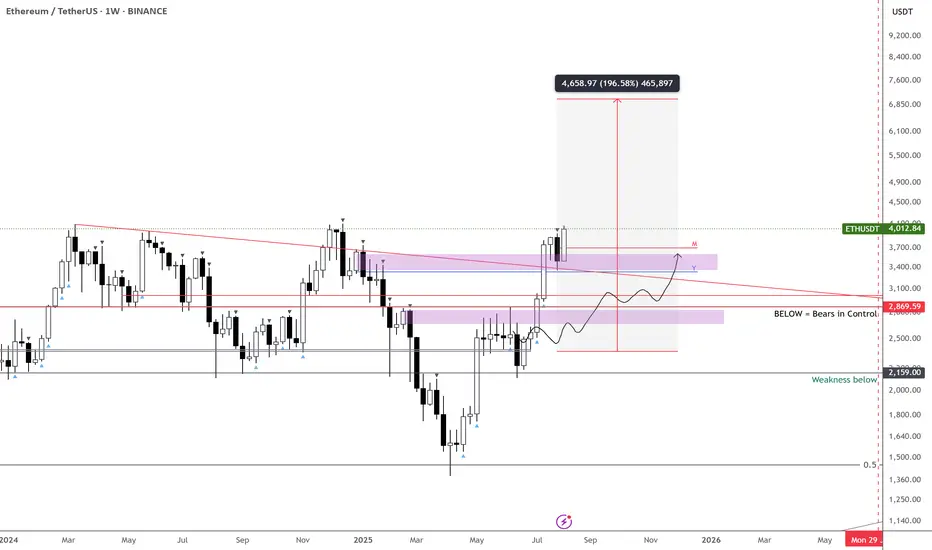
(1M Chart)
The TC (Trend Check) indicator has risen above 0, suggesting a high possibility of further upside.
Therefore, the key point to watch is whether it can rise above the 4630.26-4868.0 range.
For an uptrend to continue,
- The StochRSI indicator must remain upward with K > D.
(If possible, it's best to avoid K entering the overbought zone.)
- The On-Board Volume (OBV) indicator of the Low Line ~ High Line channel must remain upward.
(If possible, it's best to maintain OBV > OBVEMA.)
- The TC (Trend Check) indicator must remain upward.
(If possible, it should remain above 0.)
If the above conditions are met, the uptrend is likely to continue.
To sustain an uptrend by breaking above key support and resistance levels,
- The StochRSI indicator must remain below the overbought zone and remain above D.
- The On-Board Volume (OBV) indicator of the Low Line ~ High Line channel must rise above the High Line and remain upward.
- The TC (Trend Check) indicator must remain upward. (If possible, it should remain above the 0 point.)
When the above conditions are met, there is a high probability that the price will rise after breaking above important support and resistance levels.
-
Thank you for reading to the end.
I wish you successful trading.
--------------------------------------------------
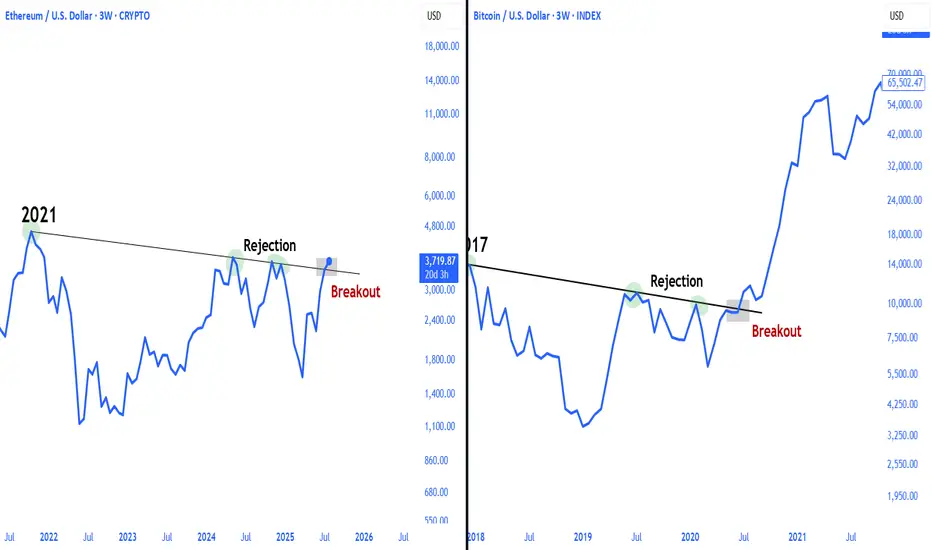
- Here's an explanation of the big picture.
(3-year bull market, 1-year bear market pattern)
I will explain more in detail when the bear market begins.
------------------------------------------------------
ETH-D
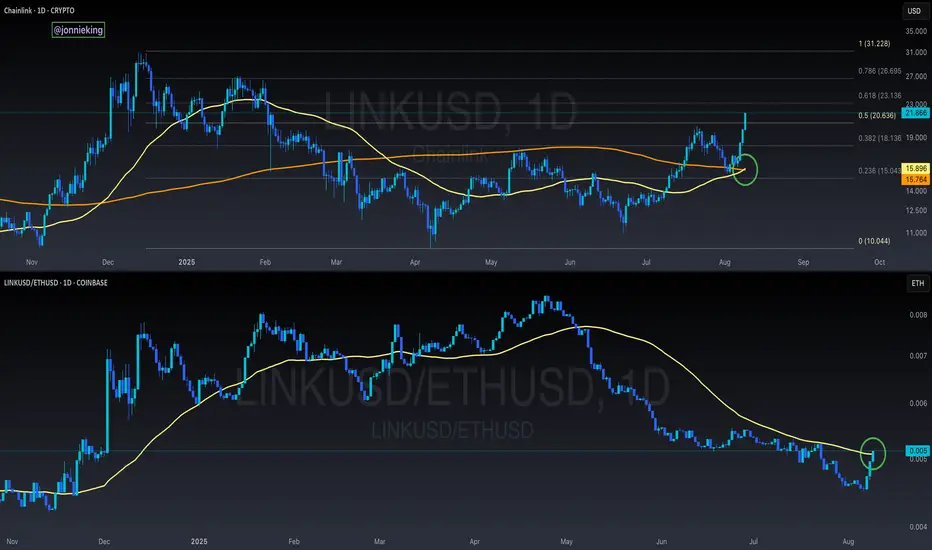
$LINK Golden Cross Confirmed on DailyChainlink is looking extremely bullish here.
Closed above the 50% Gann Level and just had a GOLDEN CROSS.
Normally we see a pullback once this happens, but no sign of slowing down yet from CRYPTOCAP:LINK
Also worth noting LINK is breaking above the 50DMA against ETH.
This was added confirmation for the breakout with ETH / BTC.
Remember the rotation for Alt Season:
BTC > ETH > LARGE CAPS (pending) > Mid Caps > Micro Caps
ETHUSDT 12H chart uptrend1. Breaking out of the downward channel
• Black lines show an earlier inheritance channel.
• The course struck the mountain and it is quite dynamically, which is a strong upward signal.
2. Current price
• ETH is around USD 4,274, just below the resistance at USD 4,304.
• Another resistance is 4,484 USD (potential target if the upward trend persists).
3. Support
• The next support: 4,048 USD - if the course is corrected, then there may be the first "test".
• stronger support below: USD 3,930, $ 3,709, $ 3,487.
4. Indicators
• MacD: MacD line strongly above the signal, the histogram is growing - confirms the upward trend.
• RSI: around 75 - close to the purchase zone, which can mean a short -term correction, but with a strong RSI trend can stay high for a long time.
5. Scenarios
• Bull: Punction and maintenance above USD 4,304 can open the road to 4,484 USD and possibly higher.
• Bear: rejection from USD 4,304 and a descent below 4,048 USD may cause a deeper correction in the direction of $ 3,930 or even $ 3,709.
📌 The short -term market is warmed up, so a small pullback is possible, but the structure looks very bullshit after this burst from the downward channel.

ETH is ready to Drop Sharply Now it time to Short ETH, a big drop is going to start .
Fasten your seatbelt

$ETH All Time High Soon?CRYPTOCAP:ETH wave 3 is still underway and its the only news you've been hearing about for 2 weeks! The hype is real making the potential top of this move much closer as institutions will be selling into the FOMO soon. There is no better way to trap newbies than a poke above all time high before a savage retracement!
Retracement targets are the daily pivot and rising 200EMA at $3337 the .382 Fibonacci retracement from the wave 2 bottom, just above the weekly pivot point. Daily RSI has huge bearish divergence.
Secondary retracement targets are the weekly 200EMA and S1 weekly pivot sitting at $2250 which could present an incredible buying opportunity before the real alt season!
Analysis is invalidated below $2122
New long signals are building in the DEMA PBR and Price Action strategies so keep an eye out on the Trade Signals Substack as we have made very good profits lately in these markets!
Safe trading

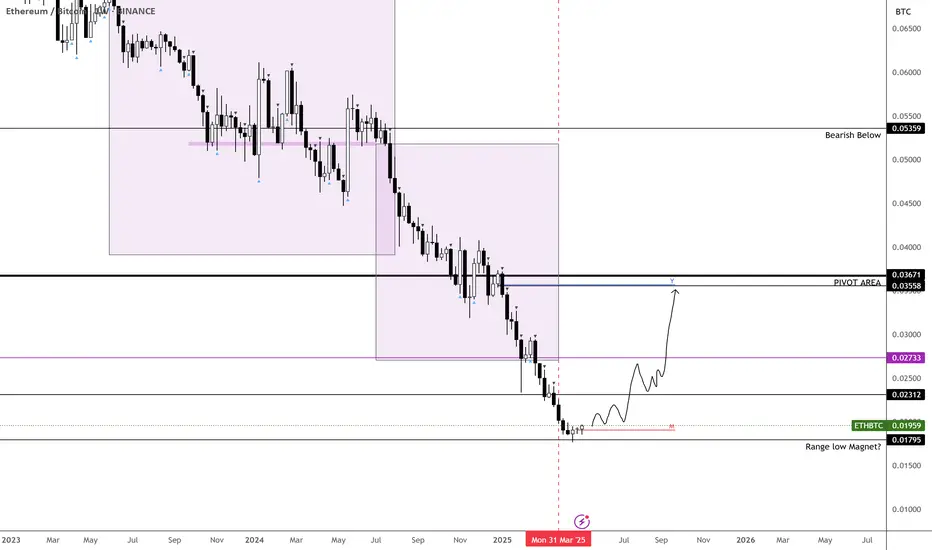
ETHBTC – Bottom Likely In!Finally stepping in to say it—ETHBTC has likely bottomed.
April marked the final month of its bearish phase, and it just tapped the impulse zone from the last major move, which also lines up with a key range low we haven’t seen since December 2019.
The weekly is starting to show early signs of strength, adding weight to this being a pivotal area.
From a risk/reward standpoint, this is arguably the best BINANCE:ETHBTC setup in a long time.
Time to act accordingly—this could be the moment many have been waiting for. I expect BTC dominance to give alts some room over the next couple of weeks. The real test comes in July.
MARKETSCOM:ETHEREUM BINANCE:ETHUSDT
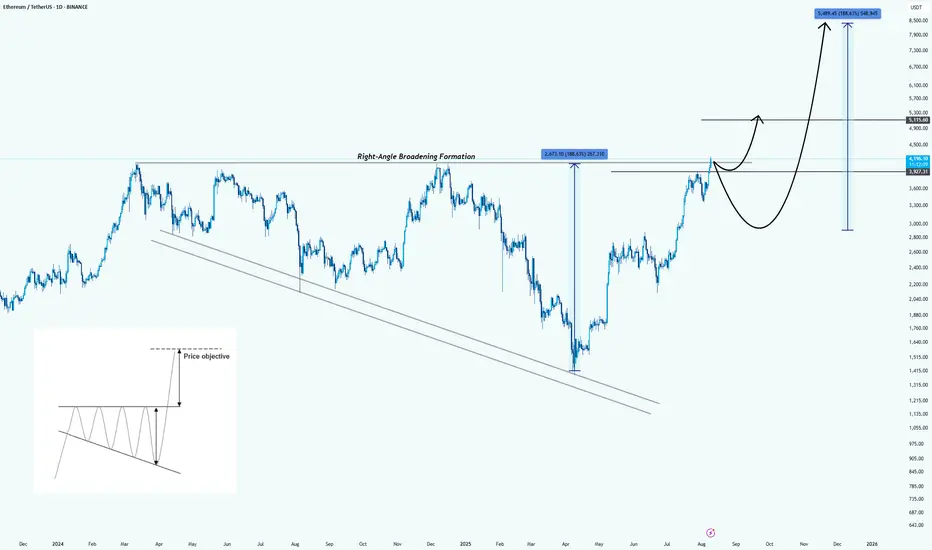
Ethereum: Formed a Right-Angle Broadening FormationHello guys!
Pattern Identified:
This is a Right-Angle Broadening Formation (characterized by a flat resistance level at the top (around $4,200 – $4,300) and a rising lower trendline). It shows increasingly volatile swings upward while repeatedly testing the same ceiling.
Technical Implication:
RABFs are typically bullish continuation patterns. The flat top acts as a breakout trigger, while the rising base indicates consistently higher lows and aggressive buyer support.
Price Objective:
According to the pattern’s measured move principle, the breakout target is projected by the vertical height of the formation, added to the breakout point:
Height : $2,070
Breakout point : $4,300
Target : $6,370 (first objective)
Extended bullish run could reach $8,500 if momentum sustains.
Key Levels:
Resistance: $4,200 – $4,300 (breakout trigger)
Support: $3,700, then $3,200
First measured target: $6,370
Extended target: $8,500
Bullish Scenario:
Strong daily close above $4,300 with volume could kickstart a rapid move toward the first target, possibly with only a brief consolidation at $5,100 before continuation.
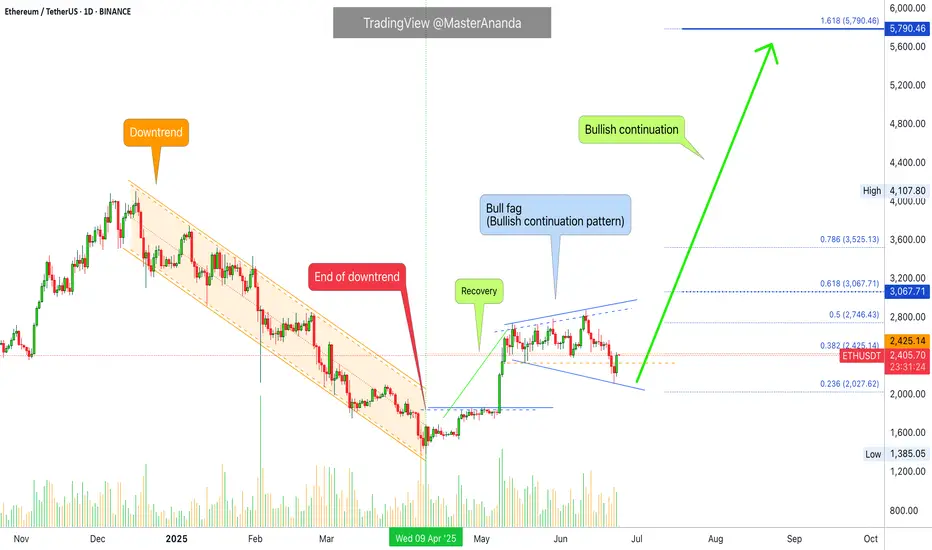
ETH - Eyes on a New All-Time High?ETHUSDT has been on fire lately, following a textbook bullish structure of Impulse → Fakeout → Impulse.
After breaking above the previous range in July, ETH confirmed strength with a sharp impulse move, only to shake out weak hands via a fakeout retest before pushing higher again. 📈
Currently, ETH is in the midst of another impulsive leg, with the next major target sitting at the ATH around $4,876.
📊 Key Notes:
- Fakeouts have served as liquidity grabs before strong rallies 🏹
- Current momentum favors the bulls 🐂
- As long as price holds above the last breakout zone (~$4,050–$4,150), the path of least resistance remains up.
🎯 Next Stop: ATH and beyond if bullish pressure sustains.
📚 Always follow your trading plan regarding entry, risk management, and trade management.
Good luck!
All Strategies Are Good; If Managed Properly!
~Richard Nasr

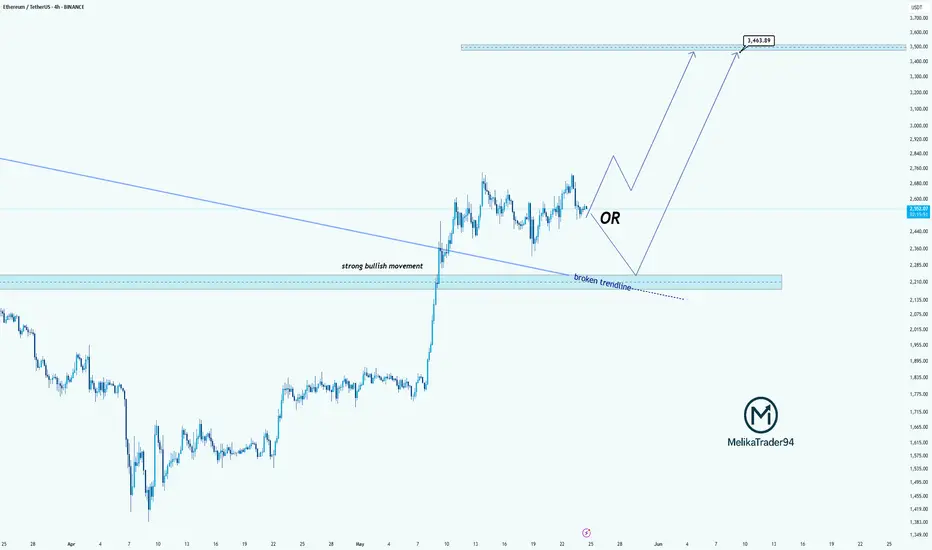
ETH Continues Bullish Momentum Above Broken TrendlineHello guys!
Ethereum has shown a strong bullish rally, breaking through a long-standing descending trendline with significant momentum. Currently, price action is consolidating above the broken trendline, which may now act as a support zone.
🔹 Scenario 1 (Bullish Continuation): If ETH holds above the current range and confirms the broken trendline as support, we could see a continuation toward higher resistance levels around $3,500 and beyond.
🔹 Scenario 2 (Deeper Retest): Alternatively, a pullback toward the $2,200–$2,300 area (highlighted zone) could offer a better accumulation point before the next bullish leg resumes.
This setup suggests that as long as ETH remains above the key support levels, the bullish structure remains intact.
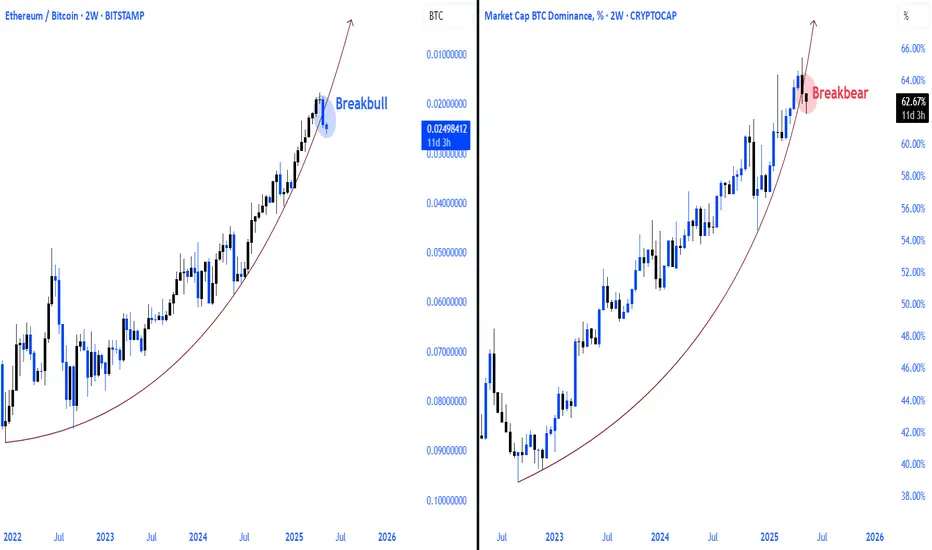
Eth/Btc vs Bitcoin Dominance Ethbtc parity and bitcoin dominance parabolic curve breakout occurred. bitcoin dominance down ethbtc will start the up process
Haven't Posted in a Bit, Here's a Solid Chart for You All!Alright, been a while, but here's the deal: still no altseason in sight.
Meanwhile, ETHUSDT dropping some serious hints of a wild bull run on this fractal chart. It s got that 2020 vibe, though the timing s a tad off especially when you factor in Bitcoin s cycles.
Gonna be a blast watching this play out!

Ethereum vs Small Cap. & The 2025-26 Cryptocurrency Bull MarketThe last three days ended up being a very nice flush, a strong one but the action quickly recovered above the 18-May low.
Ethereum was trading above $2,300 since mid-May and always stayed above this level. It broke suddenly below, out of nowhere, but the action is bullish again. We can say that this was a stop-loss hunt event, a bear-trap and nothing more or else we would see a continuation of the bearish action rather than a strong inverse reaction, a bullish jump.
It is not only Ethereum of course that is experiencing this type of bullish action, some altcoins are going nuts. Really crazy right now producing so much momentum that people are still wondering if the market is going down... Or is it going up?
It is obviously up, just look at the 7-April low.
Ethereum hit a low of $1,385 on 7-April. The higher low yesterday ended at $2,111.
You see what I mean?
The market is ultra-bullish because the last low is so far away. It is impossible that it will be tested even less possible for it to break. Ok, so a market shakeout we agree but now that the shakeout is complete what is supposed to happen next?
Watch the smaller altcoins.
Thank you for reading.
Namaste.
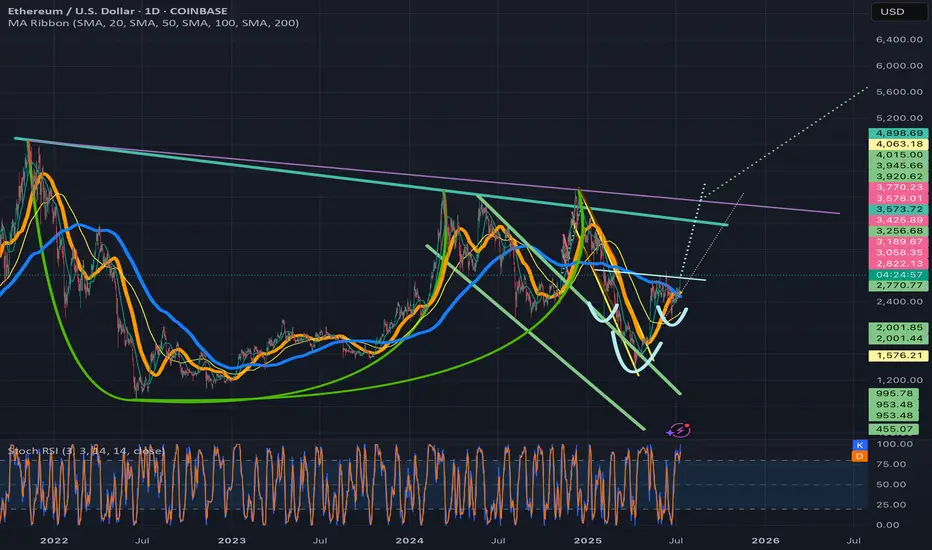
$Eth Ethereum nearing critical resistance....All Time High soon!This is a weekly candlestick chart of ETHUSD
Current price: 3800
CRYPTOCAP:ETH Ethereum recently broke out of a long-term downtrend, indicated by the red diagonal trendline. Price action has shifted from bearish to bullish. This is also a show of strong Momentum as recent candles are large and green, showing aggressive buying (strong bullish pressure).
If #eth continues in this uptrend then here are the resistance above to watch: 4000, 4800 and possibly new all time highs at 5600, 6400
Note worthy to know that the areas between 3800-4000 is very critical resistance.
Assuming a retracement from this resistance, Ethereum remain bullish above 2900
Invalidation of this idea is under 2900

Ethusd breaking above invh&sEthusd chart has a similar set upas the total2 chart, a cup and handle that is breaking up from a smaller inverse head and shoulders that will complete the handle to the cup. Ethereum actually has two potential to trendlines for its cup and handle and I wouldn’t be surprised if both are valid. The breakout target for the inverse head and shoulder pattern will take price action above both of them. Once we solidify the top trendline for the cup and handle patterns as support the breakout target for it is $7161. Ethereum just recently had a golden cross on the daily which adds to the probability the inverse head and shoulder pattern breakout will be validated. *not financial advice*
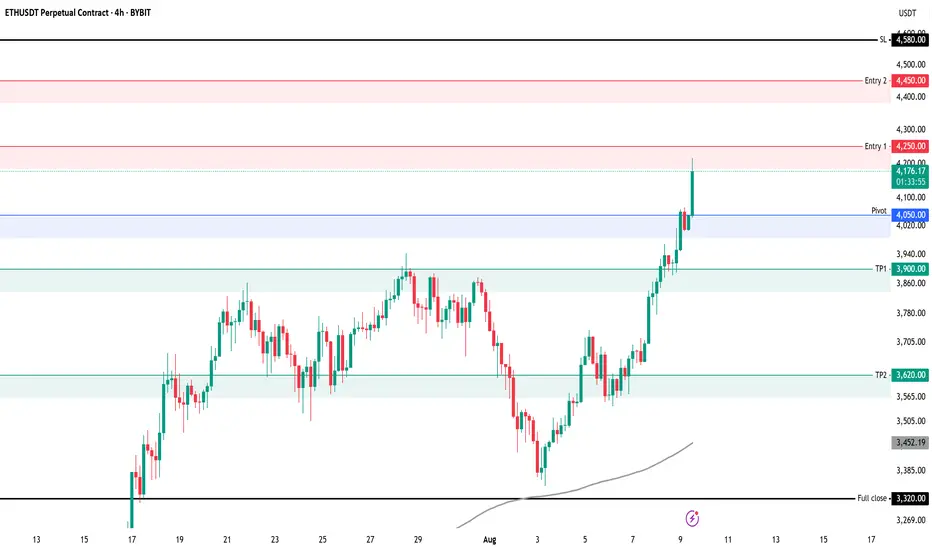
ETHUSDT ShortThese are the key areas we are looking for on ETH 4H
Risk per entry 0.25%
Entry 1: 4250
Entry 2: 4450
TP 1: 3900 or Pivot 4050
TP 2: 3620
Full TP: 3320
SL: 4580
Always manage your own risk. None of the above is financial advice.
ETH - The long call Man this took forever. On this way up, its likely to handily exceed the previous target of $4383 after some resistance. $6375 is definitely in the cards. Will this be Eths big year?

$ETH - Rising WedgeCRYPTOCAP:ETH | 4h
Price remains within the ascending wedge on the 4h chart, showing a triple tap on the trendline.
On lower timeframes, watching 3880 as local support for a possible bounce.
Upside levels to monitor are 4120–4215 for potential rejection, though an ideal pullback would see the lower trendline tested at 3770–3680.

$ETH - New monthly Signal! Been focusing heavily on CRYPTOCAP:ETH lately — price action remains clean, easy to read, and primed for a push into new highs.
By now, most of you should already have a solid position in $Ethereum. We’ve been calling some great entry spots, and if you’re still indecisive… this might be your last real chance.
The $3,400 zone held strong, and in my opinion, that’s the low for the next couple of months. We’ve also just triggered a fresh monthly signal inside this massive multi-month consolidation. If you’re expecting lower prices, you might be waiting a long, long time.
I’ve been eyeing the possibility of $10K since last month’s breakout opened the gate. Keeping our analysis grounded, $7K is the realistic target we should see this year — maybe even within the next two months.
Until the signal expires or the target is hit… keep holding.
Ethereum Hits a New All-Time High? Altcoins Bull MarketEthereum just hit its highest price since December 2024. Here is the thing, first XRP moves forward and we know the rest of the market will do the same. We saw this happen with Bitcoin Cash, it just kept on moving straight up and with this we knew the rest of the market to do the same. Then we have Litecoin and now Ethereum keeps on going higher. What one does, the rest follows.
Crypto will continue to grow; the altcoins will continue to grow and because the altcoins are growing Bitcoin will also continue growing. The altcoins growing and moving forward confirms that Bitcoin's top is not in, far from this being the case. So, Ether will continue to grow, Bitcoin will continue to grow and the smaller altcoins will follow.
Watch Solana go next and Dogecoin. Litecoin will be big of course. If you buy Litecoin now below $200, you will do good when Litecoin trades at $1,000 plus. The thing is that the next advance will change everything with the ETFs. Each time there is a bear market there is a crash and flush you can always buy again at market bottoms and lows. When a Crypto gets ETFs, corrections will not be the same. Demand will be too strong and we will experience long-term growth. Something like how Bitcoin is behaving now but also on some major altcoins. There will continue to be and appear new variations across the market. The altcoins will separate into different groups and cycles. The broader market cycle will continue to evolve. Things will never stay the same. Change is the only constant.
Namaste.
ETH/USDT 12h chart1. Punction of the downward trend
• The black inheritance trend line has been broken up - this is a strong signal of Bycza.
• Breaking was confirmed by a strong candle movement and high growth dynamics.
⸻
2. Key levels of support and resistance
• Support:
• 3930 USDT - previous resistance, now the defensive zone with possible correction.
• 3709 USDT - deeper support.
• 3488 USDT - critical support, below which the upward trend would be negated.
• resistance:
• 4048 USDT - current local resistance (the candle touched and lightly reflected).
• 4304 USDT - another strong resistance.
• 4484 USDT - long -term resistance and potential goal when continuing to grow.
⸻
3. RSI
• RSI is around 70 - close to the purchase zone.
• suggests the possibility of a short correction or consolidation before the upward trend continues.
⸻
4. Scenarios
Bycza (continuation of growth)
• Maintenance above 3930 USDT.
• Breaking over 4048 USDT opens the road to around 4300–4480 USDT.
Bear (correction)
• Rejection to USDTT 4048 and a decrease below 3930 USDT may bring a rate to around 3709 USDT.

ETHEREUM SEASON LOADING!Ethereum appears to be literally following bitcoin's pattern ahead of its 2021 bull run
ETH/USDT – Bullish Reversal Potential from Fibonacci Confluence 💡 Idea:
Ethereum is showing signs of demand absorption at a critical Fibonacci support cluster (0.5 – 0.618 retracement). VSA patterns confirm that selling pressure is being absorbed, hinting at a possible markup toward previous swing highs.
📍 Trade Setup:
Entry: Current levels near 3,551
Target: 3,937 (+10.82%)
Stop Loss: 3,338 (below last absorption zone)
R:R Ratio: ~1.79:1
📊 Technical Reasoning (VSA)
1. Stopping Volume at Fibonacci Support
ETH tested the 0.5–0.618 retracement zone from its prior bullish impulse.
Wide spread down-bars on high volume failed to produce significant downside progress, signaling professional buying.
2. No Supply Confirmation
Following the stopping volume, the market printed narrow range candles on decreasing volume, indicating supply exhaustion.
3. Demand Emergence
The recent push above short-term resistance came with increasing volume and wider up-bar spreads, suggesting the start of an accumulation-to-markup transition.
4. Structure & Fibonacci Confluence
Current rally aligns with the Fibonacci golden zone and past structural support.
📌 Trading Plan:
Enter on confirmed breakout above minor resistance with volume expansion.
Scale out partial profits near 3,800 and let remainder ride toward 3,937.
Keep stop below 3,338 to avoid being shaken out by false breakouts.
