Ethereum Outperforms Majors as Crypto Sentiment Shifts Again 🌐 Ethereum Outperforms Majors as Crypto Sentiment Shifts Again 🔄📊
Trump talks 401(k) crypto 🗞️, BTC reclaims the key $115,800 level 💪, but today we zoom into what the charts are screaming — and Ethereum is leading.
While headlines fly, structure never lies. Let’s compare ETH against other majors 👇
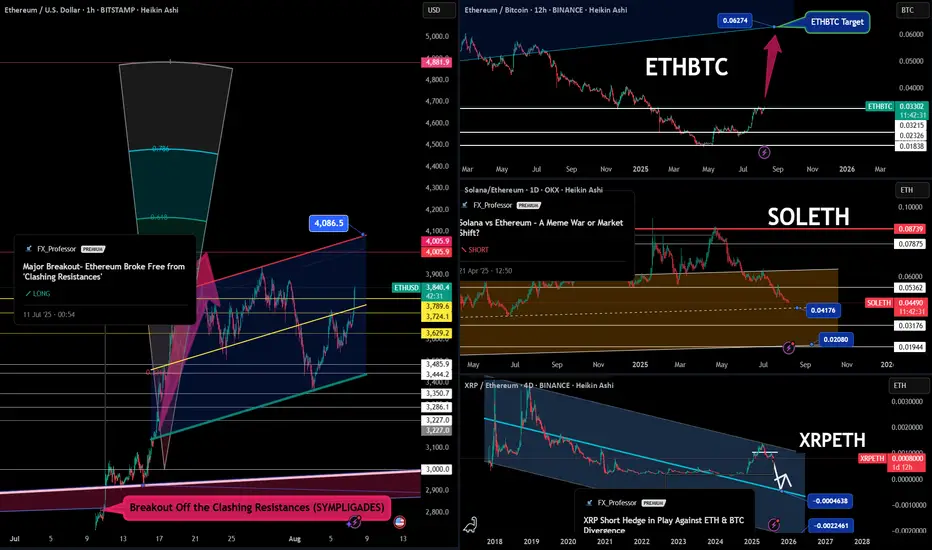
🔷 ETHUSD – The Breakout That Sparked It All
📈 ETH broke free from the "Clashing Resistances" zone (SYMPLIGADES).
It’s now targeting $4,086.5, with potential expansion toward $4,881.9 if momentum holds.
🟨 Key zones:
$3,744 = retest zone
$3,830 = resistance-turned-support
$4,005 = psychological milestone
The 1-2-3 model is alive and well.
And ETF news + BTC support is the fuel ETH needed. 🔥
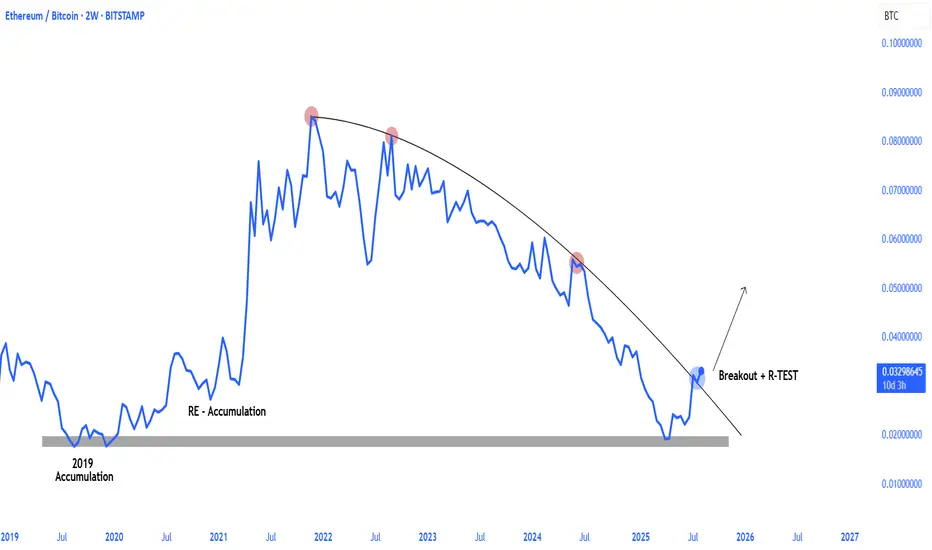
📊 ETHBTC – The Hidden Strength Ratio
This is what most traders miss:
➡️ ETHBTC has been in stealth accumulation mode.
Now aiming for 0.06274 — a huge reclaim zone not seen since mid-2022.
This ratio matters because it signals altcoin rotation, not just price action.
💀 SOLETH – The Bleed Continues
We called it months ago:
Solana may have great tech (Rust, speed), but it’s paying the price for memecoin mania and diluted narrative.
SOLETH is in freefall — currently below 0.045, with support at 0.04176 and 0.02080 next if weakness continues.
ETH is eating market share back.
📉 XRPETH – Short Hedge in Play
XRPETH structure remains bearish.
Even after multiple divergence plays, XRP continues to underperform against both BTC and ETH.
Target zones:
🧊 0.00004638
🧊 0.00002246
XRP fans — this is not personal. This is chart-based reality.
🗞️ Don’t Forget the Macro Backdrop:
SEC just greenlit direct BTC/ETH usage in ETF flows
Trump hints at crypto-friendly 401(k) policies
China is brewing something (rumor or tumor — still unclear 😅)
BTC just reclaimed $115,800, setting sights on $122,795 → $132,595
This market isn’t waiting for confirmation — it’s moving based on structure.
🚫 What I Avoid in This Cycle:
❌ Memecoins (low trust, no ETF tailwind)
❌ GameFi (zero relevance right now)
❌ Ghost L1s (no users = no bids)
🧠 Final Take:
Ethereum is clearly leading the pack.
BTC is reclaiming its throne.
Solana is bleeding relative to ETH.
XRP is stuck in divergence hell.
So we trade the structure, not the hopium.
📈 Alt season won’t be a meme — it will be rotation-driven, narrative-backed, and ETF-aligned.
📽️ Full explanation in my previous video post — check it out if you want full breakdown on ETFs, ETH’s structural strength, and the geopolitical backdrop with China.
One Love,
The FXPROFESSOR 💙
Disclosure: I am happy to be part of the Trade Nation's Influencer program and receive a monthly fee for using their TradingView charts in my analysis. Awesome broker, where the trader really comes first! 🌟🤝📈
ETH-D
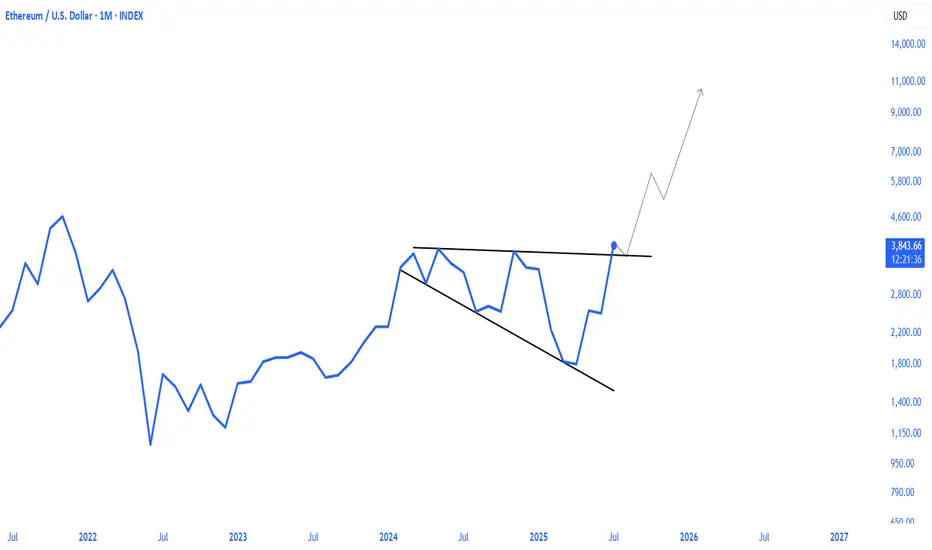
$ETHUSD: Long term trend and cup and handle pattern...Ethereum is finally very close to breaking out into a new 52wk high following a long term basing pattern that looks like a classic cup and handle. Timemode signals warned us of its bullishness earlier, as the daily, weekly, monthly and now quarterly trends turned bullish one after the other since April this year.
If you're sidelined or short, join the bulls and go long ASAP. Risk is a drop under $1715 for the long term patterns at play here, projected targets range from 10k to 95k long term. Fundamentals as you probably know favor a massive bullish trend as ETH transaction count breaks ATH, institutions race to acquire more ETH day to day, ETF flows are steadily bullish and regulations have become favorable for the growth of defi via stablecoin and RWA adoption, as well as potential for new defi primitives and existing ones to gain traction with widespread use.
Ethereum defi now is secure and solid enough, and can handle the required throughput, and the wheels are in motion for a spectacular move from here.
Best of luck!
Cheers,
Ivan Labrie.
ETH | Ethereum Game Plan - Swing Long IdeaETH | Ethereum Game Plan - Swing Long Idea
📊 Market Sentiment
Market sentiment remains bullish, supported by expectations of a 0.25% rate cut at the upcoming FOMC meeting. The weakening USD and rising risk appetite across global markets are favoring crypto assets in particular.
📈 Technical Analysis
Price swept the range low (Weekly Fair Value Gap), resulting in a deviation.
It then aggressively reclaimed higher levels and closed above key resistance.
A 12H demand zone was formed during this move.
We’re now seeing a retracement towards that 12H demand zone.
📌 Game Plan
I’m looking for price to hit the 12H demand zone at $3,530 and show a strong reaction.
This level is also below the 0.5 Fibonacci retracement, placing it in the discount area — an ideal entry zone for me.
🎯 Setup Trigger
After price taps the demand zone, I want to see a 1H–4H bullish break of structure to confirm the reversal before entering.
📋 Trade Management
Stoploss: Below 1H–4H swing low
Targets:
• TP1: $3,872
• TP2: $4,090
I’ll trail my stop to lock in profits aggressively as price moves in my favor.
💬 Like, follow, and comment if this breakdown supports your trading!
More setups and market insights coming soon — stay connected!

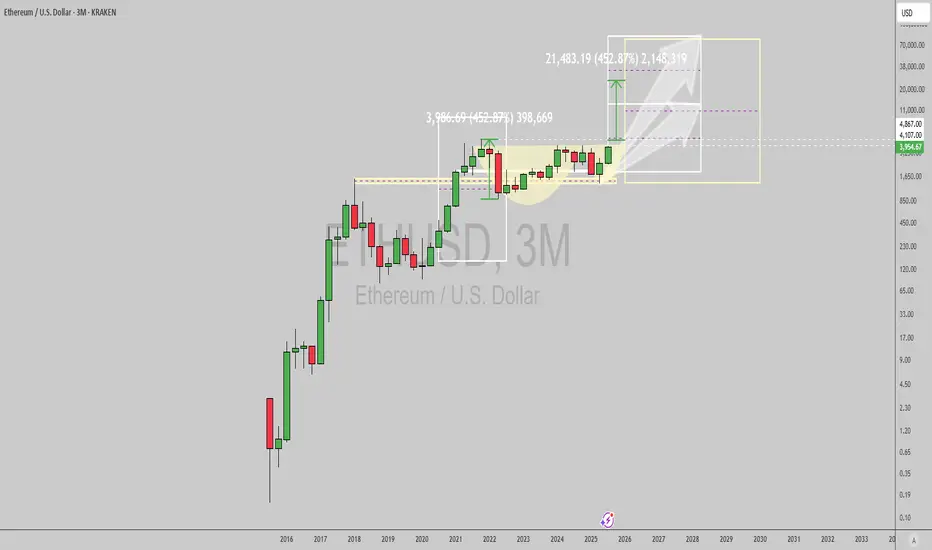
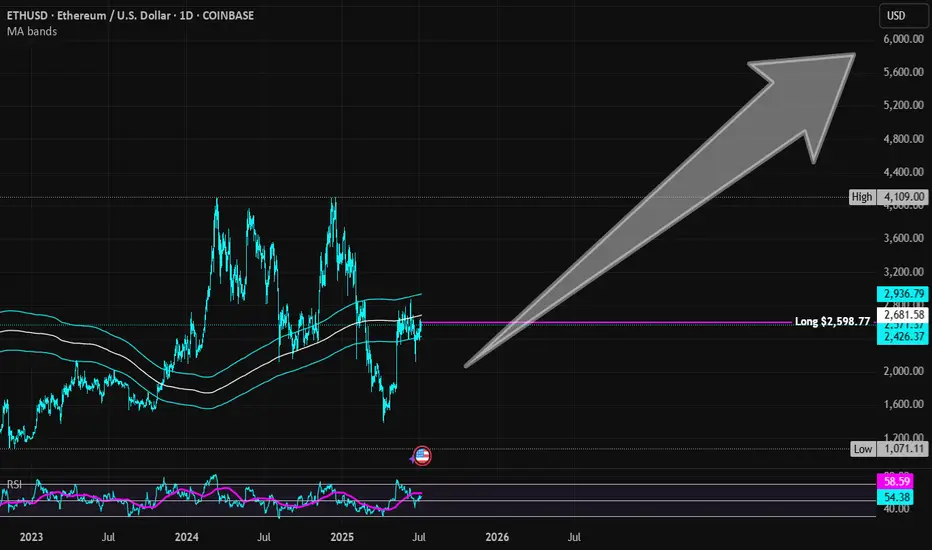
Ethereum | ETH | Long at $2,598.77Currently within my historical simple moving average area and consolidating. I suspect a move up is imminent, but 100% speculation. Crypto "bros" know more than I do.
Targets into 2028:
$4,000 (+53.9%)
$5,500 (+111.6%)
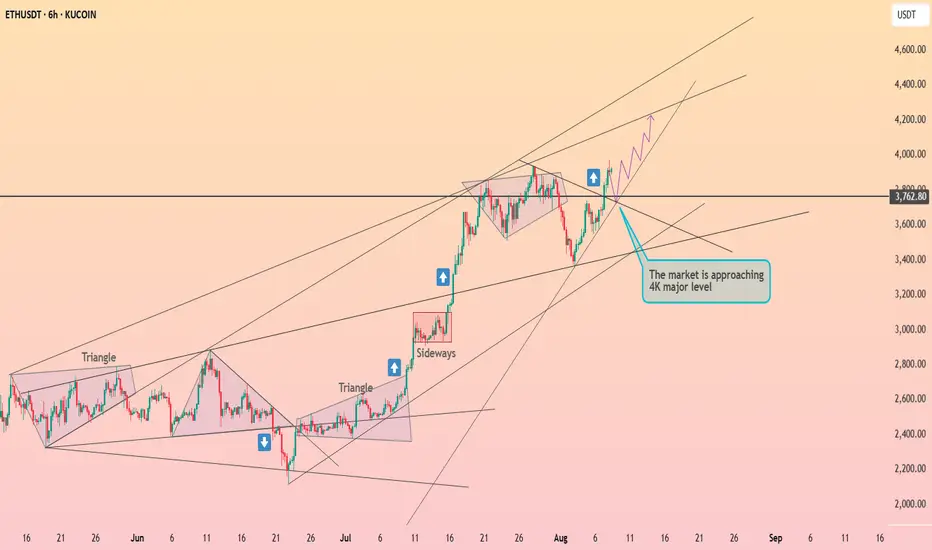
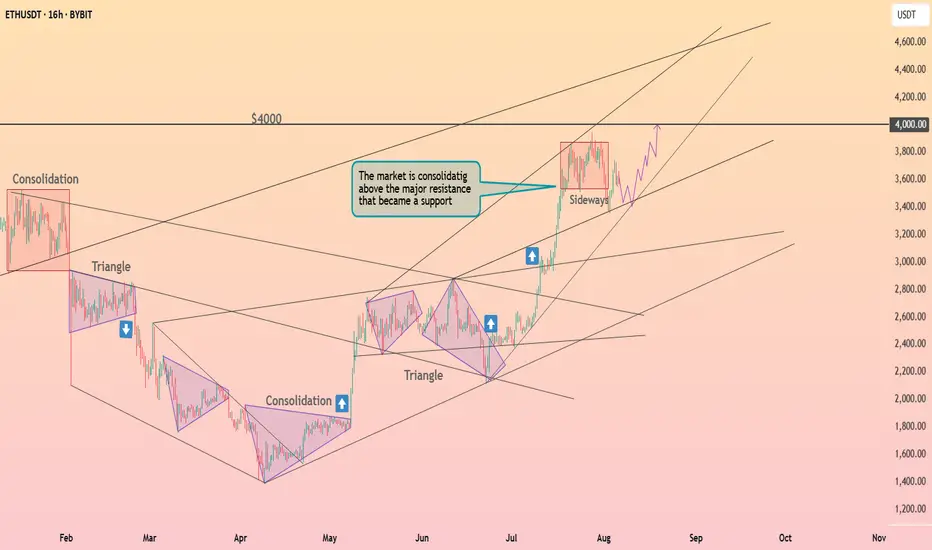
Ethereum is seeking to break through the $4k ┆ HolderStatKUCOIN:ETHUSDT recovered from a swift correction into rising trend support and is pressing back toward the 3.76–3.80k pivot. The broader pattern shows sequential triangle breakouts and a strong sideway accumulation that launched the last vertical leg. If 3.55–3.60k holds on dips, targets sit at 3.85k, 3.95k and the round‑number magnet at 4k. Only a decisive daily close beneath 3.50k would threaten the higher‑low sequence and re‑open 3.35k–3.40k. With breadth improving, the bias remains upward while price consolidates beneath resistance.
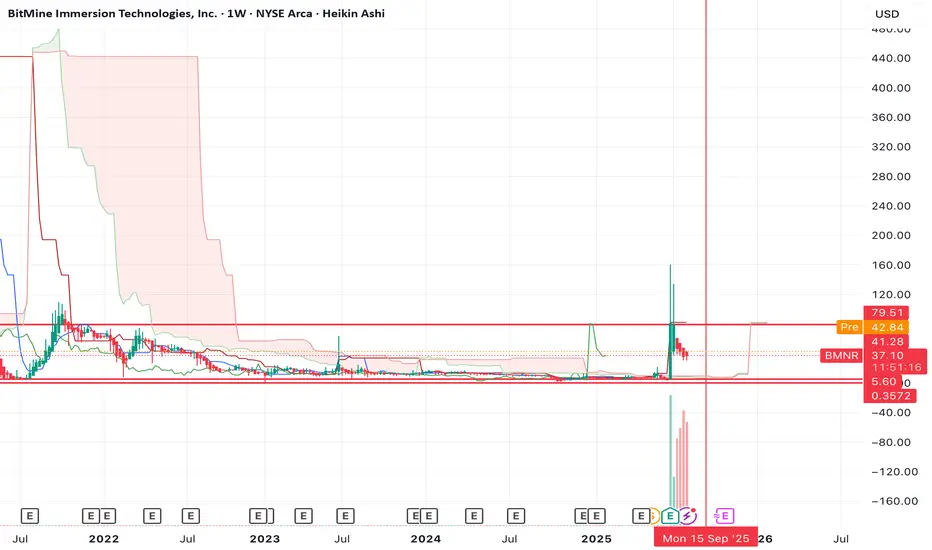
ETH is not having its "2017" moment, neither is BMNRDespite Tom Lee calling for ETH to $18k (which I happen to agree on btw), I think his timing is completely off. He's thinking that ETH is bullish here and that we're going to go to new highs this year.
I think the opposite. I think the top is already in for the year and that we're going to head to new lows first before we make our way to new highs.
BMNR doesn't look good either. The chart is bearish on the 3W and 1M timeframe with a bearish divergence on the RSI.
I think it's more likely that BMNR retests the lows before it sees any large pump.
Let's see how the chart plays out over the coming weeks/months.
DOGE Breakout?After a 13 day rally and a 12 day pullback, could DOGE be breaking out and confirming a new 4H trading range?
After a bounce off the bullish orderblock DOGE has broken out of the diagonal downtrend, then pulled back to retest the previous diagonal resistance level as new support. This is a textbook breakout play & retest but this doesn't 100% guarantee the breakout will be successful. Should it be a successful breakout Local Resistance is the first clear level of interest for the bears to fight back.
This type of setup does give a clear invalidation should price fall back into the downtrend with acceptance. A fakeout could also lead to a loss of the Major Support level, that would introduce a potential revisit of $0.166.

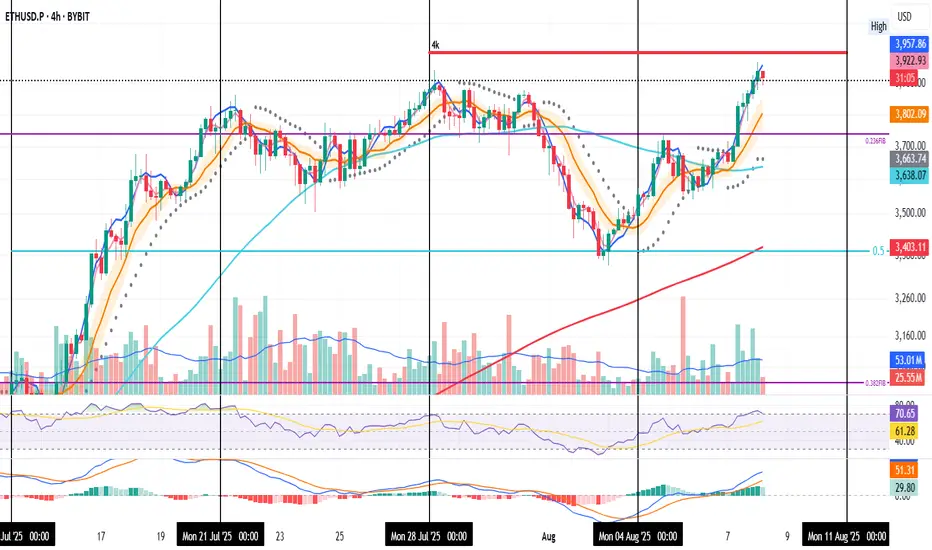
ETH Charging at $4K
ETH on the 4H
And just like that, ETH is knocking on the $4K door again. This move is absolutely beautiful.
After losing the 0.236 Fib last week and bouncing from the 0.5, ETH made another attempt earlier this week — got rejected — then broke above 0.236 like it was nothing.
Now, price is retesting yesterday’s close (black dotted line), which aligns with last week’s highs and is acting as short-term support. It’s gathering strength for the next push at $4K.
All signals align:
• MLR > SMA > BB Center
• PSAR flipped bullish
• RSI is cooling off
• MACD is fully bullish
Structure remains strong. Momentum is building.
ETH-related bullish news and stablecoin narratives are flooding the timeline.
I’ve started scaling back in and am watching how price reacts to the $4K resistance.
This part takes patience and focus — I’ll keep updating this idea as it evolves.
Always take profits and manage risk.
Interaction is welcome.
ETH Daily: Lower High, Lower Low. That Was My Signal
This is ETH on the Daily
Price action today looks very similar to December 2024.
Back then, ETH attempted twice to flip the 0.236 Fib level at $3378.45 — first on Dec 6, then on Dec 12. Both failed. Price found support at the 0.5 (midpoint between the 0.236 and 0.382), bounced, got rejected again at the 0.236, then went lower.
Now, we’re seeing a near-identical pattern:
– First attempt to reclaim the 0.236 Fib on July 21
– Second attempt on July 27
– Both failed
– Price found support again at the 0.5 middle level
– Bounced back to the 0.236
– Got rejected again
What will happen this time?
For me, the answer already came: we’ve now seen a lower low followed by a lower high — a temporary break of bullish structure. That’s my cue to scale out of my long and reduce exposure so I’m not caught off guard overnight.
Now that I’ve done that, I can observe the chart objectively without emotional bias or panic-selling.
Technically, ETH is in a short-term downtrend.
Fundamentally, however, I believe we’re in the early stages of a larger uptrend, driven by strong bullish news around crypto (happy to list them if you're curious).
But until those bullish narratives start kicking in and price moves up again, I have to be extremely careful not to get wiped out — so I’ll stay closely aligned with price action.
Like I said: short-term downtrend, long-term opportunity.
Always take profits and manage risk.
Interaction is welcome.

$ETH \ $BTC GONNA SEND INCOMING!The Ethereum-Bitcoin parity saw a local bottom after a long-term correction phase and began to move upward. The upcoming process will continue with a sharp upward trend.
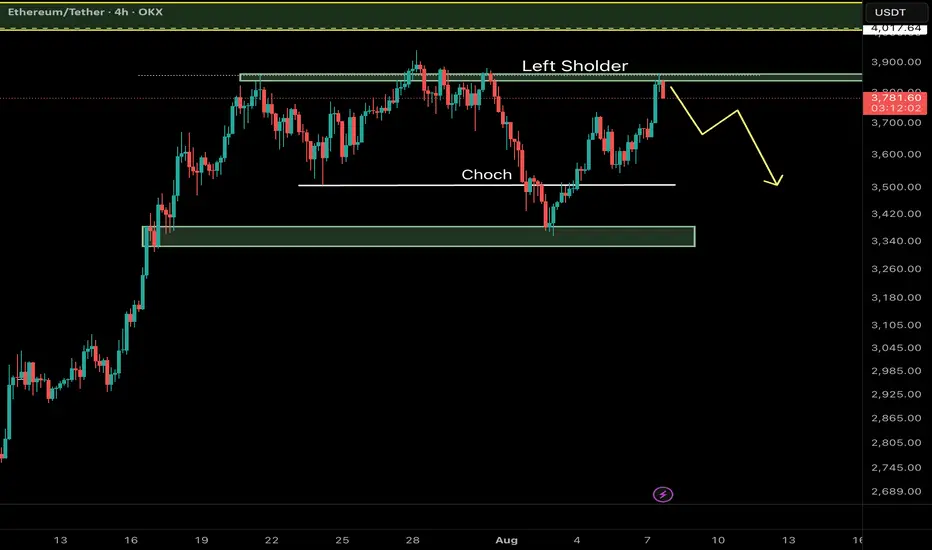
Ethereum (ETH/USDT) – Key Reversal Zone RetestAfter a major CHoCH (Change of Character) on the 4H timeframe, Ethereum has shown a strong bullish move from a high-probability demand zone and is now retesting a critical resistance area aligned with the Left Shoulder of a classic RTM pattern.
⸻
🔍 Key Technical Elements:
• CHoCH confirms the shift from a distribution phase to accumulation.
• Strong reaction from a demand zone near $3,340–$3,380.
• Price is now testing the Left Shoulder, which often acts as a reaction zone before continuation.
⸻
📌 Potential Scenarios:
🔼 Bullish Case (Primary):
If ETH breaks and closes above $3,870, a move toward the next liquidity pool around $4,010–$4,050 is likely.
🔽 Bearish Case (Alternative):
Failure to hold above the current resistance may lead to a pullback toward the $3,340–$3,380 demand zone for another accumulation attempt.
⸻
💡 Educational Note:
In RTM methodology, retests of the Left Shoulder after CHoCH are considered one of the most efficient entry zones — especially when confluence with liquidity voids or imbalance exists.
Follow for more Smart Money & RTM insights.
ETHSimple chart :
- Don’t fight the trend, just stick to your strategy.
- follow the signs.
- Never go all in and always DCA.
Only this way we will learn to master our emotions.
Happy Tr4Ding !
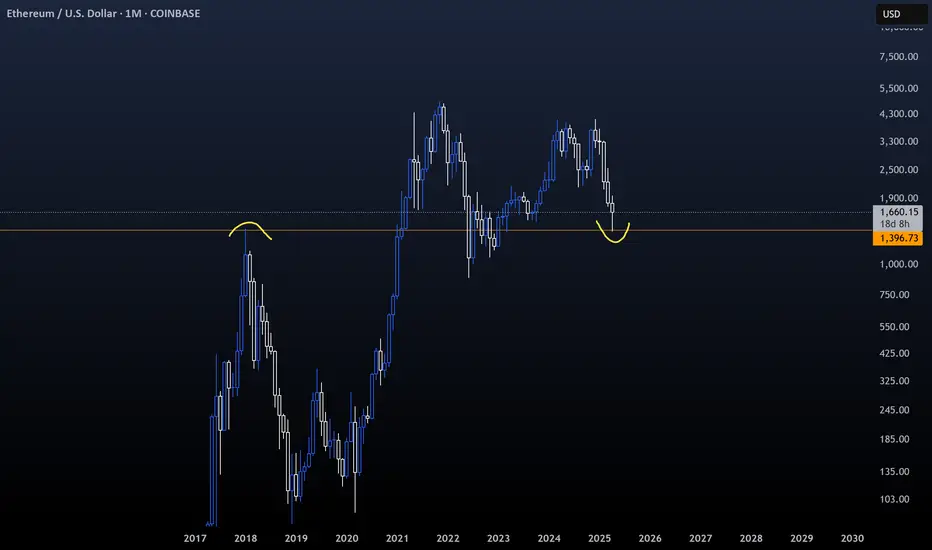
Ethereum Not Dead- i know some peoples think ETH will go to 250$ or 500$, so wait for it...
- I've always maintained that I'm not a fan of ETH because of its scalability limitations and centralization, for that reason ETH needs some messy L1...L2...etc..
- That said, my opinion doesn’t matter much, ETH is here to stay. The Ethereum ecosystem hosts thousands of projects; I’d say it’s too big to fail.
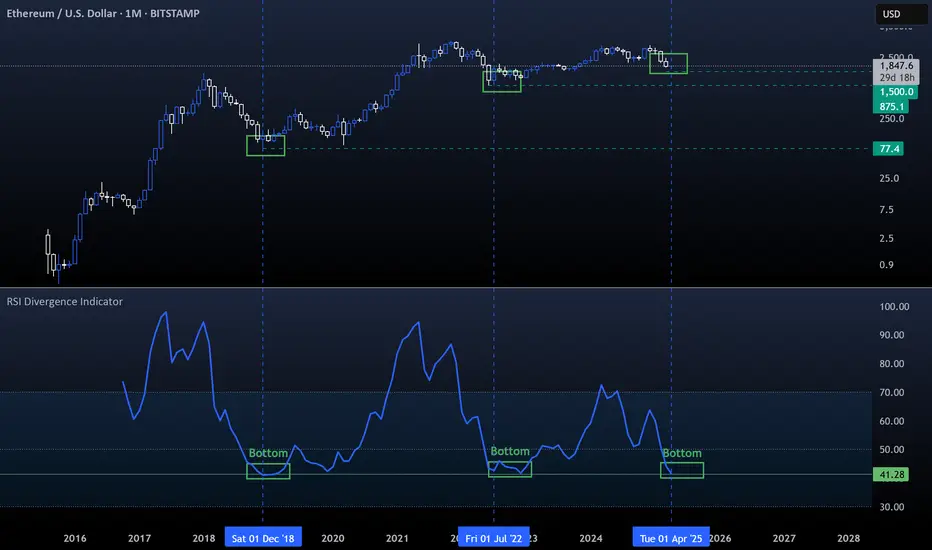
- i used Bitstamp exchange to look further back in the chart's history.
- i simplified this monthly chart so much that even a 10 year old kid could understand it, just check the RSI low levels and compare it with previous years. Again, check the max RSI level for the previous ATHs.
- i won't discuss where to buy because, whether you get ETH at $1,800 or $1,500, the bull run for ETH and Altcoins hasn't started yet.
Happy Tr4Ding !
Ethereum Long Trigger Just Got Valid — Don’t Miss This SetupHey, it’s Skeptic from Skeptic Lab.
In this breakdown, we’re looking at a fresh long opportunity on Ethereum after a clean 45% move from our last trigger.
I’ll walk you through the daily and 4H timeframes, explain why the correction looks weak, and where the next breakout trigger is setting up.
Plus, I’ll show you how ETHBTC can help confirm the move and improve your risk/reward.
If this gave you clarity or value, give it a boost — and I’ll catch you in the next one.
Disclaimer: This is not financial advice. Always do your own research before making any trading decisions.

Ethereum is consolidating ┆ HolderStatBYBIT:ETHUSDT is trading within a consolidation zone just under $4000 after rallying from sub-$3000 levels. The trend remains strong with prior triangle and consolidation patterns fueling upward moves. A continuation breakout may test the $4000 barrier soon.
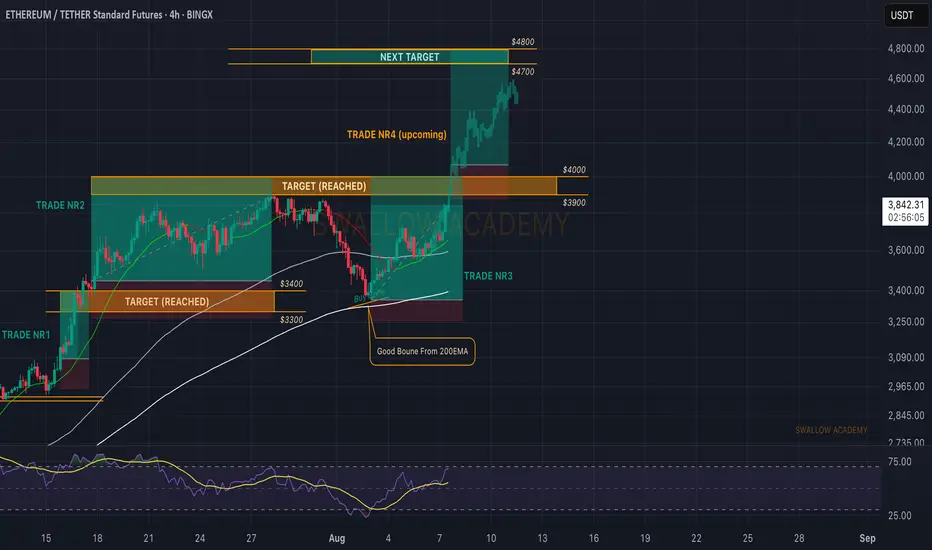
Ethereum (ETH): On Fire, Heading For Another Breakout Attempt ETH is on fire, where the price is catching the buyside momentum and probably going for that $4000K breakout attempt once again, where our trade will be closed as well (in the region of $3950-$4000).
So we wait for that zone to be reached and once we break it there, we will be looking for another entry for a long to $4800!
Swallow Academy
ethereum breakout bullish megaphone pattern ETHEREUM broke the bulish megaphone pattern in the 1M timeframe. it will continue to rise after the retest phase that will occur with the monthly closing today.
Ethereum ETH at Key Resistance: Here's My Trade PlanEthereum (ETH) has maintained a fairly bullish structure overall 🟢, but price is now trading into a significant resistance level 🧱📈. I’m closely monitoring for a reaction at this zone — ideally a rejection that leads to a pullback into a key support area 🔄📉.
If ETH finds support and we get a clean bullish break in market structure from there 📊🚀, that could present a high-probability setup to the long side — contingent on price action confirming the bias. 🔍 Not financial advice ⚠️.

Support & Resistance – Quick Guide In 5 StepsSupport and resistance are key concepts in technical analysis that help traders identify where price is likely to react.
Support acts like a floor — a level where buying interest is strong enough to prevent further declines.
Resistance acts like a ceiling — a level where selling pressure can stop price from rising.
These zones often lead to bounces, reversals, or breakouts, and are used to plan entries, exits, and stop-losses.
How to Identify them:
1. Assess the chart.
2. Identify Swing Points: Look for repeated highs/lows and label them. (Flags)
3. Multiple touches: Highlight the zones with multiple touches. 2+ Touches are stronger.
4. Define: Clearly define the zones. Above is resistance, below is support.
5. Entry: When price makes it way down to support, wait for the reversal. Upon reversal enter on the low time confirmation. Ensure price has failed to break below the support.
Then set TP to the previous High/Resistance zone.
Tips:
Always treat S&R as zones, not exact lines.
Combine with trend, candlestick patterns, or volume for better confluences.
Avoid trading into strong S/R — wait for breaks or retests.

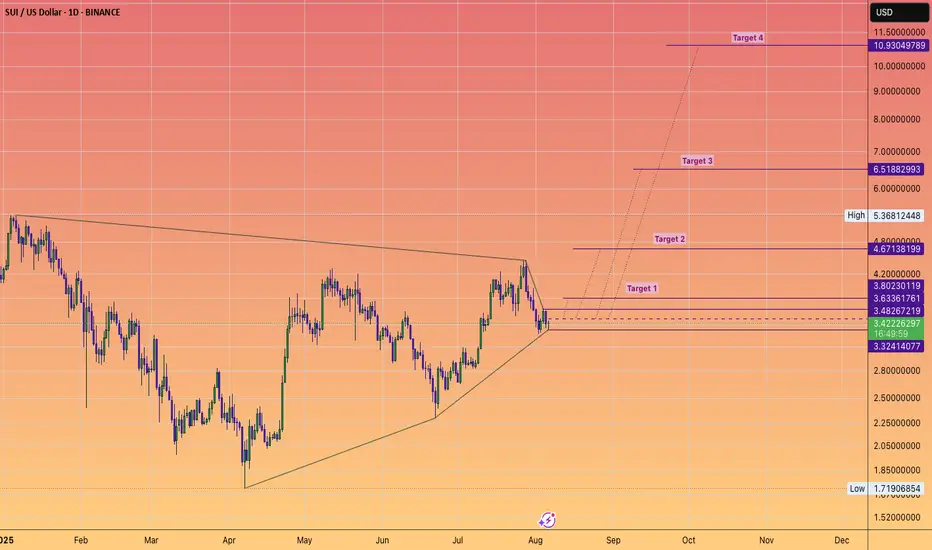
Can SUI end the year at over $10?Sounds wild sitting here in August.
But those are the type pf moves possible on a new cycle blockchain entering the last parabolic run of the 4 year cycle.
Now we are still unsure when this cycle will end?
Q4 of 2025 or does extend April/May of 2026.
Either way SUI has potential of compressed price action, waiting for #ETH to break above $4100 is probably going to be the trigger that starts the party.
BCH May Be The Next MYX - 5-10x Coin TL;DR – BCH is lining up a classic supply-shock + utility-boom setup.
Halving has already cut new coins 50 %, while CashTokens + May-25 upgrade unlock real smart-contract demand. Fees are still < $0.01 so merchants keep onboarding, and Wall-Street-backed EDX just gave institutions a clean on-ramp. With on-chain volume at multi-year highs and regulatory clouds clearing (CLARITY Act), even a modest uptick in adoption can squeeze a float that’s shrinking fast. Add it up and the 10 factors below paint a clear path for BCH to re-rate well beyond current levels.
Post-halving supply squeeze – The 2 April 2024 halving cut block rewards 50 % to 3.125 BCH, slashing new supply while demand stays constant.
May 2025 protocol upgrade – Adds VM Limits & BigInt, letting devs deploy more complex smart-contracts directly on BCH.
CashTokens layer live – Since May 2023, anyone can mint fungible tokens & NFTs; 26 000+ tokens launched in the first 24 h.
Institutional on-ramp via EDX Markets – Wall-Street-backed exchange lists BCH next to BTC & ETH, unlocking RIA and pension flows.
Ultra-low fees (< US $0.01) & 32 MB blocks – Makes BCH practical for point-of-sale payments while BTC fees hover near US $2.
Growing merchant footprint – BCH ranks #4 on Crypwerk; BitPay shows alt-coin check-outs (inc. BCH) now 36 % of crypto payments.
On-chain activity surging – Daily tx count ~53 k; social buzz has pushed BCH to new 2025 highs, signaling fresh interest.
Regulatory clarity coming (CLARITY Act 2025) – Likely to classify many tokens as commodities, reducing U.S. legal overhang.
Re-rating potential – Still 60 % below 2021 high; a modest multiple expansion on revived fundamentals could move price sharply.
Positive momentum & analyst targets – After reclaiming US $600, several desks now project a move toward US $1 000 this cycle.
Marty Boots | 17-Year Trader — smash that 👍👍, hit LIKE & SUBSCRIBE, and share your views in the comments below so we can make better trades & grow together!

ETH 1H – Trendline + Demand Zone Converge, Will Bulls Step In?Ethereum is approaching a high-confluence zone on the 1H chart — where rising trendline support intersects with a prior demand zone that triggered the last major rally.
This area around $3,500–$3,430 represents a key test of short-term momentum and trend structure.
🔹 Technical Confluence
Strong ascending trendline from mid-July has held through 3 clean touches — and is now under pressure again.
The blue demand zone was the launchpad for ETH’s move toward $3,800, showing clear price memory.
Price is now approaching both zones while momentum is fully reset on the Stoch RSI.
🔹 Momentum & Setup
The Stoch RSI is hovering in oversold territory — just as ETH returns to structure.
A higher low in this zone would confirm buyer interest and setup a potential breakout toward $3,900+.
🔹 Scenario to Watch
A clean bounce + reclaim of local structure would confirm a bullish continuation setup.
Failure to hold this level could trigger a trendline break and deeper retracement — invalidating short-term bullish structure.
Will ETH defend this zone and continue the trend — or is a breakdown brewing?
Let me know your thoughts in the comments 👇

Ethereum (ETH/USDT) – Midline Break Retest and Channel Top in Si🔍 Technical Overview
Ethereum has recently broken above the midline of its descending channel, indicating a potential bullish shift within the short-term corrective structure. The price action suggests that we are currently witnessing a retest of the broken midline, which is now acting as dynamic support.
This behavior is consistent with smart money principles — where a previously broken internal structure gets tested before continuation.
⸻
🧠 NEoWave Context
Structurally, ETH appears to be developing a Contracting Corrective pattern, with the current leg likely evolving as Wave D. This wave typically exhibits strength and complexity, often stretching toward the channel top while still respecting broader consolidation boundaries.
⸻
💡 Smart Money Insights
• ✅ BOS already confirmed on LTF (1H, 4H) with higher lows
• 🔄 Price has reclaimed the internal broken structure (midline) and is retesting it
• 🔋 Bullish OB around $3,480–$3,510 acted as a launch zone for current leg
• 📍 Next resistance is the channel top near $3,740
⸻
📊 Trade Scenarios
🟩 Bullish Scenario (Preferred):
If the retest of the midline holds, ETH is likely to continue its move toward the upper boundary of the descending channel (~$3,730–$3,750). This aligns with Wave D expectations in complex corrections.
🟥 Bearish Invalidations:
A breakdown back below $3,520 and loss of the internal bullish structure would negate this short-term bullish scenario and reopen downside potential toward $3,350.
⸻
⚠️ Trader Tip:
Retests of internal structures like midlines or internal trendlines often provide low-risk continuation setups — if confirmed by bullish internal BOS.
⸻
✅ Conclusion
Ethereum remains technically corrective but with bullish momentum building within the channel. As long as the midline holds, we expect continuation toward the channel top, completing Wave D structure before potential reversal.
💬 Drop your alt counts or thoughts in the comments.
