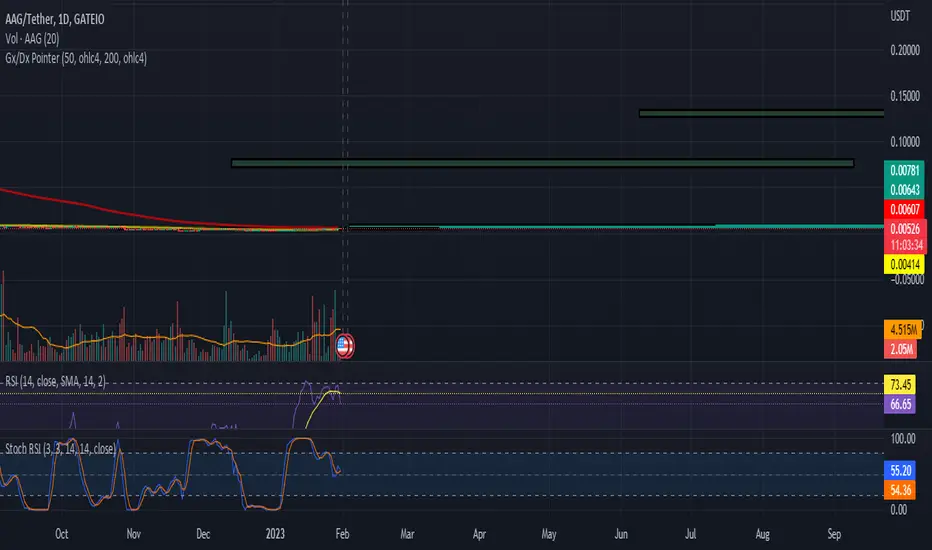
AAGUSDT Long-Term Hold If the price hold $0.00507 well, then, we'll have good move upward for next months will be great for AAG if they keep hard working then we goanna see golden-cross on daily chart that support our side then we can see $0.05 & $0.13 but keep calm and don't invest more than 2% its risky
DYR.
Eth-usdt
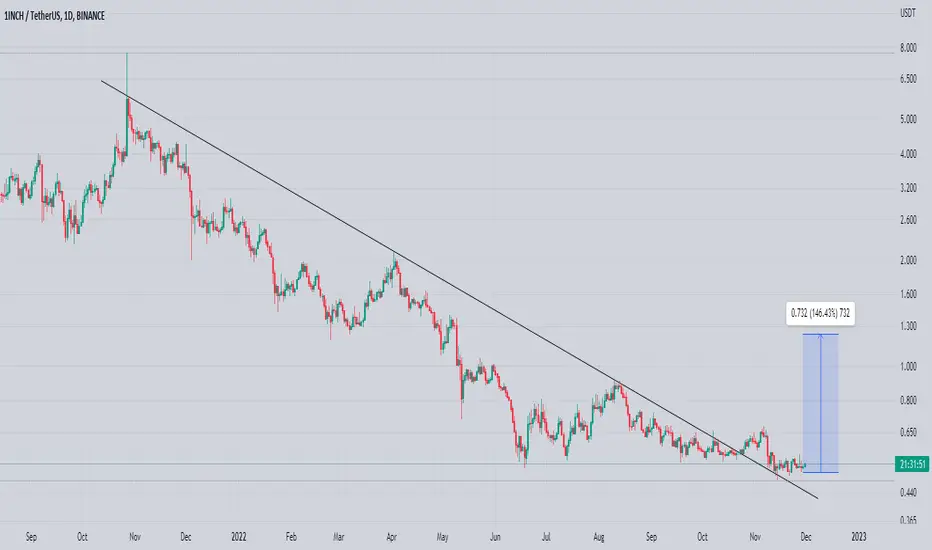
High Coin breaking Out Breaking descending Channel In daily timeframe
Incase Of breakout expecting 180 To 200% Bulish Move Keep Eyes On Highusdt For breakout
(Note) always wait for Confirmed breakout

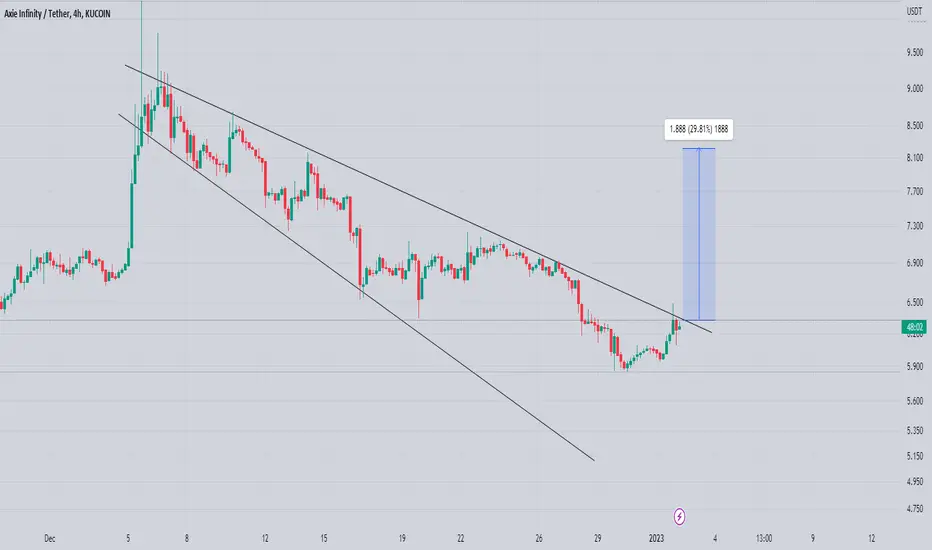
Axsusdt Formed Descending Broadening In H4 timeframe ( bulish Reversal Pattern)
Incase Of Breakout expecting 20 to 25% Bulish Move
Keep In Mind Axs Will Remain Bearish Till Wedge breakout (entry Will Be Only Valid after Breakout)
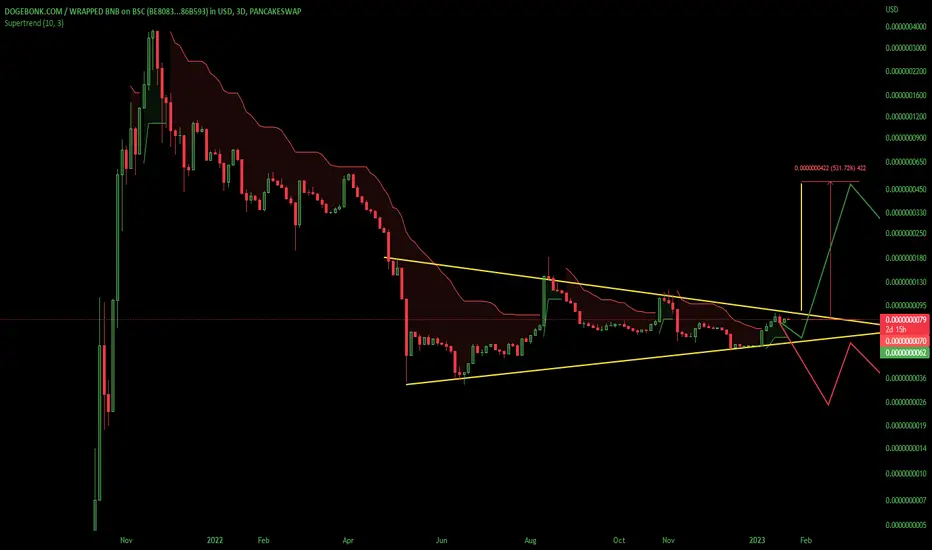
DOBO USD DodgeBonk Symmetrical TriangleDOBO is consolidating within this symmetrical triangle after its massive run up on the log scale. Symmetrical triangles could break to the upside or the downside. I believe if Bitcoin continues its run after a small correction then DOBO will break this pattern to the upside for a measured move up to the .00000005 level with a FOMO extension to possibly .0000001. If Bitcoin and the rest of the crypto market enters a longer downside correction then DOBO will probably break down for a measured move to .0000000025 level before a bounce and a retest of the prior support turned resistance level of the bottom of the bottom of the triangle and then continue to the downside. I am leaning more towards a break to the upside. This is not financial advice this is just my opinion. Thank you.
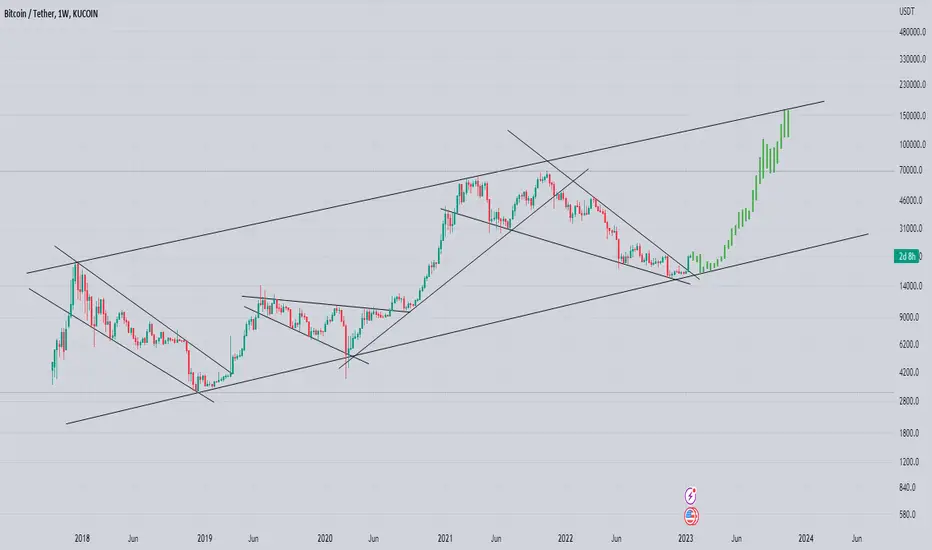
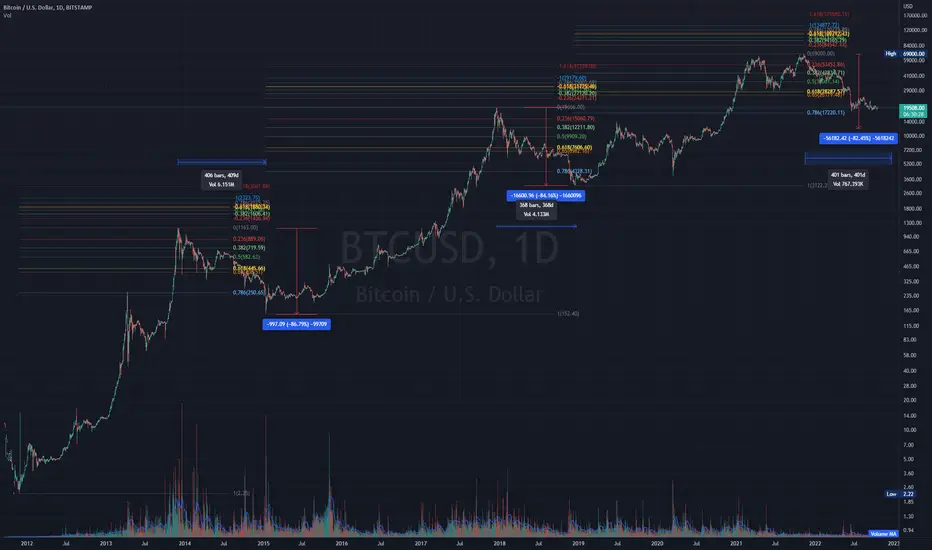
Bitcoin Higher Timeframe Analysis Lets Check Btc Behaviour Of Recent years
Btc Over All Moving In Ascending Channel From few Years In weekly Timeframe
And Btc Test Trendlines Of Channel And If Its breaks Pattern Withen Channel Than Usually Btc tests Opposite Tl Of channel
Now Btc tested Trendline Beautifully And Bounced With strong Buying volume Also Btc Breaks Falling Wedge withen Channel
And If we Compare Btc From Its recent history than We Can See Clearly A test Of Upper trendline Of ascending Channel almost (180000) Area
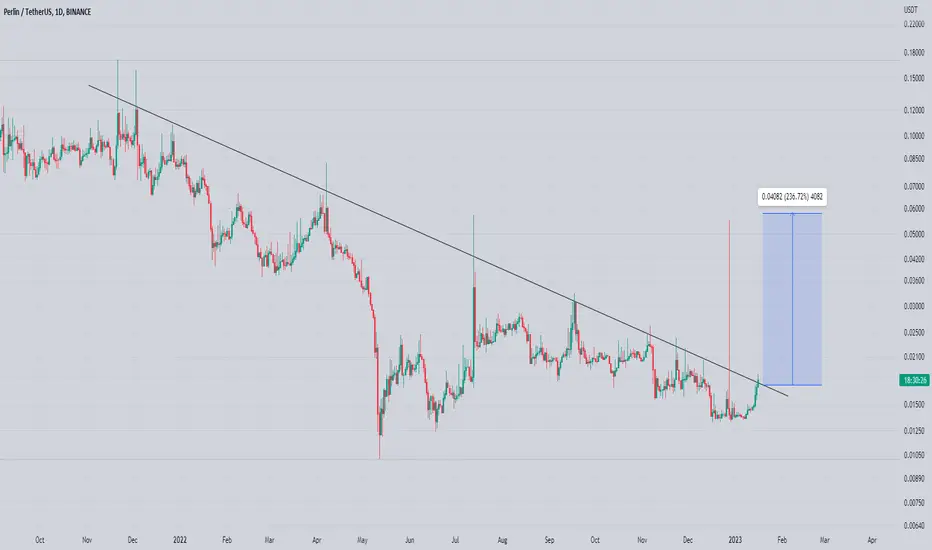
Perpusdt Breaking Trendline Breaking trendline In daily Timeframe incase Of Successful breakout expecting 150% to 180% bulish Wave
Keep In Mind Entry will Be Only valid Once Breakout confirmed
💲 Ethereum Get Ready For 1800$ 💲💲 Ethereum Get Ready For 1800$
💲 Nearest strong support zone: around the edge of the triangle.
💲 Nearest strong resistance zone: around 0.236 of the downward wave.
💲 Technical environment:
- Moving averages: 50/50
- MACD: Uptrend
- RSI: Uptrend
💲 Price action: Ethrereum has shot up beautifully, exactly as I wrote in my last post that this is the last chance to buy ETH at 1200:
After the breakout from the accumulation, I expect to execute a downward correction in the coming days due to the upcoming trend of strengthening of the US dollar. After the correction, I expect the trend to continue.
💲 The scenario I play out is a correction followed by a continuation of the uptrend. I don't exclude the possibility of changing the scenario if the market situation changes abruptly. I'm aware of the possibility of a correction at any time, this should be taken into account, If the outlook changes I will publish a post with an update, so I encourage you to actively follow the profile and read the description carefully.
💲 Please do not suggest the path I have outlined with lines it is only a hypothetical scenario.
🚀 If you appreciate my work and effort put into this post then I encourage you to leave a like and give a follow on my profile. 🚀
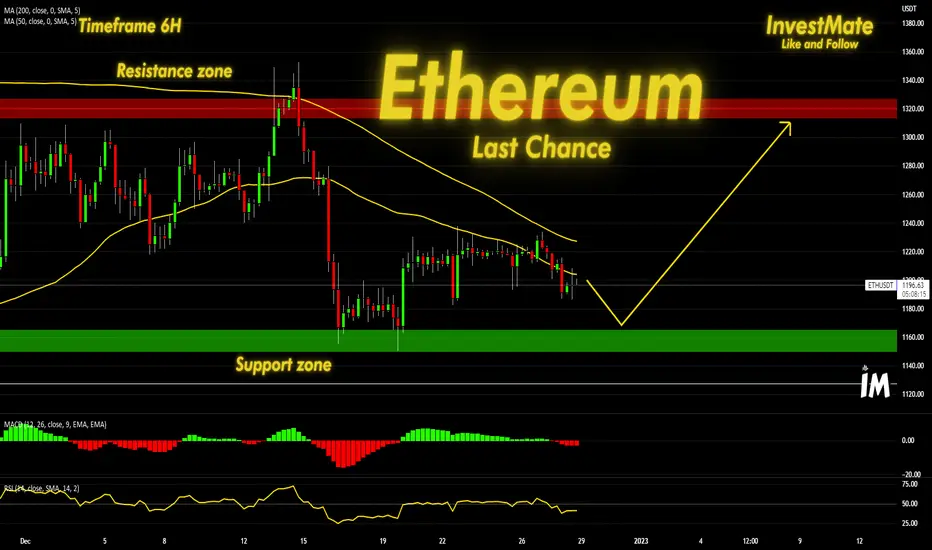
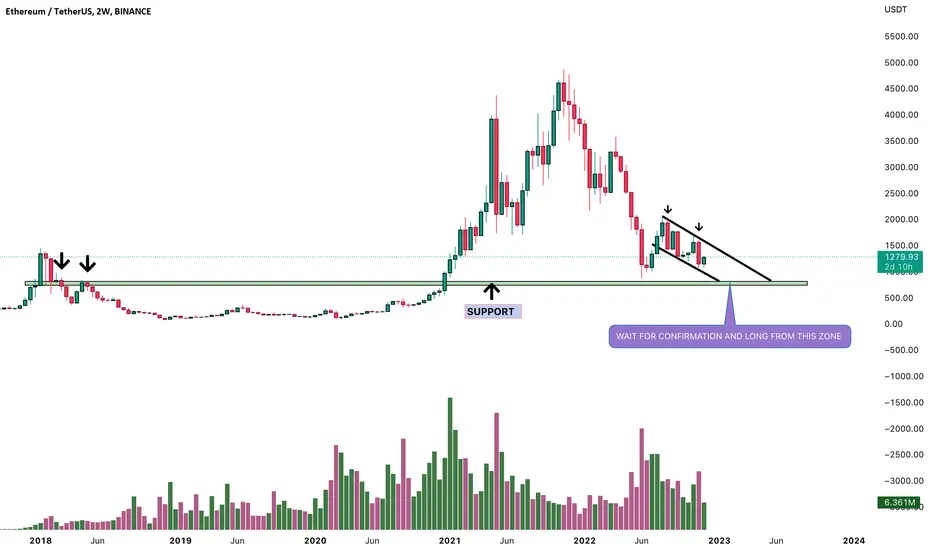
💲Ethereum Last Chance💲💲Ethereum Last Chance
💲Is this the last chance to buy ETH below $1200?
💲It seems so.
💲Looking at the technical situation and the months-long accumulation around $1200.
💲We are slowly running out of strength to continue declines.
💲At least to make new lows.
💲There is no longer a willingness to resell ETH at lower prices.
💲Looking at the price action environment and technical analysis indicators, there is a good chance of ETH breaking out above $1200 in the next few weeks.
💲I have set a support zone near the levels that have been a strong barrier difficult to break through.
💲The nearest strong resistance zone is around the 0.618 level of the entire upward wave from the bottom to the recent local peaks.
💲The scenario I am playing out is to wait for the start of a new wave of Ethereum strengthening. I don't exclude the possibility of changing the scenario if the market situation changes abruptly. I'm aware of the possibility of a correction at any time, this should be taken into account, If the outlook changes I will publish a post with an update, so I encourage you to actively follow the profile and read the description carefully.
💲*Please do not suggest the path I have outlined with lines it is only a hypothetical scenario.
🚀If you appreciate my work and effort put into this post then I encourage you to leave a like and give a follow on my profile.🚀
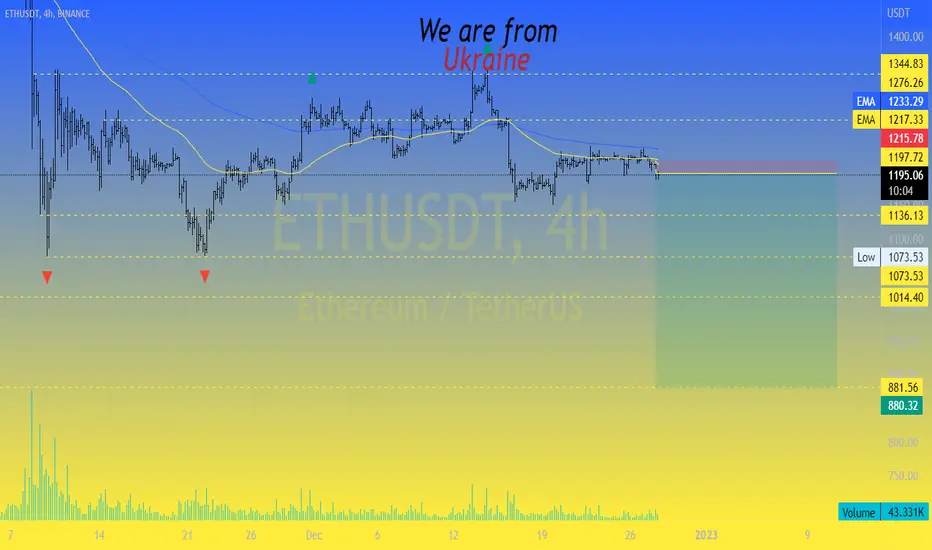
Good evening, we are from Ukraine!Good evening.
I leave a promising deal that will work in the near future. If you want more such deals and a more detailed overview of the situation, follow my page, because there will be a lot of interesting and useful things ahead!
Good luck to everyone!
#ETH
#ETHUSDT
#USDT
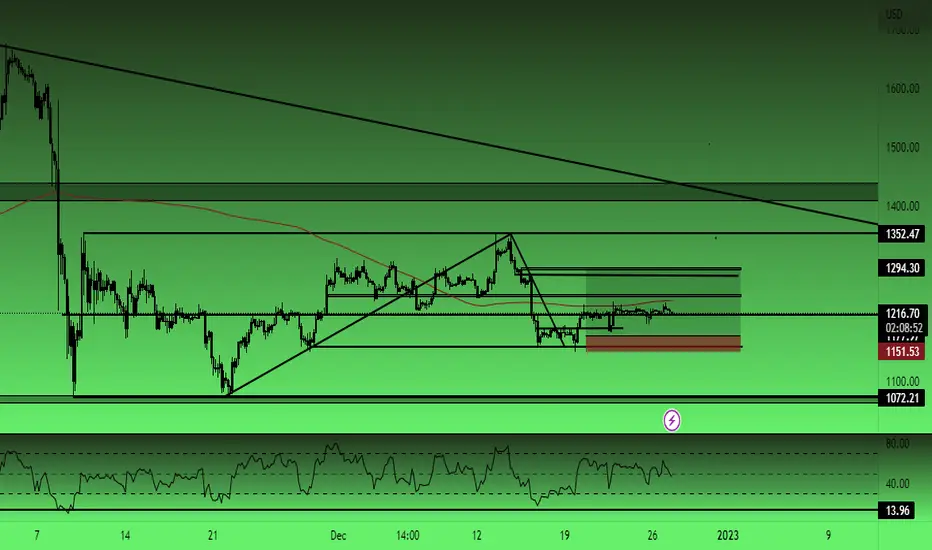
#eth $eth four hourly play update:so far no reason to think it wont reach target. pa has been extremely tight with probability leaning toward supply areas. onward
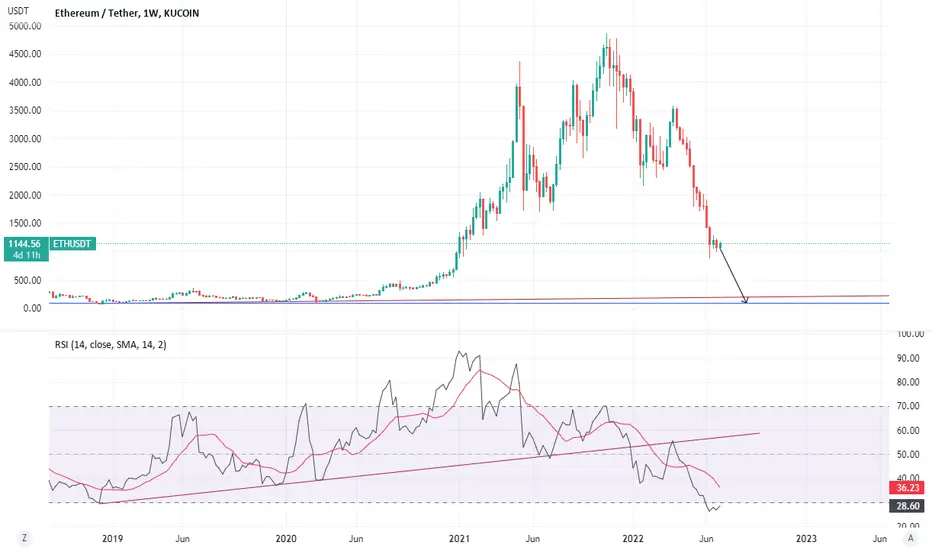
💲Ethereum Falls Into A Support Zone💲💲Ethereum Falls Into A Support Zone
💲Ethereum is following in the footsteps of Bitcoin, which I have also written about, but here the declines compared to previous candles are much larger.
💲Looking at where we are on the chart I get the impression that a drop to the vicinity of the support zone seems very likely.
💲This was determined by the 0.786 level of the entire wave from the bottom to the top of the upward correction.
💲This is a key price level, and on many occasions the price has reacted at this level.
💲I determined the resistance zone based on the 0.618 level of the same wave as the support zone.
💲Looking at the technical environment, the fact that we are under the 50 and 200 moving averages, the MACD and RSI are generating upward signals. I have no doubt about the higher probability of declines at this point on the chart.
💲The scenario I am playing out is a continuation of the declines to the vicinity of the support zone. I'm aware of the possibility of a correction at any time, this should be taken into account, If the outlook changes I will publish a post with an update, so I encourage you to actively follow the profile and read the description carefully.
💲*Please do not suggest the path I have outlined with lines it is only a hypothetical scenario.
🚀If you appreciate my work and effort put into this post then I encourage you to leave a like and give a follow on my profile.🚀

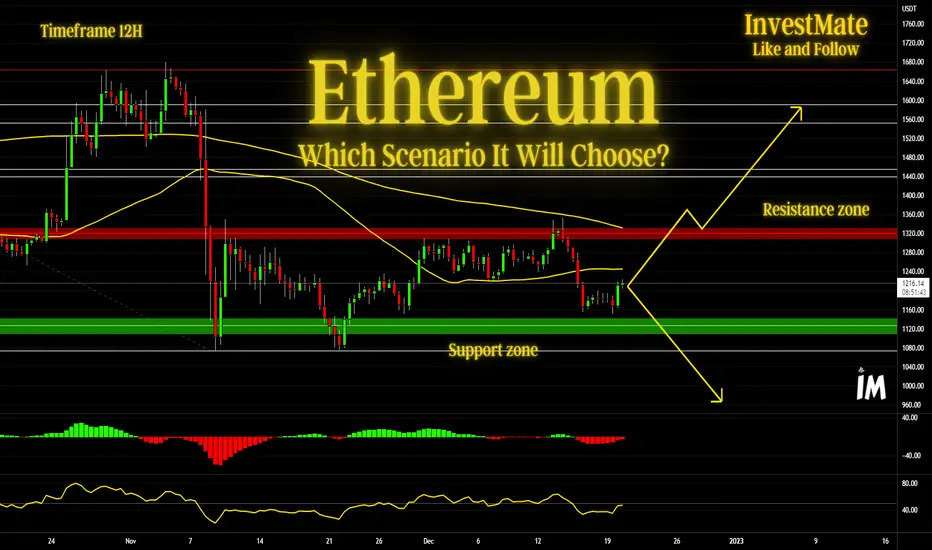
💲Ethereum Which Scenario It Will Choose?💲💲Ethereum Which Scenario It Will Choose?
💲Ethereum faces an important choice just like the rest of the cryptocurrencies.
💲Everyone is watching which direction it will choose.
💲There are two scenarios for ETH.
💲The first downward scenario. We break through the support zone and fly towards the recent lows.
💲Second scenario. A breakout occurs, we break through the resistance zone and head north.
💲The situation is currently uncertain and we should wait for a decisive move in either direction.
💲The scenario I play out is to wait for a strong price reaction and to join the trend. I'm aware of the possibility of a correction at any time, this should be taken into account, If the outlook changes I will publish a post with an update, so I encourage you to actively follow the profile and read the description carefully.
💲*Please do not suggest the path I have outlined with lines it is only a hypothetical scenario.
🚀If you appreciate my work and effort put into this post then I encourage you to leave a like and give a follow on my profile.🚀
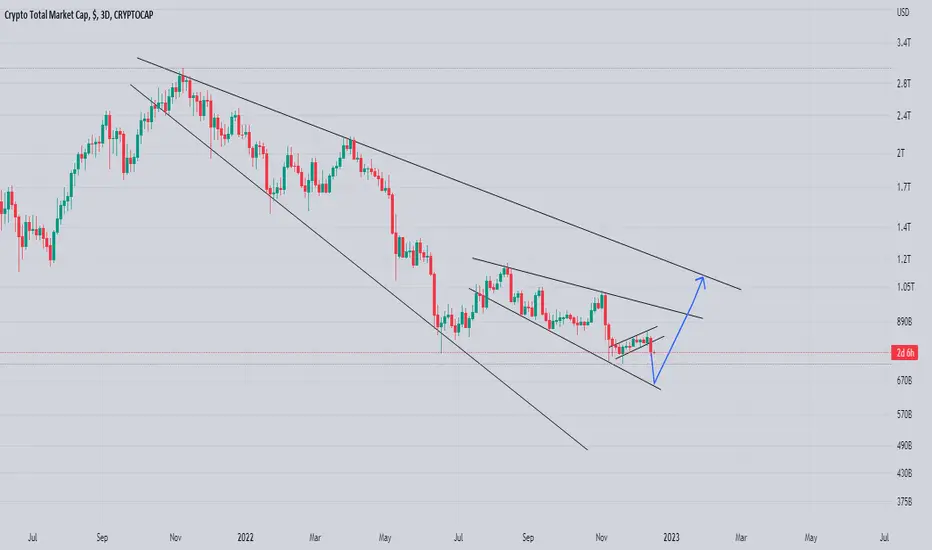
CRYPTO MARKET UPDATE Looks Like we Will Face Bearish Moves For Sometime
We Can Expect Market To Bounce To Continue Its Uptrend Bounce Can Be Expected From Descending Wedges Lower Line
ETH and BTC have the same trend!Hello everyone,
Everything is going according to my recent analysis and ETH will go down to 85 to 94$.
BTC Bearish 1.15 to 3.56% 12 13 2022If you love the spot-on analysis done so far, please boost, share, comment, and follow for more.
Do we have room to retest ATH for 12.13.2022? Yes. This is why in the chart, this short move is labeled as TEMP. As predicted in the previous analysis, after we broke the $17,500 level, we broke free to $18k like a wild bird discovering flight for the first time.
Now presented to us is an opportunity for a quick short trade with potential TP labeled below. Note: if we don't retest the $18K today or tomorrow, this will be the beginning of our journey to a new ATL for 2022.
A private chart layout was used to prompt an earlier entry into this short trade analysis. Typically, we would wait for yellow MA to cross over the lower dotted white FIB in the 5min chart before we signal an entry point.
Safe points to take profit:
T1: 1.15%
T2: 1.74%
T3: 2.59%
T4: 3.56%
Baseline Information:
The strategy used for this analysis takes into account the following factors:
Timeframe: 3min and 5 min
Symbols: BTCUSDT , ETHUSDT , BTCDOWN, and ETHDOWN
Exchange: Binance
Indicators: For obvious reasons, precise indicators names can not be provided, but this analysis makes use of VWAP , moving averages, and Fib charts.
Chart Count: 8
Disclaimer:
The information and publications are not meant to be or constitute financial, investment, trading, or other advice or recommendations.

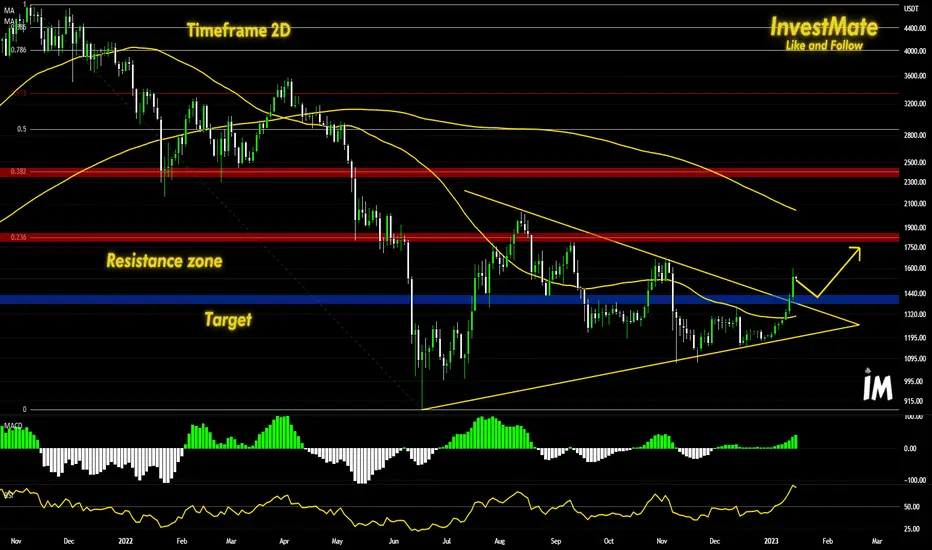
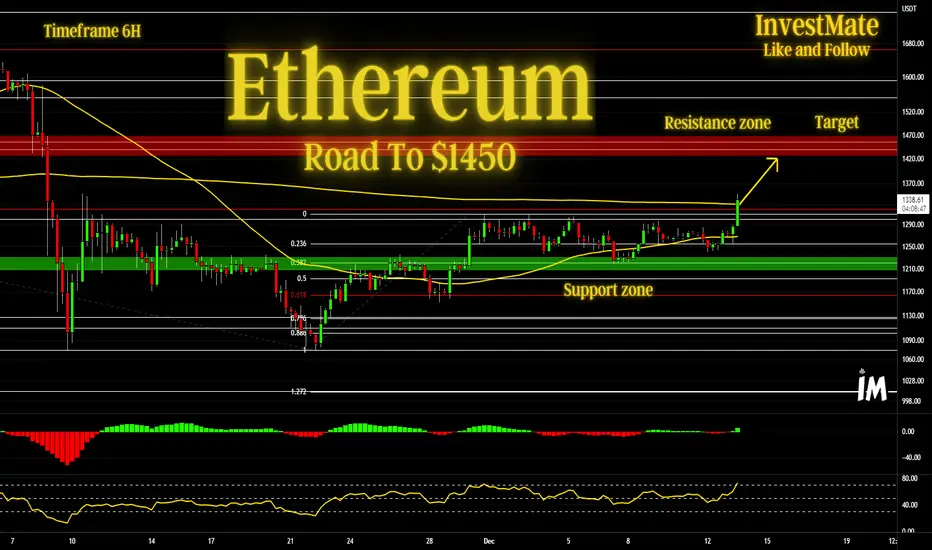
InvestMate|Ethereum Road To $1450💲💲Ethereum Road To $1450
💲That's how I perfectly predicted in a previous post the start of the current upward wave on ETH:
💲Yes this time I come to you with an update of my perspective.
💲As we can see, the price has started its way northwards over the last few days.
💲The target is the levels around $1450
💲The resistance zone set out in the previous post is located there.
💲Seeing that we are above the 50 and 200 moving average.
💲MACD and RSI are clearly presenting bullish signals I don't see why the price should have any problem with increases at this point.
💲The scenario I am playing out is a continuation of the upside to the vicinity of the first local resistance zone. I'm aware of the possibility of a correction at any time, this should be taken into account, If the outlook changes I will publish a post with an update, so I encourage you to actively follow the profile and read the description carefully.
💲*Please do not suggest the path I have outlined with lines it is only a hypothetical scenario.
🚀If you appreciate my work and effort put into this post then I encourage you to leave a like and give a follow on my profile.🚀
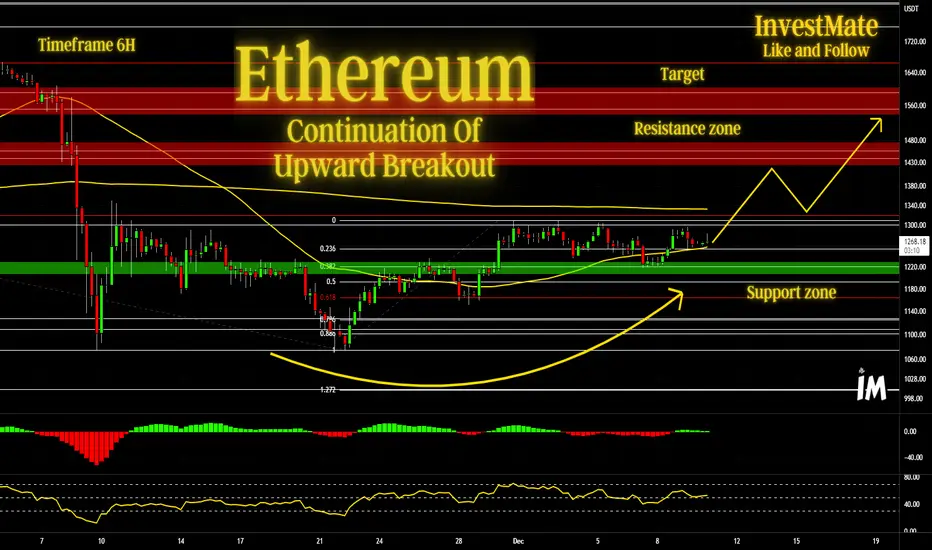
Ethereum Continuation Of Upward Breakout💲💲Ethereum Continuation Of Upward Breakout
💲Post is a direct continuation of the previous post in which I predicted the upcoming breakout
💲In this post we will look at the chart from a slightly closer perspective.
💲As you can see ETH has been holding steady since the last post. Slowly climbing to higher and higher levels.
💲The support zone which I think is significant is the 0.382 level of the entire upward wave from the bottom of 22.11.2022 to the peak of 30.11.2022
💲The nearest significant resistance zone is around 1450 where there is a cluster of two fibo levels. The first level is 0.382 of the entire downward wave from the peak on 14.08.2022 to the bottom on 22.11.2022 The second level is 0.5 of the entire upward wave from the bottom on 18.06.2022 to the peak on 13.08.2022.
💲The next important resistance zone is around 1570 where we also have a cluster of two levels. The first level is 0.5 of the wave from the peak on 14.08.2022 to the peak on 22.11.2022. The second level is 0.382 of the whole upward wave from the peak on 18.06.2022 to the peak on 13.08.2022.
💲This is where I expect the price to arrive in the coming weeks.
💲As you can see the MACD is also indicating an uptrend
💲A RSI is holding steadily above the 50 level.
💲The scenario I am playing out is a continuation of the upward trend over the next few weeks. I'm aware of the possibility of a correction at any time, this should be taken into account, If the outlook changes I will publish a post with an update, so I encourage you to actively follow the profile and read the description carefully.
💲*Please do not suggest the path I have outlined with lines it is only a hypothetical scenario.
🚀If you appreciate my work and effort put into this post then I encourage you to leave a like and give a follow on my profile.🚀
ETH IDEA Hello guys this is my trading idea about ETHUSDT .
LIKES AND FOLLOW for more Ideas Thank you .
ETH USDT Long 👑Hello TradingView community 🚀 and my followers, please if you like the ideas, don't forget to support them with likes and comments, thank you very much and here we go.
Today I want to talk to you about the ETH chart.
At the moment price break the structure.
Then, I think ETH breaks continue to move up to my goal.
My target is located at charts level.
I expect this scenario.
This is my opinion, I really hope it will be useful for you.

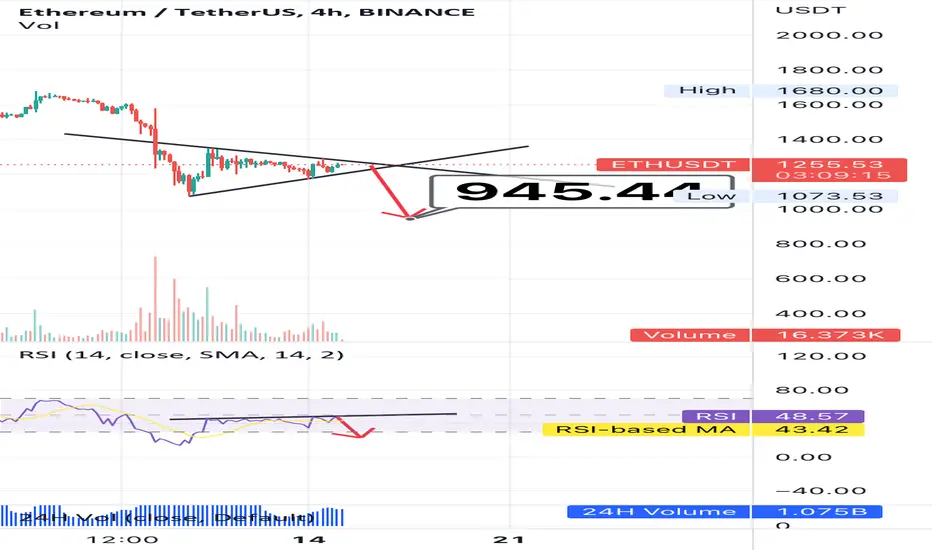
bearish divergence On 4H ChartHello
according to the chart we expect a dump from here, please Set SL and you know in crypto there is no 100% chart so trade by yourself
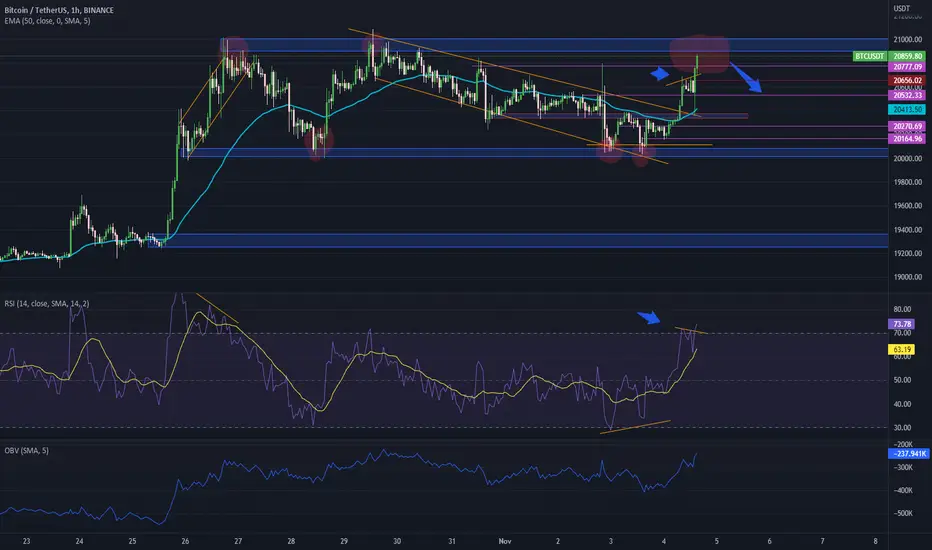
BTC at the moment :Since October 26 until now, the price has varied between $20,000 and $29,500, with respect to the areas highlighted in the image. the price will go down to 20000 $ resist it or breaking it to the downside reaching 19350 $ as last resistance, for this to happen the price must break the last support shown in red, it will return to 20000 $; if the price tests the last resistance shown in red, it will break 20950 $ and rise and continue going higher . There is a big divergence on the RSI indicator as the price reaches the support of the price range. We must wait for the price to break previous lows.